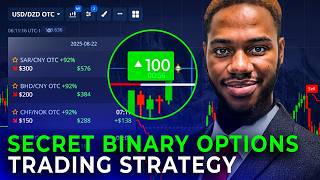

Experimenting with MACD & SuperTrend
44sViewers are drawn to unique trading experiments that promise fresh insights and potential profits.
▶ Play Clip"Title accurately describes the strategy and timeframe, but results may not be typical."
This video presents an experimental trading session using a 1-minute binary options strategy combining MACD and SuperTrend indicators. The trader demonstrates how to configure these indicators, identify entry signals, and manage trades, while sharing rules for reliable setups and risk management.
The trader emphasizes adding new elements to trading, such as different position management or indicator settings, to avoid getting stuck in patterns and to develop faster.
Uses 1-minute candlestick chart with MACD and SuperTrend indicators. SuperTrend ATR period set to 8, multiplier 2. MACD fast period 6, stop period 20, signal period 8.
Opens a $100 trade predicting price rise. Identifies SuperTrend trigger below chart indicating uptrend, and MACD crossing zero level with lines crossing, confirming trend reversal.
Price increased, capital grows to $1,587. Trader increases trade amount to $150 for next trade.
Opens a trade to reduce price. SuperTrend indicates downtrend, MACD confirms with lines crossing and chart below zero level. Both indicators must trigger to open a trade.
Second profitable trade, net worth reaches $1,725. Trade amount increased to $200.
Forecasts price decrease. Both indicators confirm downtrend. Trader advises against seeking large quick profits, recommends smaller trades to preserve capital.
Opens last trade predicting continued decrease. Account ends at $2,185. Trader emphasizes making correct entries over earning everything at once.
The trader successfully demonstrates a 1-minute binary options strategy using MACD and SuperTrend, achieving profitable trades by waiting for both indicators to confirm signals and managing risk with smaller trade sizes.
What are the two indicators used in this trading strategy?
MACD and SuperTrend.
01:01
What time frame is used for the chart?
1 minute.
00:49
What are the SuperTrend indicator settings used?
ATR period 8, multiplier 2.
01:13
What are the MACD indicator settings used?
Fast period 6, stop period 20, signal period 8.
01:28
What condition must be met before opening a trade?
Both indicators must give a trigger confirming the trend direction.
04:35
What does the SuperTrend indicator show when an uptrend is confirmed?
A trigger appears under the chart indicating an uptrend.
02:49
What does the MACD indicator show when a downtrend is confirmed?
The indicator chart builds below the zero level and lines cross each other.
04:22
What is the recommended trade amount for the first trade in the video?
$100.
02:23
What advice does the trader give about profit goals?
Never strive to earn large sums immediately; open more trades for smaller amounts to preserve capital.
06:11
Experimental Approach
Encourages continuous learning and adaptation in trading.
00:05Dual Indicator Confirmation
Emphasizes the importance of waiting for both indicators to confirm before trading.
02:49Risk Management Advice
Advises against chasing large profits quickly to reduce risk.
06:11Small Steps Lead to Results
Demonstrates that consistent small gains can accumulate to significant profits.
07:27[00:05] experiment. I always try to add something new, a different approach to position management, slightly different indicator settings, or just a different angle of view on the market. Now, this helps you not to get stuck in one
[00:20] pattern and develop faster. Today, I will conduct trading in this experimental format. I'll explain exactly what I want to test, open a few deals, and tell you what conclusions I'm drawing lines. Along the way, you will
[00:35] see trading in search mode and real discoveries. Now, I will start the session and open trades. But first, let's configure the account and turn on the indicators. I'm using the candle chart type and the time frame is 1
[00:49] minute. This bundle will help you quickly see all the price changes.
[01:01] Now open the indicator section and select the MSED and super trend. the indicators for the time of the trade. I will reduce the super trend ATR
[01:13] period indicator to eight and the multiply will be two. This way the indicator will trigger more often. [Music] The MACD indicator will have a fast period of six, a stop period of 20, and
[01:28] period of six, a stop period of 20, and a signal period of 8. start looking for suitable situations and start opening trades. I think I can
[01:41] get a wonderful result by working with this strategy and you will clearly learn how to use it. So here we go. In the video, I only share part of the information and leave all the most relevant observations in Telegram. Now,
[01:55] analytical notes and also important levels and my personal comments on the current market situation are published there every day. So, it's very easy to connect. Click on the link in the description, subscribe, and be sure to
[02:09] write to me personally. This way, I can help you navigate and answer if you have any questions. I found an interesting chart. Let's open the trade and analyze the situation in more detail. I will use the trade time of one minute and I will
[02:23] make the trade amount $100. My forecast is that the price is going to rise and is that the price is going to rise and press the green button to open a trade.
[02:36] Yep. The market has been in a downward trend for a long time. The price has been declining and reached its minimum. and the price increase began. As soon as the price rose and crossed the previous level of the super trend indicator, an
[02:49] indicator trigger appeared under the chart indicating an uptrend. But confirmation alone is not enough. So let's check the MECD and allows you to open a trade. The MACD indicates zero level is important to me. The indicator
[03:05] graph was built below it. There was a decrease in price as soon as the price started to rise. The chart also began to point upwards as soon as the indicator point upwards as soon as the indicator chart crosses the zero level and begins
[03:19] or begins rather to build above it. This is the second trigger that confirms the uptrend. Now the indicator lines also crossed each other showing me that a trend reversal has occurred. As you can see both indicators indicates a price
[03:34] increase. This is a reliable situation. The price is going to rise. Now later I'm going to tell you about the rules for working with this strategy. If you follow them, you will open trades and reliable situations.
[03:55] Wow. The price increased my capital to $1,587. will not waste time looking for the next situation. After you spending some time searching and ready to open another trade, I am increasing the trade amount
[04:08] to $150. This time I will open a trade to reduce This time I will open a trade to reduce the price. super trend indicator has triggered a price decrease. This means that the
[04:22] uptrend is ended and the price will decrease. The MECD indicator also confirms this situation. The indicator lines have already crossed each other and the indicator chart has begun to build below the silver level. The
[04:35] decrease. When working with the strategy, it is important that both indicators give a trigger. Only then you can open a trade. If only one of the indicators indicates a trend change, then you cannot open a trade. The
[04:48] trigger from the MEC is important. At the beginning of an uptrend, the indicator lines should intersect with each other and the indicator chart will be built above the zero level. In case of a downtrend, the situation will be
[05:02] the opposite. The indicator chart will be built below the zero level. Also, pay great attention to the currency pair. The trend should change steadily, but not too often. Now, currency pairs in which the promise chart moves in a
[05:17] straight line are absolutely unsuitable. These are the basic but important rules These are the basic but important rules when working with the strategy.
[05:31] Yes, the second profitable trade in a row. Now, my net worth is $1,725. There are still a couple of trades ahead. What do you think the next result of the session will be? The trade amount is already $200. My forecast is that the
[05:44] price is going to decrease. It's time to open a trade. situation in the previous trade. Both indicators indicate a decrease in the
[05:57] price. I am sure that this is a reliable situation and I will be able to make a profit. I'll give you some advice that's going to help you in your future work. Never strive to earn large sums immediately and quickly. No, this often
[06:11] leads to great risks. Now, it's better to open more trades but for smaller amounts. So even in the case of an unprofitable trade, you will still have the capital to continue working. In addition,
[06:24] addition, I recommend this to you that always set goals for yourself that you need to achieve over a period of time. Now this way you're going to motivate yourself even more to continue working and
[06:38] achieving your goals is going to cheer you up. capital has increased. I see that the account has an amount of $1,99.
[06:55] Let's find another situation and open the last trade. I have no doubt that I have taken the right situation into account. I open the trade little later than the situation was found. This is acceptable in this strategy. Now, I
[07:07] think the price will continue to decrease and I will increase my capital even more. I'm sure you'll like this strategy and use it often in your work. But in the meantime, let's follow the situation to the end.
[07:27] profitable trades. I see that the account now has an amount of $2,185. Today, I have shown that even small steps can lead to wonderful results. I wasn't trying to earn everything at once. No, I was trying to just make the
[07:42] right entries. Now, Rink is a goal to study every day, even if it's just one new conclusion. Write your opinion about this strategy in the comments.
⚡ Saved you 0h 07m reading this? Transcribe any YouTube video for free — no signup needed.