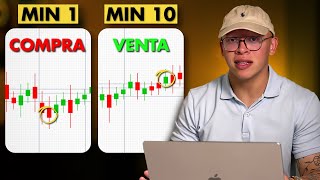

You Only Need 50% Win Rate to Profit
45sChallenges the common belief that high win rates are necessary, sparking curiosity and debate among traders.
▶ Play Clip"Title promises a strategy with 50% success rate leading to profitability, and the video delivers exactly that with clear steps and backtesting data."
This video presents a trading strategy for the New York session (7-11 AM) that requires only a 50% win rate to be profitable due to a 1:2 risk-reward ratio. The strategy uses a 5-minute chart, a time zone indicator, order blocks, and Fibonacci retracements to identify high-probability entries.
You don't need a high win rate; 50% or less is enough to be profitable with a 1:2 risk-reward ratio.
Add the 'Time Zone' indicator to TradingView and set it to New York time. Adjust the time zone between 7 and 11 AM.
Every day during the New York session (7-11 AM), a high and low point are formed. The strategy aims to identify one of them with 50% probability.
On the 5-minute chart, look for the last opposing candle before a strong move immediately after 7 AM. That candle is the order block.
Use the Fibonacci tool from the last high to the last low. Place a sell limit at the 50% retracement level.
Stop loss is 2 pips above the order block. Take profit is set at 1:2 risk-reward ratio.
1) Wait for 7 AM. 2) Wait for a new order block indicating high/low. 3) Wait for 50% Fibonacci retracement. 4) Place limit trade with 1:2 TP and 2-pip SL.
Over 6 months of backtesting, the average win rate was around 53%.
1) One trade per day. 2) Risk 1% per trade. 3) Can trade news with real capital. 4) No trades on holidays. 5) No trades outside 7-11 AM.
This simple strategy, combined with strict rules, can yield consistent profits even with a modest win rate. The key is discipline and following the steps precisely.
What is the minimum win rate needed for this strategy to be profitable?
50% or even less, due to the 1:2 risk-reward ratio.
00:02
What time zone must the TradingView chart be set to?
New York time.
01:37
What is the time window for trading this strategy?
Between 7 AM and 11 AM New York time.
02:30
What timeframe is used for this strategy?
5-minute chart.
04:13
How is an order block identified?
It is the last opposing candle before a strong move immediately after the session starts.
04:00
Where is the entry placed?
At the 50% Fibonacci retracement level.
05:06
Where is the stop loss placed?
Two pips above the order block (for sell trades).
05:47
What is the risk-reward ratio for take profit?
1:2.
06:00
What was the average win rate over 6 months of backtesting?
Around 53%.
15:15
How many trades per day should be taken?
Only one trade per day.
16:10
What percentage of capital should be risked per trade?
1% per trade.
16:39
Can this strategy be used on other markets besides forex?
Yes, it works on any market including crypto.
17:37
Profitability with Low Win Rate
Challenges the common belief that high win rate is necessary; shows that risk-reward ratio is key.
00:02Session High and Low Concept
Simplifies market structure to a binary outcome, making the strategy easy to understand.
02:30Backtested Win Rate
Provides concrete data (53% win rate) to support the strategy's viability.
15:15Strict Trading Rules
Emphasizes discipline and risk management as crucial for long-term profitability.
16:10[00:02] in your trades to be profitable? You don't even need to be 30% successful; just 50%, or even less, is enough to be profitable. As you teaching a community of students how to trade and become
[00:15] developed a strategy with a 50% success rate, but it will help you become 100% profitable. Let's start with the strategy. Many people are searching on improve their trading, and how to stop losing so much, not realizing
[00:30] that difficult. On this YouTube channel, strategies, but this is one of the most developed, even tested for over six months in backtesting data so
[00:43] you can use it. This strategy is very simple and consists of just a few steps. If you can implement it step by step and execute it perfectly, you'll undoubtedly be able to grow your trading account, and you don't need to have the highest
[00:56] good; sometimes you can get 60%, sometimes 70%. And how does that strategy work? First, you need to add this indicator. This indicator represents time. It's this shadow you see here on the chart
[01:10] because my chart is white and has this gray shadow. You add it here in the indicators section, and it's called Time Zone. This indicator basically divides identify where the price is going; it
[01:22] so you have a small time divider. Then, once you have that left and modify the time zone between 7 and 11 AM. Notice that your TradingView chart is set to New York time here
[01:37] because all the strategies and concepts I'm going to teach you will be in New York time. That's why you need to have it set to New York time here. It doesn't matter if you live in Peru, Colombia, Buenos Aires, or wherever you live; it
[01:49] has to be 7 AM New York time. If it's 9 AM in your country, look up what time it is in New York in your country. Once you have this divided time zone, this is going to be the most important part because
[02:03] time-limited. You won't have to spend all your time on the chart looking for afternoon, evening, or in the early morning. Literally, if the strategy doesn't work within this timeframe, you just
[02:17] of this video, I'm going to give you the crucial part for the strategy to work, and without that part, it literally won't work no matter how long you 've tried it. The strategy consists of the following: every
[02:30] day, during this period between 7 and 11 AM, a high and a low point are formed. This period between 7 and 11 AM is basically the New York session, but I've realized through study
[02:43] that this specific timeframe is where the price moves the most, and this strategy only works during this time. It's a We could make a variation for the London session if you can't trade
[02:56] between 1 and 5 AM, which is a 4-hour window, but I prefer that the the session I tested it on the most. In the Ono session, I didn't have as much testing. Now, what will it consist of? Each day in the
[03:09] New York session, a high point and a low point are created. We don't know where the high point will be created, nor do we know where the low point will be created. And with just two tools, we can identify with a 50%
[03:21] probability where the high point and the low point will be created. Because guess what? If the high point is created— let's say this is the high point, we know what's going to happen. If this is the high point, it means that now
[03:34] a low point will be created. Because in each trading session, there is a high point and a low point: the point where the price was quoted at its highest and the point where it was quoted at its lowest. If we manage to identify the
[03:46] highest point, then our direction will be to look for the lowest point, that is, a selling direction. And how are we going to do that? Immediately after that session begins, that period of time between 7 and 11 in the morning, once at 7 a.m.
[04:00] Tomorrow, what we're going to do is try to identify the first order block created. We're going to look for the last opposing candle before a strong move immediately after the session starts. For example, the session started.
[04:13] Here, we're going to put it a little further back. It's important to know that this will all be on the 5-minute timeframe. The good thing about this strategy is that it only involves one timeframe, and with that timeframe, you'll
[04:25] find everything. Once the 7 o'clock session starts—here it is, 7 o'clock—we're moving the last opposing candle before the strong move because that candle is the order block. That's the last opposing candle before a strong move;
[04:38] that's a possible high. I mean, this strategy has a 50% probability because this way of finding an order block is very basic and tends to fail sometimes. But if we manage to find a point of balance with this
[04:51] find good entries. And this is a somewhat basic way of finding an order block. There are better ways, but if we do it this way, with a 50 find it without any problem. That's the last opposing candle. For example, here,
[05:06] before the strong move, what we're going to do once we identify that last opposing candlestick is use the Fibonacci tool is use the Fibonacci tool from the last high to the last low
[05:18] and wait for a 50% retracement. As soon as we find that 50% retracement, we don't have to wait until it reaches the order block. So, once we identify the classic order block, we're going to place the
[05:32] trade as a sell order. It would be a cell limit. You can use a cell limit without any problem. The cell limit would be at the 50% Fibonacci retracement level. The stop loss would be two pips above the order block because we'll use the order block
[05:47] to place the stop loss, not to wait for the entry. That is, in this case, the the entry. That is, in this case, the order block is at 2.5 pips, so we place order block is at 2.5 pips, so we place
[06:00] above the last order block. And the take profit for the trade will be 1: trade to be a 1:2 trade. Whenever we take the you can use a sell limit without any problem. Here at the 50% mark, once you set the
[06:15] Here at the 50% mark, once you set the limit, the Take Profit is one to two pips, and the Stop Loss is two pips above the last order plot. Once you set the limit, we'll wait. Here, for example, it was activated at 7:45,
[06:29] and once we see the trade developing and distributing, it already reached the Take Profit before the session ended. It doesn't matter if the trade is valid. Notice that the strategy will
[06:43] only consist of three or four steps approximately. We'll set the time limit. We'll try to find the high of the session, that is, of that New York session, when the first order block is created. Once
[06:55] that first order block is created, we place our Fibonacci tool, and at the 50% mark, we'll place a trade depending on the direction. In this case, since the possible high was created, which would be this, we'll place a sell trade at the
[07:08] we'll place a sell trade at the 50% mark, and the Stop Loss would be two pips above the last high. We're going to test if this concept works on previous days to see if it really works. Well, some days, or most days, it
[07:21] presents us with this creation of this high or this low. And in what different ways does it present itself? But basically, it consists of this: if we manage to identify this, the 5- minute timeframe is where it's clearest.
[07:34] I had identified it in 15 minutes, but sometimes it's not as clear as in 5 minutes. In 5 minutes, you see more structure, and since the time frame is short—only 4 hours—if they were 15-minute candles, there would
[07:47] only be approximately 16 candles. And with 16 candles, you can't read the order blocks well. Let's go to previous days to see if we can identify again how this works. And it would be literally the same way each day.
[08:03] We're going to wait for the session to start and see which direction it's the session starts, notice that it always moves in a direct direction. If this is the direct direction that occurs, it will possibly create the
[08:16] low of the day. And if it creates the low of the day, we're now going to wait for a classic block word in that low of the day that indicates that... There's a possibility of a reversal. Let's wait for the classic block order. Here we can see it.
[08:31] We found the last opposing candle before the strong move. This would be the classic block order, which possibly indicates that this is the low of this New York session. Once we find this classic block order,
[08:44] we use our Fibonacci tool. We place our entry from point A to point B. As I mentioned, our entry will always be at the 50% level, and my stop loss will be two pips below that order. So, what we
[09:00] found was 3.6, making the stop loss 5.6 pips, and we would have a one-to-two entry. That's what we 're looking for. We would place 're looking for. We would place a limit trade at that 50% level because we're
[09:14] waiting for price action or a candlestick pattern. The only thing we have to do is, once it reaches that specific point, we're going to arrived. It's slightly negative for
[09:28] place the stop loss two pips below the order block, because it gives it room to breathe. If we placed it too far back... It was tiny, or I often missed it during testing. So, once we found it, we see that it seems
[09:41] some economic event occurred here, but it pushed the price towards our Take Profit point. Once you reach the one-to- two, you literally exit the trade. You have to set the Take Profit to automatic, triggering at this
[09:55] point, the Stop Loss to automatic, and the By-Limit to automatic. Once the trade opens, you don't have to do anything at all because this strategy doesn't involve partial closings; it doesn't involve anything other than
[10:08] Stop Loss to breakeven when it's at one-to- one. But that's all; it's very simple. You wait for 7 AM, you wait for the low of the day to be created, for example. This is n't an order block; it's not valid for creating an order block. There's no
[10:23] strong movement, and since there isn't, we do n't consider it. Here, we do consider this a strong movement because for something to be strong, we have to compare it to something else. There has to be something weaker, and if we compare
[10:36] this movement, which is the previous one, with this movement, which is the strong movement, and there is a certain creation. From the lord block, which is basically what we're waiting for, once we get to this point,
[10:49] 50% discount, our byy limit, our stop L 2p below the order block, and our take profit 1 to 2, and literally that's the strategy. But let's keep testing on previous days to see. Here I wanted to put
[11:02] this with an x to say that we got confused, that in the end we didn't think this was the order block and we took a sell trade here and it didn't give us a one-to-two trade. If we measure it, notice that it wouldn't
[11:16] give us a one-to-two trade. Let's put the Fibonacci here, which would be after the creation of the order block. If we put it here, our stop L would be
[11:28] two pips above, which would be 6.6, and our one-to-two trade would be around here. So let's say it wasn't one-to- two, it was a little bit positive and we lost the trade that day. We didn't have a good probability with that trade. Perfect.
[11:41] So what do we do? Let's move on to other days to keep analyzing. What if we see the exact same scenario on this day? Let's analyze it more closely with the replay tool so you can Watch it: the
[11:56] New York session starts at 7 AM, the price starts to move, and notice how we use our Fibonacci tool, High to Low, and at the 50% level,
[12:09] we would take a limit position. Once here, we find the Stop Loss, literally two pips above the last order block, and we place our
[12:21] Take Profit at one or two pips. The trade opens in the New York session, which would be between 7 AM and 11 AM. This is the time frame; it means the time period in which you are allowed to take entries. If it's
[12:33] before, you can't take it; if it's after, you ca n't take it. But it doesn't mean that as close the trade. It's not just the time frame in which you can take entries. And now notice that once the trade opens, we go directly to the
[12:46] Take Profit at one or two pips. Sometimes this might not even be the session's high, but we just identify it and let it work as the temporarily, until the session opens because it might create another
[12:59] higher point. That's why we don't care once we... Let's determine that this is the possible High, find a one-to-two trade, and have all the parameters to take this trade. With that, it's more than enough for us to
[13:11] take the trade and get a profit entry. Now, let's study another day to see if we can also find a possible entry, since this pattern repeats itself literally too much. So, we observe, we see here.
[13:26] We're going to use the same tool to study it better, and we see here. This is not an order block. This is not the last opposite candle. Strong movement. There's still nothing to tell us that this is a nice order block because this
[13:38] movement is stronger than this one, so we're going to keep waiting. Now we observe, for example, down here, that there is an order block being created. This movement is much stronger than this movement. So, now we
[13:51] have something to measure with. We put our Fibonacci tool right our Fibonacci tool right at that point, last low, last high, and wait for the 50% discount to place our entry. And literally,
[14:05] look how fast it happened! We would have placed our entry here: 50% stop, 9 pips, because there are 7 pips between the entry point and the order block point, and our one-to-two take profit. We find another very... Okay, we don't
[14:21] know if this will be the low of the session, we don't know, but we don't need to know 100%. Once we find it and it gives us the brief indications, we simply have to follow the strategy. So, step one:
[14:35] We wait for 7 AM. Step two: We wait for a new order block to be created that indicates that it might be the high or low of the session at that point. Step three: Once the order block is created and shows some
[14:48] movement, we wait for a 50% discount. Then, in step four, we place a limit trade at that 50% discount with a take profit that is always 1:2 in terms of risk/ reward and a stop loss that is two
[15:02] pips below or above that order block we found. And literally, that's how you have the strategy. But now comes a explain at the end. With this strategy, sometimes you'll have a 60%
[15:15] probability, sometimes 70%, it all depends on the month. Your win rate will vary depending on the month, for example, if you analyze it in July, or in April, or in January. It will vary, but the average win rate over the last 6
[15:27] months of testing with this strategy was around 53%. So that's not bad at all. And if you can have a 1:2 risk-reward ratio, hitting 1:2 risk-reward ratio, hitting 5-3% of the time, basically, if you lose
[15:41] 10 trades, you'd lose 10%, but if you win 10 trades, since they're one or two-way trades, you'd gain 20%, leaving you with a 10% profit margin. Even though you're losing almost as much as you're winning, the only difference is that
[15:57] when you win, obviously, due to the profit margin, you 're winning more. So what does to make it perfect and allow you to implement it long-term? It lacks rules. Because a strategy without a set of rules, at
[16:10] complete strategy. So I'm going to give you a few rules that I implemented with this strategy that help me keep it profitable. Rule number one is one trade per day. You're not going to take more than one trade per
[16:24] day, and whether that trade is a winner or a loser, the result doesn't matter. No, you're not going to take more than one trade per day. If you win the trade, you leave and trade, you leave and come back the next day. This is an unbreakable rule, and I'm giving you
[16:39] current trading plan. Second, you're only going to risk 1% per trade. You're not going to risk more, you're not going to risk less. It doesn't matter if you're using funding accounts; 1% per trade is what I recommend with
[16:54] this strategy. You can use 0.5%, but honestly, I consider 1% to be excellent. It's not too much, nor is it too little, and it's sustainable in the long run to risk that 1%. Third, if you want, and especially if you have
[17:09] real capital, you can trade news with this strategy. It's not a limit to trading news because many times trades move in the direction of the news. If you trade news because funding companies don't allow it. But
[17:23] if it's your own capital and it's real capital, you can use it without any problem. The fourth piece of advice I'm going to give you, or the fourth rule, is that we don't take trades on holidays. I'm talking about... Holidays for the dollar and the euro/
[17:37] dollar, since I've tested this strategy on the euro/dollar pair, any other market. work in multiple markets simultaneously, so don't stress about whether it
[17:51] will literally work in any market where you implement it, even crypto. And finally, the last rule I'm going to give you is: don't take
[18:03] going to give you is: don't take trades outside of these hours. If you the limits and parameters I've set for this strategy. This strategy is very good and is literally the only one you need
[18:16] other part of profitability will depend on you and your decisions. Making good decisions leads to good results, but with this strategy, the New York session. Once
[18:29] realize how easy it is. You'll follow each of the rules and adapt them to these hours. And if you follow each of the steps in this strategy, I promise you it will be the only one you'll need. To be
[18:42] a strategy. A strategy will help you a lot because you'll be there's another part of profitability that depends on you: your decision-making, your personal management. When you're trading, that other part can't help you
[18:58] right mindset, as I've done in many videos and will continue to do. But with this strategy, you'll be able to see results without overcomplicating things. There are many profitable strategies; what's not profitable are the traders.
[19:11] simple strategy like this one, it will be much easier for you to have to add, see you in the next video, and I invite you to our other channel where we're interviewing students who, with their knowledge... Many people
[19:25] have withdrawn a lot of money from this channel. For example, some have withdrawn seven-figure sums— the knowledge gained from this YouTube channel. This channel is run by students of the sensei, and we invite you to subscribe and watch these interviews so you can
[19:38] are making money with that same knowledge. That's all for now;
⚡ Saved you 0h 19m reading this? Transcribe any YouTube video for free — no signup needed.