

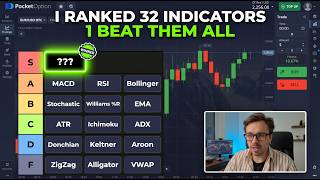
Is This Strategy Really 90% Profitable?
44sChallenges the claim of 90%+ profit, sparking curiosity and skepticism.
▶ Play Clip"The title promises a secret strategy winning 10/10, but the video shows only 4 winning trades, not 10, and the strategy is not new."
This video demonstrates a trading strategy using Williams and Keltner Channel indicators on a 1-minute timeframe on Pocket Option. The presenter claims to achieve over 90% profit on trades and walks through four example trades, each showing a sell setup with three confirmations: price breaking above the Keltner Channel and returning, Williams entering overbought zone (above -20) and reversing down, and a bearish candlestick pattern. The strategy yields profits of $960, $1,920, $2,880, and $3,840 on trades of $500, $1,000, $1,500, and $2,000 respectively.
The strategy uses Williams and Keltner Channel indicators on a 1-minute timeframe. The presenter claims traders find it super effective and has tested it himself.
Candlestick chart, 1-minute timeframe. Keltner Channel configured for sensitivity to impulses and breakouts. Williams indicator set to period 7.
Sell $500, duration 3 minutes. Candle broke above upper Keltner boundary and closed back inside (overbought). Williams rose above -20 then turned down crossing below -20 (buyers losing steam). Bearish engulfing pattern appears.
Trade closed with $960 profit (92% profit).
Sell $1,000. Williams overbought above -20 then turned down crossing below -20. Price broke above upper Keltner boundary and next candle opened lower. Three confirmations: price returned inside channel, Williams reversal, bearish candle.
Trade closed with $1,920 profit (92% profit).
Sell $1,500. Price broke above upper Keltner boundary and next candle reversed down re-entering channel. Williams rose above -20 then reversed down crossing -20. Series of red candles confirms drop.
Trade closed with $2,880 profit.
Sell $2,000. Price above Keltner channel (overheated). Williams in overbought zone above -20 reverses down and crosses -20. All chart elements aligned.
Trade closed with $3,840 profit.
The presenter claims the strategy works well and encourages viewers to join his Telegram channel for more strategies and insights. He emphasizes that he tested the strategy thoroughly before presenting it.
What two indicators are used in the strategy?
Williams and Keltner Channel.
00:34
What timeframe is used for the strategy?
1 minute.
00:34
What is the Williams period setting?
7.
01:14
What does Williams value above -20 indicate?
Overbought market.
02:09
What does a candle breaking above the upper Keltner boundary and closing back inside signal?
Price is overbought and a correction downward may follow.
01:54
What is the third confirmation signal mentioned?
A bearish candlestick pattern (e.g., bearish engulfing).
02:35
What profit percentage did the first trade achieve?
92%.
03:02
What was the total profit from all four trades?
$9,600 ($960 + $1,920 + $2,880 + $3,840).
06:17
Strategy Core
Defines the two indicators and timeframe used throughout the video.
00:34Overbought Signal
Explains the key signal of price breaking above Keltner Channel and returning.
01:54Williams Overbought Confirmation
Describes how Williams indicator confirms overbought conditions.
02:09First Trade Profit
Demonstrates a 92% profit on a $500 trade.
03:02Final Trade Profit
Shows a $3,840 profit on a $2,000 trade, totaling $9,600.
06:17[00:06] trading channels. Traders are claiming it's super effective, but is that really true? I don't take anyone's word for it. I always test things myself. I've done a lot of research on this strategy. And now I'm ready to show it to you. Just so
[00:19] you understand, for me, the ideal result is trades with 90 plus% profit. [music] And now you'll see the entire process from setting up the tools to executing the trades with all those exact settings. I'll be using a strategy based
[00:34] on two indicators, Williams and Kelner on a one minute time frame. If you have a desire to grow in trading, but you lack structure, direction, or just support, check out my Telegram channel. There you'll find a clear format,
[00:47] [music] daily breakdowns, and tones of new strategies. If growing with the link in the video description. telegram channel. All right, so let's set up the chart. Chart type candlestick
[01:01] time frame 1 minute. Let's configure the cotner channel first. These settings make the cotner channel more sensitive [music] to impulses and breakouts. Perfect for trendbased trading. I'll adjust the visual style, remove
[01:14] unnecessary lines, and make the colors more saturated, easier to work with. Now I'll configure the second indicator, Williams. Setting the period to seven. Indicators Williams and Kelner. Together they filter out false signals and help
[01:28] find reliable [music] entry and exit points. Curated better visibility. Uh clear picture. Now comes the most important part, the trades. Okay, I'm
[01:40] important part, the trades. Okay, I'm opening a trade as I like it. Sell $500. Trade duration 3 minutes. Let's break it down. Conner channel is a band-based indicator showing the normal price range. At this moment, the candle broke
[01:54] [music] above uh the upper boundary and then closed back inside. This signals that price is overbought [music] and a correction downward may follow. The Williams indicator shows how overbought or oversold the market is. A
[02:09] value above minus20 [music] indicates an overbought market. You can see on the chart that the Williams [music] line rose above minus20 then sharply turned rose above minus20 then sharply turned downward crossing back below minus20.
[02:22] That's a signal that buyers are losing steam and the market is beginning to reverse downward. Price rarely stays beyond the coder boundaries for long. If the candle breaks out and returns, it's often a reversal [music] signal. And on
[02:35] top of that, after a strong uptrend, a large red candle appears which closes below the previous green one. This is called a bearish engulfing [music] pattern. So here we've got three uh clear signals for a downward move. Price
[02:49] broke below Kelner channel then re-entered. Overbought warning. Williams dropped below minus 20 reversal confirmation. A strong bearish candle. Start of correction. That's a high probability entry. Let's wait for the
[03:02] trade to close. $960 plus. Beautiful. No time to waste. Let's keep going. Next trade, also a sell for $1,000. On the chart, the Williams indicator has entered the overbought zone above minus 20, then turned down
[03:17] and crossed below minus20. A direct signal to sell. This shows that buyers are fading and a correction is likely. The price candle broke above the upper boundary of the Kelner channel and the next candle opened lower and started
[03:31] [music] falling. That tells us the price rose too high and a pullback is very likely. The market is overbought [music] again. Price exits the channel and returns often leads to a reversal. So here are the signals again. Price jumped
[03:44] above the Kelner channel then returned reversal [music] trigger. Williams turned downward from overbought. The candle shows a clear downward reversal. This trade is wellreasoned and strong, and I think it's inevitable that it
[03:57] should yield profit. And waiting for the result, $1,920. Just [music] excellent. Notice 92% profit on this one. That's an amazing result. In my telegram, I share my latest strategies and insights before
[04:12] and after each trade. It's not just about results. It's the [music] whole process from the idea to the post-trade analyzes. It's the side of trading. Few people show the real practical process with all the thoughts, doubts, and
[04:26] conclusions. So, [music] if you want to see trading not as a picture, but as a real job, I'll be waiting for you in my Telegram channel. So, let's keep going. I'll slowly build it up. Looking at the chart, I see a solid opportunity.
[04:39] $1,500. Watch closely. Cotner channel shows price broke above the yellow upper boundary and the next candle sharply reversed down re-entering the channel. That's a clear overbought signal likely
[04:54] followed by a downward correction. Williams line rose the zone above minus20 overbought again. Then it reversed downward crossing minus [music] 20 from above. This confirms buyers are exhausted and now is a good time to
[05:08] sell. A series of red candles confirms the ongoing drop. So once again, three confirmations. Price back inside the corder range. Williams dropping below candles uh confirming the decline. It's a strong sell setup. Waiting for the
[05:23] a strong sell setup. Waiting for the trade closure. $2,880. pretty sure you would agree. Honestly, even I didn't expect the strategy to work this well and that's exactly why I had [music] to show you. So, let's wrap
[05:36] up one final trade. I'm opening a sale for $2,000 expecting a very good profit. above the Kelner channel. That's already a signal of an overheated market. This
[05:48] often ends in a pullback, especially when a reversal candle forms. Then overbought condition is confirmed by price position above the channel. Williams line is also in the overbought zone above minus 20 that reverses down
[06:02] and crosses minus 20, a key signal. This indicates buyers are losing strength and a reversal is likely. All chart elements are aligned. Uh, my sell trade is justified and has a high chance of success. Everything is clearly visible.
[06:17] You see it too, right? Now, let's wait for the final trade to close. $3,840. Excellent. Well, no wonder people are shouting about this strategy. As you saw, it actually worked pretty well for me. But before showing it to you, I
[06:32] understood it completely. I tested it. I studied it. And only then I presented it to you. If you got any questions, drop them in the comments and I'll personally reply to you for sure. Or even better, follow the link in the description of
[06:45] this video to join our Telegram channel. I'll add you to our channel where I break down strategies like this one on a daily basis, as well as I share my logic and give practical insights. I hope to see you there. This was Ronnie. Happy
[06:58] see you there. This was Ronnie. Happy trading.



⚡ Saved you 0h 06m reading this? Transcribe any YouTube video for free — no signup needed.