
Trade Less, Win More: Precision Strategy
45sPromises a high-probability trading strategy that avoids overtrading, appealing to traders seeking efficiency.
▶ Play Clip"The title promises a precise strategy, and the video delivers, but the heavy promotion of a Telegram group and the lack of in-depth explanation of the 'core logic' dilute the value."
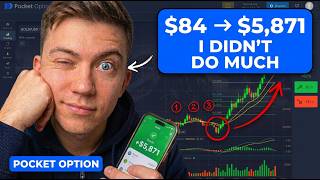
This video presents a trading strategy designed for precision over frequency, using a 30-second chart with momentum and fractal indicators. The host demonstrates the setup through several live trades, emphasizing waiting for the right market conditions and confirming signals before entering. The session concludes with a significant balance increase from $84 to $5,871.
The strategy is for traders who prefer fewer, more precise trades. It waits for specific market conditions rather than reacting to every move, clearly showing when probability is on the trader's side.
Use classic candles on a 30-second timeframe. Add the momentum and fractal indicators. Configure fractal to show up arrows in red and down arrows in green.
Set momentum period to 6. Style the main line as a line with width 2, adjust opacity, and set outline triggers. Save the settings.
A green arrow under candles signals a potential upward shift. It indicates fading pressure from the top and the end of fresh lows, often appearing near trend reversals.
When the turquoise line crosses above the thin gray line, it confirms the impulse is shifting upward. This indicates buyers are stepping in and the move is becoming more directional.
After an upward acceleration, a sell trade is opened. The breakout from consolidation rotates lower, with expanding range and red candles closing lower, indicating a structural transition to a downside phase.
A sharp acceleration leads to a buy trade. Strong momentum, extended bullish candles, and shallow pullbacks confirm aggressive buyer support. Higher highs and constant upward pressure suggest continuation.
The final buy trade locks in another $1,840 profit. The session balance grows from $84 to $5,871, demonstrating the strategy's effectiveness.
The strategy relies on combining fractal signals with momentum confirmation to identify high-probability trades. The session's results show a substantial profit, but the approach emphasizes patience and precision over frequent trading.
What timeframe is used for this trading strategy?
30 seconds
00:30
What are the two indicators used in this strategy?
Momentum and fractal
00:30
What does a green fractal arrow under candles indicate?
A potential upward shift in market direction, with fading pressure from the top and no fresh lows.
02:08
What does the momentum line crossing above the gray line confirm?
The impulse is shifting upward, buyers are stepping in, and the move becomes more directional.
02:34
What is the momentum period setting used in this strategy?
6
01:15
What color is the up arrow on the fractal indicator set to?
Red
00:59
What was the final balance after the trading session?
$5,871
07:41
What does a sell setup look like according to the strategy?
A breakout from consolidation that rotates lower, with expanding range and red candles closing lower, indicating a structural transition to a downside phase.
03:14
Precision over frequency
Sets the core philosophy of the strategy: trade less but be more precise, waiting for the right conditions.
Fractal as first signal
Explains the first signal of a potential reversal, a green arrow under candles, which is a key entry trigger.
02:08Momentum confirmation
Describes the confirmation step where the momentum line crossing above the gray line validates the fractal signal.
02:34Structural transition to downside
Illustrates how a sell setup is identified through a breakout that rotates lower, showing a clear structural shift.
03:14Session results
Demonstrates the strategy's effectiveness with a balance growth from $84 to $5,871.
07:41[00:00] Hey guys, Steven here. If you're the kind of trader who'd rather trade less but be more precise, you'll want to watch this one. Today I'm walking you through a setup that doesn't react to every
[00:18] real move, it waits for the right market condition. It shows you very clearly when probability is on your side and when the best move is just to sit back and wait.
[00:30] We'll break it down step by step the settings, the signals and the core logic behind the strategy. If you get value from this I'd appreciate it you subscribe to
[00:42] the channel and like this video. Let's get down to trading. First thing let's get the workspace ready. I'm using classic candle 6. Time frame is 30 seconds. Then go to the indicators tab and add momentum and fractal. We'll set up fractal first.
[00:59] Go to style and change the up color to red and the down color to green. Then click save it. Now let's set up momentum. Set the period to 6. Then go to style. For the main line set the shape type to line.
[01:15] Width 2 and move opacity to the right. Make the outline triggers and then click save. Alright indicators are ready to go. If you trade from your phone just set up everything the same way.
[01:30] And if you want ready to use market guidance and you want to trade alongside me check out the telegram group. I post daily market analysis there and there's also cover trading available as well.
[01:44] Entry is completely free but spots are limited. a message if you want in. Alright, first entry here forms on a fading impulse, expression 1 minute and I opening a buy trade for Now let walk through the logic calmly so this structure is crystal clear to you First thing I watching is the fractal
[02:08] When a green arrow appears under the candles, that's the first signal the market may be shifting direction. Pressure from the top starts fading, price stops printing fresh lows and we start getting
[02:21] the probability of an upside move. You often see the signal right around areas where a trend begins to reverse. Next step, confirmation through momentum.
[02:34] When the turquoise line crosses the thin gray line from below to above, that tells me the impulse is slipping. Buyers are starting to step in, momentum shifts upward, and the move becomes more directional
[02:48] and controlled. Guys, that trade closes out, marking in $77 in profit.
[03:01] Let's move on to the next setup. Next situation develops after an upward acceleration. Expiration 1 minute and I'm opening a sell trade for $161.
[03:14] It breaks out of a short consolidation and almost immediately starts rotating lower. The range expands, candles turn red and they keep closing lower without hesitation.
[03:26] This doesn't look like a random spike, it looks like a structural transition into a downside phase. The decline develops steadily, pullbacks stay shallow, the structure remains intact and
[03:40] you can feel consistent seller pressure building through the move. The market isn't showing any urgency to reverse back up. At this point, the indicators line up with the price action.
[03:54] Both confirm the bearish direction re the bolder picture With that kind of structure continuation to the downside is the logical expectation
[04:17] We're getting a pullback here and I'm locking in $148 in profit and moving forward.
[04:47] Now the market shows a sharp acceleration, expiration 1 minute and I'm opening a buy
[05:14] trade for $3000. Breakthrough the nearby levels with strong momentum and immediately picks up speed. We are getting extended bullish candles.
[05:26] The move looks aggressive and confident. No hesitation. No deep pullbacks. The impulse is developing almost continuously. Buyers are clearly supporting the move.
[05:38] Any small pullbacks get absorbed quickly. The structure stays clean. Higher high. printing and upward pressure remains constant through the move. With momentum
[05:51] like this the bullish scenario looks stable and if the impulse holds there is every reason to expect continuation of the blower uptrend Friends if you finished watching the video and you still have questions feel free to message me on telegram I will gladly help you
[06:20] And there it is, trade results exactly as expected, locking in $1,840 in brokerage and preparing for the final entry and the final part of the session now timer one
[06:35] minute and I'm opening a buy trade for $2,000 price continues to climb steadily forming a structured move higher without any chaotic swings each candle settles
[06:48] above the previous one the structure stays clean and readable pullbacks are short and controlled ending quickly without disrupting the overall direction That tells me the bio pressure remains stable and there is no meaningful resistance showing
[07:05] up in the area. Momentum still looks clear and confident, no signs of slowing down. Under these conditions, continuation of the uptrend remains the most logical scenario.
[07:28] And the finale plays out perfectly, locking in another $1,840 in profit. Balance now sits at $5,871.
[07:41] It's time to wrap this session up. My balance grew from $84 all the way to $5,871. That's a strong result. If you have questions about the strategy itself or you want to dig deeper into how it works,
[07:57] Just reach out to me on Telegram and I'll gladly help you out. Thanks a lot for watching, for liking the video and subscribing to the channel. See you in the next one and trade smart.




⚡ Saved you 0h 08m reading this? Transcribe any YouTube video for free — no signup needed.