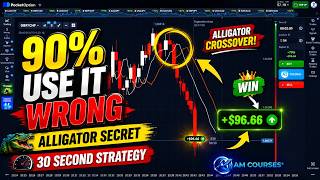

Why 90% of Traders Fail with Alligator Indicator
45sThe bold claim that 90% of traders use the Alligator indicator wrong, combined with a promise of a unique fix, immediately grabs attention and creates curiosity.
▶ Play Clip"Delivers on the core promise of a modified Alligator strategy with clear rules, but the '90% of traders' claim is unverifiable and the video includes a lengthy live demo and a self-promotional PDF pitch."
This video presents a modified Alligator indicator strategy for 30-second charts on MT4 and Pocket Option, claiming that default settings are ineffective for such short timeframes. The creator recalibrates the indicator to create a real-time equilibrium band and provides specific entry, confirmation, and risk-avoidance rules, along with a live chart demonstration and a candid example of a losing trade to illustrate the importance of market context.
The default Alligator settings (13, 8, 5) are designed for daily/hourly charts and are useless on 30-second charts, causing signals to lag so much that trades are over before they appear.
Change the settings to Jaws=5, Teeth=3, Lips=2. Hide the Jaws line completely; only watch the Teeth (red) and Lips (white) lines, which form a live equilibrium band.
Buy when the Lips (white) crosses above the Teeth (red) and moves upward. The candle must be completely above both lines, and you need one or two green confirmation candles to close above the lines. Trade expiry is 2 minutes.
Sell when the Teeth (red) crosses above the Lips (white) and moves upward. The candle must be completely below both lines, and you need one or two red confirmation candles to close below. Trade expiry is 2 minutes.
Before the reversal candle, there must be at least three consecutive fast candles moving entirely away from the lines. This confirms a real overextension, not random noise.
At the moment of the signal, the two lines must be staying close to each other. This indicates the structural average price hasn't shifted, making reversals more reliable.
If the two lines fan out wide like scissors, do not trade. This indicates a strong trend expansion, which works against the reversion-based strategy. Skip and wait for compression.
Avoid highly volatile OTC markets with thin erratic candles. Signals look identical but follow-through doesn't happen. Stick to stable pairs during normal market hours.
The creator shows a losing buy trade where he ignored a prior resistance level that had rejected price twice. The strategy gave a valid signal, but the trade failed because he didn't check the broader context. Lesson: 'A signal at the wrong location is still a wrong trade.'
The Asymmetric Alligator Scalp strategy requires recalibrated settings and strict confirmation rules, but its success also depends on respecting market context, such as key resistance levels. The video emphasizes that indicators provide signals, but the chart provides the context needed for profitable trades.
What are the default Alligator indicator settings and why are they problematic for 30-second charts?
Default settings are 13, 8, 5. They are built for daily/hourly charts and lag too much on 30-second charts, making signals appear after the trade is over.
01:23
What are the recalibrated settings for the Asymmetric Alligator Scalp?
Jaws=5, Teeth=3, Lips=2.
01:23
What is the buy entry rule for the Asymmetric Alligator Scalp?
Lips (white) crosses above Teeth (red) and moves upward, candle is completely above both lines, and one or two green confirmation candles close above the lines. Trade expiry is 2 minutes.
01:49
What is the sell entry rule for the Asymmetric Alligator Scalp?
Teeth (red) crosses above Lips (white) and moves upward, candle is completely below both lines, and one or two red confirmation candles close below. Trade expiry is 2 minutes.
02:31
What is the first filter rule for a valid signal?
Before the reversal candle, there must be at least three consecutive fast candles moving entirely away from the lines, indicating a real overextension.
03:00
What does it mean when the two lines are close together at the signal moment?
It means the structural average price hasn't shifted yet, so the market is still in balance, making reversals more reliable.
03:27
What is the 'scissor pattern' and why should you avoid trading it?
When the two lines fan out wide like scissors, it indicates a strong trend expansion. The strategy is based on reversion, so a running trend works against it.
03:41
Why should you avoid OTC markets with thin erratic candles?
OTC pairs sometimes have random spikes with no real structure, so signals look identical but follow-through doesn't happen.
04:11
What is the key lesson from the losing trade example?
Always look left on the chart to check for prior support/resistance levels. A signal at the wrong location is still a wrong trade.
09:02
Recalibrating the Alligator for 30-second charts
This is the core innovation of the strategy, showing how to adapt a classic indicator to a much shorter timeframe.
01:23The scissor pattern warning
Provides a clear visual cue to avoid trading during strong trends, which is a practical risk-management rule.
03:41The importance of market context
Demonstrates that even a valid signal can fail if you ignore key support/resistance levels, a crucial lesson for traders.
09:02Avoiding OTC markets
Highlights a common pitfall in binary options trading and offers a simple filter to improve signal quality.
04:11[00:01] popular indicators on MT4 and Pocket Option is being used completely wrong by 90% of traders? The Alligator indicator. Most traders just open it, leave the default settings, and wonder why it never works. And on a 30-second chart,
[00:15] those default settings are basically useless. They lag so badly that by the time the signal appears, the trade is already over. But today, I'm going to show you something different. I call it the Asymmetric Alligator Scalp, and what
[00:28] makes it special is one simple change. We completely recalibrate the settings to make it react in real time on a 30-second chart. In this video, I'll show you exactly how to set it up in under 2 minutes, the exact buy and sell
[00:40] rules with zero guessing, two rules that filter out bad signals before they cost you, and two rules that keep you away from dangerous setups altogether. Stay with me till the end because those two rules to avoid losses are the ones
[00:54] alone can completely change how you trade. Before we start, trading binary options involves real financial risk, and you can lose money. Nothing in this video is financial advice. Always practice on a demo account first before
[01:09] using real money. All right, let's get into it. First, open your Alligator indicator. Now, here's where we make the change. The default settings are 13, 8, and 5. Those were built for daily and hourly charts. We're on a 30-second
[01:23] chart, so we need to compress the math aggressively. Change jaws to 5, teeth to 3, and lips to 2. Now, this next part is important. Hide the jaws line completely. We don't need it. It only adds clutter to the chart. From this
[01:36] point on, we're only watching two lines, the teeth and the lips. These two lines now work like a live equilibrium band, a zone that shows where price is mathematically balanced at any given moment. And when price deviates fast
[01:49] away from that zone, that's exactly our trading window. Now, let's talk entries. Buy setup first. Here's what you're looking for. The lips, that's the white line, crosses over the teeth, which is the red line, and moves upward. But that
[02:04] crossover alone is not enough. The candle must be completely above both lines, not touching them, not halfway, completely above. And before you pull the trigger, wait for one or two green confirmation candles to close above the
[02:17] confirmation candles to close above the lines. Why the confirmation? Because we want the market to prove itself first. We're not guessing. We're confirming. So lips crossover teeth moving up, two green candles close cleanly above both
[02:31] lines. That's your entry. Trade expiry is 2 minutes. The sell setup is the mirror image. Now the teeth, red line, crosses over the lips and moves upward. Candle must be completely below both lines. And
[02:46] again, you wait for one or two red confirmation candles to close below. Same logic. Let the market confirm, then enter. Teeth crossover lips, two red candles close below both lines, entry taken, 2-minute expiry. Now here are the
[03:00] two rules that separate clean high-quality signals from average ones. Rule one, before the reversal candle appears, there must be at least three consecutive fast candles moving entirely away from the lines. This tells you
[03:13] there was a real overextension, not just random noise. The market moved too far, too fast, and now it's snapping back. That's the move we want. Rule two, at the moment of the signal, the two lines must be staying close to each other.
[03:27] When the lines are tight and close, it means the structural average price hasn't shifted yet. The market is still in balance. That's where reversals are most reliable. And now the two rules to avoid losses. Please pay close attention
[03:41] Rule one, if the two lines start to fan out wide, like a pair of scissors opening up, do not trade. That scissor pattern means a strong trend expansion is already happening. This strategy is built on reversion and equilibrium, so a
[03:55] running trend will work directly against it. Skip the trade, step back, and wait for the lines to compress again. Rule two, avoid highly volatile OTC markets with thin erratic candles. OTC pairs sometimes have candles that spike
[04:11] randomly with no real structure behind them. The signals look identical, but the follow-through simply doesn't happen. Stick to stable pairs during normal market hours. That's where this strategy actually performs.
[04:24] Now, I've put together a free PDF guide for this strategy that you can download right now from the link in the description. It covers everything we just went through, plus a simple one-page entry checklist you can keep
[04:36] right on your screen while you trade, so you never miss a rule in the heat of the moment. Go grab it quickly, and then come right back because next I'm going to show you this exact setup triggering live on a real chart candle by candle in
[04:49] real time. Look at the chart here. Price has been climbing steadily, pushing higher and higher, and it reached a clear peak right at this level. You can see that high point marked on the chart. But, here's what I was watching closely.
[05:02] That climb was fast, it was aggressive, and the moment it stopped, something very specific happened on the two indicator lines. The red line, the teeth, crossed over the white lips line, and both of them
[05:14] started turning downward. This was the first signal, but I didn't enter immediately. I waited. I watched the candles, and right there, two red candles closed completely below both lines. Not touching them, not partly
[05:26] below, completely below. That's the confirmation I needed. Also, notice something important. At this moment, the two lines are still haven't spread wide. That closeness tells us the market hasn't shifted into
[05:39] a full trend yet. It's still in that equilibrium zone. This is exactly the condition the strategy needs. So, the sell entry was placed. Now, here's where it gets interesting. Watch what price does after entry. Those two lines that
[05:52] were close together at entry, they start moving downward together, almost like they locked arms and decided to fall in sync, and price follows them. Not just a candle or two, a whole series of strong red candles dropping one after another,
[06:05] each one closing lower than the last. This is the overextension snapback happening in real time. Remember what we covered earlier? When price moves too far, too fast away from the equilibrium band, it snaps back hard. That's exactly
[06:18] what you're watching here. The market overshot upward, the lines detected it, and now price is correcting back with real momentum. At this stage, the trade direction. Both lines are pointing down, candles are clean and red, and there's
[06:32] no sign of the market reversing back up. This is what a clean sell setup looks like when it's working. No chasing, no panic, just the strategy doing exactly what it was designed to do. And now, the final moment. Look at where
[06:46] price ended up. From that entry point all the way down, a clean uninterrupted move lower. When the trade closed, you can see the green profit notification appear right there on the chart at the closing candle. That small green badge
[06:59] tells the whole story. Look at the left side of the chart. Price didn't just go up, it went up almost in a straight line. A massive, near vertical rally, one white candle after another, pushing higher and higher without stopping. And
[07:14] fast, there is only one thing the asymmetric alligator is waiting to asymmetric alligator is waiting to detect, the moment the energy runs out. And right at that peak, it happened. The white lips line curved over and crossed
[07:27] below the red teeth line. Both lines began turning downward from the very top, and crucially, they were still sitting tight and close together right at that moment. That's the key condition. The lines hadn't spread wide.
[07:40] broken yet. This was a clean reversal signal, not a trending one. Two red candles closed completely below both lines. That was the confirmation. Sell entry placed. Now, here is where the chart starts
[07:55] the bulls were hoping for. That same steep climb that looked so powerful just moments ago, it's now turning into a rounded hill. Both indicator lines, which were pointing sharply upward, have curved
[08:08] together. They're moving in sync, almost like they formed a bridge at the peak and are now walking down the other side together. And price is following them. The candles that were closing above the lines during
[08:21] the rally are now closing below them. Each new candle is printing lower than the last. The momentum has completely flipped. And the chart is showing you this in real time, not after the fact. And then the chart delivers its final
[08:35] Right where the closing candle lands, a green notification badge appears on the chart itself, marking the exact closing point. From that vertical peak all the way down to where this trade closed, the market moved cleanly and consistently in
[08:49] the sell direction without a single serious reversal attempt. Bottom left of the screen, trade closed confirmed green. All right. This next part of the video I almost didn't include, but I decided to show it anyway because I
[09:02] clip in this entire video. After the sell trade closed successfully, I looked at the chart and I saw the lips crossing back above the teeth, both lines curving upward, price pushing higher. And in that moment, my
[09:16] mind told me one thing, the market is back in an uptrend, time to buy. So, I did. Buy entry placed. But here's what I didn't do in that moment. And this is the honest truth. I didn't look left on the chart. If I had
[09:30] looked left, I would have seen something very important. That exact price level where I entered the buy had already acted as a resistance ceiling twice on The market had hit that area, reversed, and dropped not once, but twice.
[09:45] That level had a history. And I walked straight into it without checking. The strategy gave a crossover signal. The lines were moving up. But the bigger context, the price memory
[09:57] ignored it. telling me I was wrong. Price pushed just a fraction above that resistance zone, barely breaking it. And then immediately started rejecting. The
[10:10] candles that should have been pushing upward for a buy started printing red. One red candle, then another, then another. Each one closing lower than the The two indicator lines, which were curving upward just moments ago, they
[10:25] flattened, stalled, and began hooking back down. The upward momentum that looked so convincing at entry had completely evaporated within just a few candles. Trade closed, full loss, and I'm showing
[10:39] you this on purpose. The strategy wasn't wrong. The crossover was real. The confirmation candles were there. But I forgot to do one thing. Look left. That price level had already rejected the market twice on this same
[10:52] chart. It had a history, and I entered a buy trade right into that ceiling without checking. That's the real lesson from today. The indicator gives you the signal, but the chart gives you the context. You need
[11:04] both. A signal at the wrong location is still a wrong trade. If you want every rule and every checklist in one place, the free PDF is in the description. Download it, use it on demo first, and subscribe to Sam
[11:16] Trading Strategies, because this is exactly how every video here is built. Real charts, real results, nothing hidden.




⚡ Saved you 0h 11m reading this? Transcribe any YouTube video for free — no signup needed.