
Legendary Trader's Secret to 30% Returns
45sHigh curiosity: reveals a legendary trader's strategy and challenges audience expectations.
▶ Play Clip"The title promises a 'once in a lifetime reset' but delivers a well-known political cycle strategy—overselling a common concept."
The video explores Stanley Druckenmiller's strategy of timing the stock market based on presidential election cycles. It backtests 45 years of data to show that buying two years before an election and selling on election day yields positive returns almost every time. The strategy's edge lies in avoiding major market crashes, not maximizing gains.
Stanley Druckenmiller averaged 30% annual returns for 30 years, double the average hedge fund's 15%.
His first boss in 1976 advised buying the market two years before the general election and selling on election day, citing that presidents rig the economy for re-election.
Backtesting 1980–2025 showed major bottoms in election years (1982, 1990, 2002, etc.) and positive returns every time except 2004 (break-even).
The strategy underperforms buy-and-hold S&P 500 but avoids crashes like dotcom, housing crisis, and COVID, keeping capital efficient.
Use political cycles to scale positions: larger at cycle end, smaller at start, while still following your own trading strategy.
What is the core strategy Stanley Druckenmiller uses based on political cycles?
Buy the market two years before a presidential election and sell on election day.
00:44
What average annual return did Stanley Druckenmiller achieve?
30% annually for 30 years straight.
00:04
What is the average annual return of a typical hedge fund?
Around 15% a year.
00:17
In which presidential election year did the strategy yield negative returns?
2004, where you basically broke even.
03:24
Why does the strategy underperform buy-and-hold but still offer an edge?
To avoid the worst years and keep capital where it does the most work, rather than maximizing gains.
05:31
Druckenmiller's 30% annual returns
Establishes the credibility of the strategy's source with a remarkable performance record.
00:04The political cycle timing rule
Provides a simple, actionable rule that can be backtested and applied by any investor.
00:44Positive returns in every cycle except 2004
Demonstrates the statistical reliability of the strategy over 45 years.
03:12Edge is risk avoidance, not gains
Reframes the strategy's value as capital preservation and efficiency, not just returns.
05:31Trading is about statistical edges
Highlights the core principle of using probabilities to improve trading decisions.
06:38[00:04] because they always rig things to be good in the election year. >> This is Stanley Drunken Miller, one of the greatest traders to ever live, being known to average 30% every single year for 30 years straight
[00:17] >> Do you know how hard that is to do? Just so you guys know how big of a deal that is, the average hedge fund only makes around 15% a year. So Stanley is basically doubling that. And on top of that, doing it consistently for 30
[00:31] years. That's insane. Now, just like you're probably thinking now, I also had the same question. How did he do it? Well, being the nosy YouTuber I am, I wanted to figure that out. So, let's just say I did some research of my
[00:44] own. I read every article, every blog post, every video about Stanley Drunken Miller. And then I stumbled upon this. Roll it. My first boss in Pittsburgh in 1976, he said, "Stanley, the way you time the political cycle is you buy the
[01:00] market two years before the general election and then you sell it on the general election because they always rig things to be good in the election year." He said this in 76. We had major bottoms in 78, 82, 86, 90, 94, 98, 02. Not so
[01:16] much in ' 06 cuz Bush tried to push it through all [music] the way. And we see >> now. Sure, markets are dependent on a lot of things like price action. They're dependent on highs and lows, etc., etc. But what if there are market cycles
[01:28] happening within the market that were highly highly predictable? Now, what Drunken Miller discovered is that 2 years before a presidential election, the stock market would often become very bullish. Like stupidly bullish. Why?
[01:41] Because presidents want their party to get reelected again. And how do they get their party reelected again? By inflating the economy. Now, also, just like you, I was a little skeptical. There's no way following a strategy as
[01:53] simple as this could actually make good enough returns to retire you for life. >> Right. Right. >> So, in good old Trading Lab fashion, actually works. First thing I want to do, I want to see if the statistics
[02:06] actually back up what Stanley is saying. So, I went to Chat GBT and asked it what the average returns are for each year of the political cycle. The statistics surprisingly backed up what Stanley was saying. Years one and two of the
[02:19] president being elected generally had lower returns while the end of their term generally had higher returns. Pretty interesting. So now we know the markets on average performed better at the end of political cycles at least on
[02:31] average. But these statistics weren't enough for me. I wanted to see how this strategy actually performed solely around this idea. To test this, I went to my charts and this is where things started to become very very eye
[02:44] openening. I marked every year from 1980 till now. So 45 years of back testing and I marked with a white line two years before the president actually got elected. Then I marked with a green line when the president actually got elected.
[02:57] And by simply just looking at this, we had major bottoms in 78, 82, 86, 90, 94, had major bottoms in 78, 82, 86, 90, 94, 98, and O2, which all of these years are when the new president got elected. So, if you simply followed the strategy of
[03:12] investing 2 years before the president got elected, then sold when the president actually got elected, you would have made positive returns every single time. Let me repeat that. Positive returns every single time. Out
[03:24] of the 40 years, the only time we had negative returns was the presidential election of 2004 where you basically broke even. This is absolutely crazy, but the thinking behind this actually makes a lot of sense. If a president
[03:39] wants him or his party to be reelected, he's obviously going to try to make the economy and the markets as good as he possibly can, even if that means possibly can, even if that means overinflating it for a short-term gain.
[03:52] Which, if that's the style of thinking, what often happens when the new president gets elected, he's now dealing with an overinflated market, which will often tend to naturally correct. But we ran into a major problem with this
[04:05] strategy. You see, I shared this exact strategy with my Instagram followers. Instagram, what are you doing? Anyways, I shared this exact strategy with my followers, and a lot of you had the exact same criticism, specifically from
[04:19] exact same criticism, specifically from a user with the name of I like corn 69. >> It's corn. >> Well, instead of buying and selling during political cycles, if you just held the S&P 500 for those 45 years
[04:31] instead, you would have made more money. And this is true. But let me cook. You see, sure, if you bought and held the S&P 500, you technically would have made more money compared to just using this strategy. That is true, but here's the
[04:47] have had to hold through the dotcom bubble, the housing crisis, and corona virus, and all the other drastic market crashes throughout the 45 years where your portfolio would have gone down 60% or more multiple times. Would you have
[05:03] the emotional or financial control to do that? Maybe, but also maybe not. If you hand, you would have been out of the market during all of these crashes, all of them. Meaning, you could have used your capital to invest elsewhere where
[05:18] your money is way more efficient, and you could have made way more money investing in other markets during these periods. That's the edge. You can use your capital where it's more efficient. Yeah, this strategy underperforms the
[05:31] S&P buy and hold strategy, but that's not where the strategy shines. It's not trying to get the best gains. It's trying to avoid the worst years and keep your money where it does the most amount of work. What we are trying to do with
[05:43] this strategy is implement it so the probabilities work with us instead of against us. So, no, I wouldn't just blindly buy and sell based purely off presidential market cycles. That's not what I'm saying to do. But what you can
[05:56] do is use it to your advantage. For example, you can use your own trading strategy or one of the many trading strategies I've shared on my YouTube and use these political cycles as a gauge for scaling your positions. For example,
[06:09] you can position larger with your current strategy during the end of probabilities are statistically in your favor. And you can position smaller at because you now know they tend to underperform. But in the end, still
[06:24] enter and exit based on the strategy you're currently using. The proof is in the pudding. The statistics don't lie. It is statistically proven that the end of political cycles on average perform better than the beginning of political
[06:38] cycles. That's a fact. And more importantly, that's an edge. And trading is all about finding statistical edges to improve the probabilities of your current strategy with this mindset, you can take advantage of scaling in
[06:52] aggressively when the probabilities are more in your favor. And you can position less aggressively when the odds are not so much in your favor. That's the point I'm trying to make. And if you have this style of thinking, it's definitely
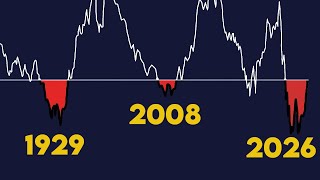
[07:04] probable you could outperform the S&P 500 with what I just taught you. And the crazier thing is, if you were to follow this strategy, 2026 is the year you would be buying and 2028 is the year you would sell. What do you guys think?
⚡ Saved you 0h 07m reading this? Transcribe any YouTube video for free — no signup needed.



![BEST MACD Trading Strategy [86% Win Rate]](https://img.youtube.com/vi/rf_EQvubKlk/mqdefault.jpg)