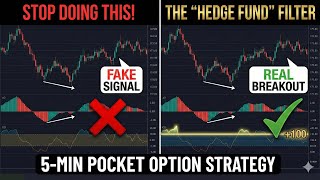

Stop Buying the Dip! Fix Your Divergence
45sDirectly addresses a common painful trading mistake, promising a solution that hooks viewers.
▶ Play Clip"The title promises a 'hedge fund' setup, but the content is a basic divergence strategy with a CCI filter—useful but not revolutionary."
This video presents a divergence trading strategy for Pocket Option, combining the Awesome Oscillator with a CCI40 filter to identify high-probability entries. It covers the setup, execution, and common pitfalls, including a detailed analysis of a losing trade.
The strategy uses a 1-minute chart and 5-minute expiration, creating a 5:1 ratio to allow divergence to play out.
Awesome Oscillator on default settings; CCI period changed to 40 to smooth out noise and show true trend strength.
Buy: Price makes lower low, AO makes higher low with green bars, CCI40 below -100. Sell: Price makes higher high, AO makes lower high with red bars, CCI40 above +100.
A live example shows a sell trade where price rejected at top, AO flipped red, and CCI40 crossed below -100, leading to a profitable 5-minute trade.
A losing trade occurred because the trader ignored a major resistance level, buying at the top despite strong momentum indicators. Lesson: market structure beats indicators.
In a strong uptrend, high CCI readings (above +100) indicate buyers are in control, not overbought. Joining the trend with a buy trade can lead to instant profits.
What are the recommended chart and expiration timeframes for the Golden Oscillator strategy?
1-minute candle for charting and 5-minute expiration for trades.
00:55
What period should the CCI be set to in this strategy?
The CCI period should be changed to 40.
01:11
What settings are used for the Awesome Oscillator?
The Awesome Oscillator on default settings.
01:11
What are the conditions for a buy signal in this strategy?
Price makes a lower low, AO makes a higher low with green bars, and CCI40 is below -100.
01:27
What are the conditions for a sell signal in this strategy?
Price makes a higher high, AO makes a lower high with red bars, and CCI40 is above +100.
02:09
What is the most important lesson from the losing trade example?
Market structure beats indicators every single time.
05:25
What does a CCI reading above +100 signify in a strong uptrend?
When the CCI is above +100, it indicates buyers are dominating, not overbought.
06:44
CCI40 Filter
Changing the CCI period to 40 smooths out noise, revealing true trend strength and reducing false signals.
01:11Market Structure Beats Indicators
This principle emphasizes that technical indicators cannot override key support/resistance levels, a crucial risk management insight.
05:25High CCI is 'Charged', Not Overbought
Reframing high CCI readings as a sign of strength rather than a reversal signal is a counter-intuitive but powerful trading mindset.
06:44[00:01] for any length of time, you know the pain of spotting a perfect reversal only for the price to keep crashing against you. You bought the dip, but the dip timing. The [music] problem is that standard divergence signals give too
[00:15] time frame, but today we are going to fix that. Welcome back to SAM Trading Strategies. In this video, I'm revealing my golden oscillator setup. We are taking the professional concept of divergence and adding a specific heavy
[00:29] filter that most traders ignore. This is designed for five-minute expireies on pocket option to help you avoid the fake outs and find the high probability entries. Before we jump into the settings, remember [music]
[00:41] trading involves risk. This strategy is for educational purposes to help you understand market momentum. Never trade money you can't afford to lose. [music] Now, let's set up the charts. Open your Pocket Option terminal. First, set your
[00:55] candle time to 1 minute. Next, set your trade expiration time to 5 minutes. This 5:1 ratio is crucial. We need time for the divergence to play out. Now, the indicators, this is where the magic happens. Awesome oscillator. Leave this
[01:11] on default settings. This is our momentum detector CCI. Change the period to 40. I repeat, change it to 40. Most people use the standard 14 or 20. By smoothing out the noise. We don't want to see every tiny bump. We want to see
[01:27] the true trend strength. [music] Here is exactly what you look for to take a buy trade. Look at the price. It's making a lower low. It [music] looks like it's dropping, but look at the awesome oscillator. It is making a higher low
[01:40] and green bars are starting to appear. The momentum is shifting up even though price is down. Before you click up, look at the CCI40. For this specific strategy, we want the CCI to confirm the move. Note, if the CCI is holding
[01:55] bottom. We are buying a pullback in a powerhouse trend. Now, let's flip it for the sell. We wait for the price to push up and make a higher high. However, the awesome oscillator is tired. It makes a lower high and starts showing red bars.
[02:09] That is bearish divergence. Now, check the golden filter. Is the CCI below minus 100? If [music] yes, it confirms that despite this little pop in price, the heavy momentum is dragging it down. That is your trigger to take a
[02:23] five-minute sell. To help you remember these rules, I've created a free step-by-step checklist PDF. You can download it from my Telegram channel. The link is in the description. Knowing the rules is one thing, but seeing it
[02:36] live is where you actually learn. I'm going to show you a few raw examples of this happening right now. And I'll point out one common mistake that ruins this miss that. Here is the setup. The market
[02:48] right here. First, look at the price action. We saw a rejection at the top. Those wicks are telling us the buyers are exhausted. But I didn't enter yet. I waited. Now, look down at the awesome oscillator. See those red bars? The
[03:03] momentum has flipped. We have a clear shift from buying pressure to selling important part, I did not click sell until I checked our filter. Look at the CCI40. [music] It has crossed decisively below minus
[03:18] 100. This is the green light. The CCI is telling me, Sam, this isn't a fake dip. This is a real breakout. As soon as that I entered the trade with a 5-minut expiration. Now, this is the part where
[03:33] most beginners panic. We are about 2 minutes into the trade. If you are watching a standard 14 period indicator, you might get scared by every little [music] But because we are using the CCI40, we aren't worried about the small
[03:46] noise. Look at the chart now. The price is melting down perfectly. The awesome oscillator is expanding further into the red, confirming that the bears are in total control. This is why we use a 5-minute expiry. We need to give the
[04:00] market time to breathe and let the divergence play out. I'm not stressing. I'm just letting the probability work in my favor. And here is the result. The trade closes comfortably in the money. Now, I could end the video here and let
[04:13] you think I never lose. But that wouldn't help you grow. To be a top 1% trader, you have to dissect your failures even more than your wins. So, let's look at a trade I took earlier that ended in a loss. This is a perfect
[04:27] example of what I call the context trap. Let's break down exactly what went wrong. Here was the situation. I was looking for a trend continuation. My awesome oscillator was showing green bars. My CCI40 was sky-high above plus
[04:41] 100 suggesting strong momentum. Technically, the indicator said up. So, I clicked buy, but I missed one giant red flag. I was so focused on the bottom of the screen, the indicators, that I ignored the top of the screen, the price
[04:57] bought exactly at a major resistance level. The price had already rallied hard and it ran straight into a ceiling. I effectively bought the exact top. As soon as the trade opened, the reality set in. Watch what happens. Instead of
[05:11] breaking through, the candles turn red immediately. The market isn't finding new buyers at this high price. It's finding sellers who are pushing it back down. My strong momentum on the CCI, it doesn't matter anymore. Why? Because
[05:25] market structure beats indicators every single time. I tried to force a trend continuation right into a brick wall. And now I'm just sitting here watching the trade bleed out, hoping for a miracle that isn't coming. And the trade
[05:37] miracle that isn't coming. And the trade closes. It's a loss. Zero payout. This is the most valuable lesson of this video. The golden oscillator strategy tells you what the momentum is doing, but you must decide where to play it.
[05:50] Never take a buy signal directly into a resistance zone, and never take a sell signal directly into support. The filter works but it cannot break walls for you. Mark your levels first, then let the indicators guide you. We have seen a
[06:03] reversal trade and we [music] have seen a trap. But now I want to show you my absolute favorite way to use the golden oscillator. This is what I call the free ride. Sometimes you don't need to predict a turn. Sometimes the market is
[06:17] screaming at you to just go with the flow. Let me show you what I mean. Look at this chart. The market isn't subtle here. It is in a massive uptrend. [music] Now, a lot of amateur traders get scared here. They think, "Oh, the
[06:30] price is too high. It has to come down." And they try to sell. That is a huge mistake. I looked at my indicators and they told a different story. Awesome oscillator. Look at those tall green bars. Momentum isn't slowing down, it's
[06:44] speeding up. CCI [music] 40. The yellow line is floating way above plus 100. When the CCI is this high, it's not overbought, it's [music] charged. It tells me the buyers are completely
[06:56] dominating the sellers. So instead of fighting it, I join them. [music] I placed a buy trade right here. This is the beauty of trend trading. When you the trade often goes into profit instantly. Look at where the price is
[07:09] now compared to my entry. It has absolutely skyrocketed. I'm not sweating. I'm not analyzing every tick. I can sit back and sip my coffee because the golden filter, the CCI, confirmed that this rocket still had fuel in the
[07:22] tank. Notice how the awesome oscillator is still printing green. As long as that's happening, we don't worry about a thing. And just like that, the 5 minutes are up. The trade closes miles above our entry point. This wasn't a close call.
[07:35] This was a dominance. You now have the full blueprint, the setup, the execution, and the trap. The golden oscillator isn't about guessing. It's about waiting for the market to show you the way. I've uploaded the official
[07:48] cheat sheet PDF with all the settings to my Telegram channel. The link is in the description. If you learned something new today, do me a favor, smash that share this knowledge with other traders who are struggling. I'm Sam. Keep your
[08:03] charts clean and I'll see you in the next




⚡ Saved you 0h 08m reading this? Transcribe any YouTube video for free — no signup needed.