
95% Win Rate Strategy That Actually Works
45sClaims of an extremely high success rate immediately grab attention and create curiosity in the trading community.
▶ Play Clip"The title promises a 95% success rate, but the video claims 90% and shows examples; slightly exaggerated but mostly delivers."
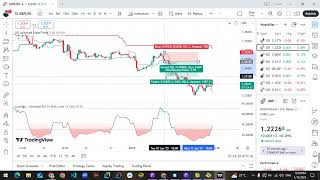
This video presents a trading strategy for the TradingView platform that uses two RSI-based indicators to achieve a claimed 90%+ success rate on any currency pair and timeframe. The strategy combines a general trend filter from the RSI Adjust SuperTrend indicator with overbought/oversold signals from the Ultimate RSI indicator, entering trades only when both align and a regular SuperTrend signal confirms the entry.
The strategy works on any currency pair and timeframe, from minute to daily. The presenter claims a 90% trade success rate if conditions are implemented correctly.
RSI is a leading indicator that predicts price movement before it happens, unlike lagging indicators like moving averages or MACD. It gives early signals with low stop-losses.
Two indicators: RSI Adjust SuperTrend (based on RSI) and Ultimate RSI (regular RSI with moving average). Default settings are used except for showing the stop loss line on the SuperTrend.
Three conditions: 1) RSI Adjust SuperTrend shows a bearish signal (red line), 2) Ultimate RSI touches the 70 level (overbought), 3) Regular SuperTrend gives a bearish signal. Enter on candle close after the third condition.
Stop loss is set at the last peak that caused the overbought condition. Take profit is set at a 1:2 risk-reward ratio (double the stop loss distance).
Avoid trades with a large stop loss, especially if the entry candle is a news candle. This improves trade quality but is optional.
For buy trades, conditions are reversed: SuperTrend bullish signal, Ultimate RSI touches 30 (oversold), and Regular SuperTrend bullish signal. Stop loss at last trough, take profit 1:2.
Larger timeframes (e.g., 4H, daily) are recommended for better trade management and psychological comfort, though the strategy works on all timeframes.
The strategy relies on three clear conditions using RSI-based indicators to achieve high win rates. The presenter emphasizes discipline in following the rules and suggests using larger timeframes for better results.
What type of indicator is the RSI according to the video?
A leading indicator that predicts price movement before it happens.
00:48
What are the two indicators used in this strategy?
RSI Adjust SuperTrend and Ultimate RSI.
06:27
What are the three conditions for a sell trade?
1) RSI Adjust SuperTrend gives a bearish signal, 2) Ultimate RSI touches 70 (overbought), 3) Regular SuperTrend gives a bearish signal.
09:47
Where is the stop loss placed for a sell trade?
At the last peak that caused the overbought condition.
15:08
What is the take profit target in this strategy?
A 1:2 risk-reward ratio (double the stop loss distance).
15:23
What is the optional fourth condition mentioned?
Avoid trades with a large stop loss, especially if the entry candle is a news candle.
16:31
For a buy trade, what level should the Ultimate RSI touch?
30 (oversold).
21:45
What does the presenter recommend regarding timeframe?
Larger timeframes (e.g., 4H, daily) for better trade management and psychological comfort.
24:01
RSI as Leading Indicator
Explains why RSI is preferred over lagging indicators for early signals.
00:48Three Conditions for Sell Trades
Core entry rules that form the backbone of the strategy.
09:47Stop Loss and Take Profit Rules
Clear risk management guidelines for consistent trading.
15:08Timeframe Advice
Practical advice on trading psychology and trade management.
24:01[00:02] upon our Prophet Muhammad, his family, and all his companions. Today, God willing, we'll talk about a new strategy on the TradingView platform. This strategy works with any currency pair and any timeframe, from the minute to the daily. We'll even hang together
[00:20] today on the 15-minute and 4-hour timeframes to confirm its 4-hour timeframes to confirm its effectiveness across all timeframes. effectiveness across all timeframes. If you implement the strategy's conditions, your
[00:34] If you implement the strategy's conditions, your trade success rate will improve to 90%. We'll see this together today through testing. Okay, this strategy relies on the Okay, this strategy relies on the RSI indicator. The RSI is one of the best
[00:48] indicators in the market, and it's considered a lead indicator. A lead indicator, meaning it's the
[01:00] price's retracement. Unlike some other indicators that are retracement indicators, meaning they move after the price moves, like the moving average, the MACD, the price moves, like the moving average, the MACD, the Parabolic SAR, and many others. It
[01:16] follows the price when the price moves. It moves, so it moves, you know? Its signal is delayed, so sometimes it delays you or puts you in late. But the advantage of the RSI is that it moves.
[01:29] late. But the advantage of the RSI is that it moves. strategy. Okay, we'll just add the RSI indicator to the condition to show just add the RSI indicator to the condition to show you the idea that it moves with the price. This is
[01:43] you the idea that it moves with the price. This is example, if we look at this spot, focus with me now, for example, this is the bottom. This is the bottom.
[02:00] Where is the base on the indicator that corresponds to the base on the indicator? The base was here. was here. Great, this bottom was drawn on the indicator.
[02:12] Another bottom, you know? The price moved up, the indicator also moved up. Okay, very normally. Now focus with me. The base on the indicator. Focus with me on the indicator. Leave the price for now.
[02:25] me on the indicator. Leave the price for now. The base on the indicator after the price went up. When did the price break? The base on the indicator after the price went up. When did the price break? When did the base break? The base When did the base break? The base broke right here. This was the
[02:37] broke right here. This was the first movement of the indicator. The previous low was broken. first movement of the indicator. The previous low was broken. The price went up, up, up, and then down, down, down. Where did it break the previous low? Right here. We could put a circle here and place it where the
[02:54] previous price broke, or where the previous low was broken. Notice that. Now pay attention. So, if if the indicator says the previous low has been broken, it's a the indicator says the previous low has been broken, it's a bearish signal. Now look at this spot on the
[03:09] indicator. What candle are we on? Imagine we're here. here. Focus. When we were here, we were here. The indicator is telling me the
[03:21] Focus. When we were here, we were here. The indicator is telling me the base has been broken. Notice that the low hasn't actually been broken yet, but base has been broken. Notice that the low hasn't actually been broken yet, but the indicator is showing the low breaking. The RSI indicator predicted that this low would be broken, and it did. Notice that it's a
[03:37] leading indicator, meaning it gives a signal before the price actually moves. That's why you'll find that the RSI is the
[03:49] you'll find that the RSI is the most used indicator in most used indicator in trading. Notice that any strategy that relies on the trading. Notice that any strategy that relies on the RSI is successful.
[04:01] You'll find it successful at night, as you can see. For example, if you set the moving average now, it will tell you that your overall trend is clearly upward at this point. There's a higher low
[04:13] overall trend is clearly upward at this point. There's a higher low clear upward trend. However, it says that this low was broken on the indicator. It wasn't
[04:26] broken upwards; on the contrary, we were significantly higher, and there was no broken upwards; on the contrary, we were significantly higher, and there was no signal. signal. But indeed, the price (RSI) predicted
[04:39] the break of the low, and it happened. The low was indeed broken. What I'm trying to say is that the RSI is a leading indicator, meaning it predicts indicator, meaning it predicts price movement before it happens. It predicts, right?
[04:55] price movement before it happens. It predicts, right? You might say, "But it can be wrong in predicting." Of course, it can be wrong in predicting, but the level it gives you is that it gives you trades with low stop-losses. When it enters you here, your stop-loss is the previous high, meaning it gives you trades with
[05:12] low stop-losses, while when you profit, you'll profit a lot. That's why any strategy... Any strategy that relies on the RSI will have a low stop-loss and a low open-loop. I just gave you a general idea that the
[05:29] I just gave you a general idea that the RSI indicator and its related indicators are all based on the RSI. You'll find that they often give based on the RSI. You'll find that they often give excellent entry signals. Of course, in
[05:42] our strategy today, we won't use the R itself. We'll use two indicators whose RSI is R itself. We'll use two indicators whose RSI is based on the formula... on the formula... So, I wo n't use that today. Let me show you what indicators we'll be using today.
[05:58] Sorry, that was just an introduction to show you how powerful this indicator is. If you study it well and work with it on many strategies, you'll find its results are
[06:10] excellent. Okay, excuse me. Let's continue and get our indicators. As I said, we'll use two indicators that rely on the RSI. The first indicator is the RSI Adjust
[06:27] first indicator is the RSI Adjust Super Trend. This is a Super Trend based on the RSI Super Trend. The Super Trend. This is a Super Trend based on the RSI Super Trend. The algorithm is based on the RSI equation. Let's add something else to the condition. We
[06:46] of my favorite indicators; I personally use it a lot, a lot, a lot, a lot. It's an excellent indicator. So, I've now added two indicators. Both rely on
[06:58] now added two indicators. Both rely on what? On the RSI. They both rely on the equation. Now let's look at the settings of each indicator. We'll start with the RSI Adjust Supertrend. We'll go to the settings and leave the default settings in the
[07:14] input. We won't go there. The default settings will remain as they are. All you have to do is as they are. All you have to do is what? Show Regain Stop Loss. We'll make it show a stop loss for our trades. As you can see, it shows an
[07:30] internal supertrend, meaning it shows an internal supertrend. Nice. supertrend. Nice. We leave the default settings and now we can change the colors and the We leave the default settings and now we can change the colors and the line thickness, for example. We can get
[07:43] line thickness, for example. We can get this to draw The line is the same
[07:55] [music] here, and we remove the label and the win. To save these settings for later use, you can go to the default settings later use, you can go to the default settings and say "Save as default"
[08:09] and then "OK." Now, if you delete the indicator and reinstall it, you'll find it in RSI Adjust SuperTrade with the settings you just set. Got it, guys?
[08:21] you just set. Got it, guys? That's the idea. So, as we can see, these are the settings for the first indicator. We'll essentially work with the first indicator. We'll essentially work with the default settings. The great GI indicator...
[08:36] we'll leave everything as is. We can change the orange color to orange color to blue, the overboot to blue, the overboot to 70, and the oversole to
[08:51] 70, and the oversole to 30. We'll make the color 30. We'll make the color red. Then we'll go to the style and remove the middle extension; it's not needed at all. We'll also remove the lip and the other extensions, and then do the same thing again.
[09:06] remove the lip and the other extensions, and then do the same thing again. Save Set the indicator to Default, then press OK. Now, if I uninstall it and then reinstall it, it will come back with the
[09:19] same settings. The idea is that I don't need to adjust the settings every time. Now, let's focus on the entry conditions, guys. Pay attention. Have a pen or paper handy and write them down or jot them down in
[09:31] any notebook you have so you know the entry conditions. If you implement them as I told you, the success rate of your If you implement them as I told you, the success rate of your trades will be more than 90%. Okay, focus trades will be more than 90%. Okay, focus with me. The first signal we'll take from the indicator is the
[09:47] with me. The first signal we'll take from the indicator is the Super Trend. Is the trend upward or downward? As you can see, this red line indicates... ignore the internal Super Trend. This large Super Trend indicates that the trend is downward. Notice, guys, just to prove to you that the
[10:04] downward. Notice, guys, just to prove to you that the Super Trend is different from any other Super Trend, Super Trend is different from any other Super Trend, notice where it actually gives you the sell signal. By the way, remove this for a moment, let me remove this one. I just want to show you
[10:19] a moment, let me remove this one. I just want to show you how accurate its signals are. Very well, look, it's giving you a how accurate its signals are. Very well, look, it's giving you a bearish signal from where, while if you had any other super trend indicator at all, it wouldn't give you a bearish signal here. You haven't even broken the previous low.
[10:34] You haven't broken the previous low to give me a bearish signal, but the price has indeed fallen. That's what I'm talking about. That's what I'm talking about. If you put any super
[10:46] about. If you put any super trend indicator on the GBP/USD, you'll find it doesn't give you a trend indicator on the GBP/USD, you'll find it doesn't give you a bearish signal here. Notice the bullish signal here, even though you haven't broken the previous high. Also, when it gave you the signal, we hadn't yet broken
[11:00] it gave you the signal, we hadn't yet broken that previous high. Do you understand? And so on. It's a strategy in itself. Notice where we are, and it's giving me a bearish signal. Notice where we are. We're in a Notice where we are. We're in a clear upward trend, and it's giving me a bearish signal, and it was. Do you understand? So
[11:15] clear upward trend, and it's giving me a bearish signal, and it was. Do you understand? So the indicator itself is a strategy without anything else, without any other additions. I can enter my trade here any other additions. I can enter my trade here normally, very normally. I sometimes do that, and
[11:27] normally, very normally. I sometimes do that, and if the trade reverses... Reinforce it, and you're paying attention, it's perfectly normal, I have no problem entering my trade here. Yes, I can enter my trade normally. And if the indicator reverses, I start waiting for a signal, for example, from another indicator, and then I enter a trade again, going up, and
[11:42] another indicator, and then I enter a trade again, going up, and I take my profit. You see, as you can see, look where it's giving you a drop. It's giving you a drop at a certain time. It's literally a strategy in itself. This indicator is a great indicator, the RSI Adjust Super. That's it. But look, I've given you the idea.
[12:00] Anything that depends on the RSI, its signals are... because of the RSI equation itself, because of the mathematical equation of the RSI itself. Anyway, so I don't make RSI itself. Anyway, so I don't make this part too long, let's show the internal super trend. We
[12:16] can reduce the thickness of this internal super trend a little so that... we reduce its thickness a little, and then we save it as default and press default and press OK. No, this does the
[12:49] here doesn't mean... Stop loss means Super Trend, okay? That's an abbreviation. Anyway, let's Super Trend, okay? That's an abbreviation. Anyway, let's Pay attention to the entry conditions in our strategy. I'm explaining a
[13:05] lot today, and we're going through it together, to tell you how important the RSI is. It's an important indicator. Any indicator that relies on the RSI is important. Make sure there's something important about this indicator if
[13:18] something important about this indicator if you use it correctly. The first signal I get from Adjust is a Super Trend, a general downtrend. Okay, that's the first signal, the first condition. Now, the
[13:30] that's the first signal, the first condition. Now, the second condition is that the Ultimate RSI touches a second condition is that the Ultimate RSI touches a level. Notice, the Ultimate touches level 70.
[13:42] Okay, so those are the first two conditions. As long as the general trend is down, I wait for the Ultimate RSI, which is the black one. That's the RSI itself, the moving average. The blue one is just a move average, it doesn't matter.
[13:54] Why? Because I can remove it, by the way. It's not very important in this strategy. You can remove it important in this strategy. You can remove it if
[14:06] you want. I think it can be removed, it's normal. We don't need anything at all. removed, it's normal. We don't need anything at all. Today's crossovers are important, so pay attention. The
[14:23] signal number is weak, but it's just a signal. Okay, the Regular Super Trend signal gives a Hop-
[14:37] Regular Super Trend signal gives a Hop- Tider signal. Three signals, three conditions. This gave me a Tider signal. Three signals, three conditions. This gave me a bearish signal. Then the Ultimate RSI touched the bearish signal. Then the Ultimate RSI touched the 70 level. Now, look here, we
[14:52] touched the 70 level. Then I wait for the Regular Super Trend to give me a bearish signal, Regular Super Trend to give me a bearish signal, and I enter my trade with the close of this candle. Here it is, the one where the and I enter my trade with the close of this candle. Here it is, the one where the
[15:08] signal appeared. The Regular Super Trend signal. The stop loss is the last peak or the last last peak or the last trough. How do you know it from overbought conditions? Look at the overbought condition. This peak that caused the overbought condition is the stop loss. Now, the take profit? The take profit is at a
[15:23] ratio of 1:2. My stop loss is doubled, My stop loss is doubled, meaning the risk return ratio will be 1: 2, maybe even more than that. As you saw, the price dropped with me. More, but
[15:40] what are we going to do? These are the rules of the strategy. So, there are three conditions, guys, and now you'll give me a fourth condition. conditions, guys, and now you'll give me a fourth condition. But this depends on your trading experience. This fourth condition... Look at the three conditions. The first condition: To enter a bear trade, to enter a bear trade,
[15:55] guys, to enter a sell trade, I have three conditions: The upper limit of the Supertrend gives me a bearish signal. The upper limit of the
[16:07] RI touches the 0 level. It only touches it. The upper limit of the Supertrend gives a signal. I enter my trade with the closing of the candle. The signal is good. My stop loss is at the last peak. The overbought/oversold condition is good. And the take profit is
[16:19] signal is good. My stop loss is at the last peak. The overbought/oversold condition is good. And the take profit is double the stop loss. That's it. This is the rule of the strategy for entering a bear trade. Good. Okay, what's the
[16:31] fourth condition, Bash and Anas, that you told me about? Focus with me, guys. If you find the stop about? Focus with me, guys. If you find the stop loss is too large, don't enter the trade because sometimes there's an information candle. For example, imagine if this candle... Imagine with me if this candle
[16:48] closes right here. Wow! At that point, it's not logical for you to enter. For the trade to be like this, your stop loss should be here because,
[17:04] candle closes. So, there might be a news candle [music] that closed here. Of course, the signal is only there course, the signal is only there after the close, so you can't
[17:20] enter with a large stop loss if you can't determine if it's large or large stop loss if you can't determine if it's large or small. Go ahead and enter, just stick to the first three conditions.
[17:32] small. Go ahead and enter, just stick to the first three conditions. But this fourth condition is fine; it will improve the trades. If my stop loss is large, or if you feel that the candle that opened the trend is a super trend or a news candle, the candle that opened the trend is a super trend or a news candle, don't enter. The trade might succeed, but the point is,
[17:46] we don't want any trade with a large stop loss at all. So, you know the entry conditions for a downward trend. The entry conditions for a downward trend, guys: a super trend gives me a downward signal, a bearish signal, a
[18:09] bearish signal. Enter with my signal. The last overbought signal is one lot, add to that.
[18:21] If you lose a lot, a trade will compensate you. That's why you have to stick to not entering a trade with a slightly large stop loss. Okay, let's see. Okay, guys, these are the rules of the strategy. Let's look at another trade. Focus
[18:36] with me. All this decline only gave me this one signal. Someone might say, "But there's another signal, right?" Someone might say, "But there's another signal, right?" Yes, but where's the oversold condition? The conditions weren't met. Yes, but where's the oversold condition? The conditions weren't met. Notice where the oversold condition is? Even if it was successful, even if
[18:51] Notice where the oversold condition is? Even if it was successful, even if this signal was successful, as long as the conditions were n't met, I still didn't enter. And even if n't met, I still didn't enter. And even if the conditions were met and I entered a trade and it failed, I'd
[19:03] go back and do the same thing. Who told you that you'll succeed in every trade? succeed in every trade? Focus on fulfilling the conditions. Focus on Focus on fulfilling the conditions. Focus on one thing and execute it consistently, and then you'll see
[19:16] how the results will be. Okay, let's look at another trade. Now I have a general upward trend from here to here. Did any oversold condition appear during the period from this candle
[19:29] condition appear during the period from this candle to this candle? You say, "Yes, it appeared. Oversold, to this candle? You say, "Yes, it appeared. Oversold, engineer, oversold!" Yes, but the trend had already engineer, oversold!" Yes, but the trend had already ended. The trend wasn't even still in effect.
[19:41] Someone might say... Okay, no, the overbought condition appeared in this candle. Yes, the overbought condition appeared in this candle, but this candle. Yes, the overbought condition appeared in this candle, but look up, look up at the look up, look up at the regular Super Trend signal. I
[19:55] told you, we'll wait for the Reg Super Trend signal. If no trades appear in this direction, we'll look at the previous direction. Okay, okay, come here, look closely.
[20:08] previous direction. Okay, okay, come here, look closely. Here, the conditions are met. The signal is met. The signal is Here, the conditions are met. The signal is met. The signal is
[20:30] you see this close? The Reg Super Trend appeared and gave me a signal. So, with the close of this candle, I'll enter a gave me a signal. So, with the close of this candle, I'll enter a sell trade from here. My stop loss will be my take profit. The stop loss is
[20:42] here, and the take profit will be what? It will be at a will be what? It will be at a ratio of one to two, as we always say. And it hit the spot.
[21:03] You understand? All the rules of the strategy were met. I entered, and the trade was successful. Remember, after you enter your trade, you don't need to worry about the changes that happen in the Reg Super Trend. I entered A that happen in the Reg Super Trend. I entered A take-profit and stop-loss trade, you know? Either you
[21:18] take-profit and stop-loss trade, you know? Either you hit the stop-loss or you take the profit. This strategy doesn't involve a trailing move or setting a stop- This strategy doesn't involve a trailing move or setting a stop- loss or anything like that. I enter a trade and either get a take-
[21:31] loss or anything like that. I enter a trade and either get a take- profit or a profit or a stop-loss. Okay, let's look at
[21:45] another trade. Here's a Saudi trade, guys. A bullish trade, a very clear bullish trade. All the conditions are met in this buy trade. Look, the Just Super Trend is giving a bullish signal. The buy trade. Look, the Just Super Trend is giving a bullish signal. The
[22:01] RSI is overbought. Where is it overbought? In this candle. So, let's enter? No, wait. A signal from the regular Super Trend. This one, you know? The signal came
[22:13] regular Super Trend. This one, you know? The signal came in this candle. I enter here. My candle. Enter with a buy order. This is my candle. Here, the limit is
[22:26] Here, the limit is one. Don't leave one. Where is it going? He did more than that, but what are we going to do? We'll take one or two, as that, but what are we going to do? We'll take one or two, as you can see. Of course, he made the profit in
[22:38] you can see. Of course, he made the profit in this candle. You know, guys, that's the idea. The general idea of this strategy is that it works on any timeframe. Let's strategy is that it works on any timeframe. Let's
[22:54] Any trade on the 15-minute timeframe, of course, here's an upward trend. I don't have any general downward of course, here's an upward trend. I don't have any general downward trend signals from the beginning. So, I have a general downward trend. Okay, so I'm looking for overbought conditions.
[23:08] looking for overbought conditions. See, I've got overbought conditions. I'm See, I've got overbought conditions. I'm waiting for a signal. I'm waiting for a regular supertrend signal, and I enter with this candlestick. My stop-loss and take-profit are as you can
[23:21] see. Here's my take-profit. Let me show you. No, we want a short position. Look, I 'll enter here. All the conditions are on the 15-minute timeframe. By the way, the 15-minute timeframe is fine, and
[23:33] By the way, the 15-minute timeframe is fine, and my stop-loss is the last peak, and my take-profit is my stop-loss is the last peak, and my take-profit is
[23:45] double the stop-loss, 1/2. Let's see 1/2, meaning it's 1/2. The profit in see 1/2, meaning it's 1/2. The profit in the smell, notice on the 15-minute timeframe, even on the 15-minute timeframe, you'll find it very effective. And pay attention, guys, as you saw with me, I showed you
[24:01] guys, as you saw with me, I showed you more than one trade, it's truly an excellent strategy, you can rely on it completely. Now, with a little price action, it's perfect. And as I told you, the fourth condition is that you don't enter a trade with a large stop-loss. Believe me, the
[24:17] results will be amazing. What will the results be? They'll be amazing whether you're working on small timeframes or large timeframes. For example,
[24:29] large timeframes. When small timeframes hit your stop-loss, you lose your temper. When the timeframe is When small timeframes hit your stop-loss, you lose your temper. When the timeframe is small and you lose the trade quickly, you say, "But I also win quickly." Yes, but the loss is impactful. The loss has a very significant
[24:45] psychological impact on you. So when you lose a trade in the second, the third, the fourth... On the same day, this affects third, the fourth... On the same day, this affects you psychologically, making you make impulsive decisions. But when you're working on larger timeframes, you can enter a trade
[25:00] today, wake up tomorrow, and find that the trade is still intact. If tomorrow, and find that the trade is still intact. If you feel the market is reversing, you can try to act. You have the
[25:12] opportunity to think and act. But when you're trading on smaller timeframes, there are no opportunities; you either hit a profit or a stop loss. Of course, I'm not telling you not to scalp. Some people don't know how to
[25:29] scalp. Some people don't know how to scalp. I'm just giving you advice. If you're working on larger timeframes, you'll know how to manage trades. The problem with larger timeframes is that people say, "I don't see many opportunities." Who told you that? You have 28 currency
[25:45] pairs, meaning you could have four, five, four, five, or six trades in a single week with high profits. You're on a larger timeframe, so pay attention. The profit is high here, so
[25:59] four, five, or six trades a week with high profits, profits, and you can stay calm and sleep soundly. And rest assured, I might wake up tomorrow and the trade might not have hit the stop loss, that's perfectly normal. So, this is just advice,
[26:15] nothing more. Work however you like. As you saw, I tested the strategy on a small timeframe and a larger timeframe, with the exact same conditions. Now, let's look
[26:27] same conditions. Now, let's look at any pair. For example, if there are no opportunities here, then look at this at any pair. For example, if there are no opportunities here, then look at this
[26:39] great opportunity. Notice this: a drop to overbought/oversold condition. Enter with the supertrend, and it hits the target immediately. And the one right before it: a drop to overbought/oversold condition. Enter here and hit the target
[26:52] immediately. So, as you can see, guys, you'll find all the results are excellent. Let's look at another pair. Okay, you'll find all the results are excellent. Let's look at another pair. Okay, look here: a drop to overbought/oversold condition. Enter here and
[27:04] hit the target immediately. And the one right before it: a drop to overbought/oversold condition. Enter here and immediately. And the one right before it: a drop to overbought/oversold condition. Enter here and hit the target immediately. That's what hit the target immediately. That's what I'm saying: about 90% of trades will be successful with
[27:18] I'm saying: about 90% of trades will be successful with this strategy. I really recommend you start with it. Start working on it today! Try to develop it further. If you have any other ideas, feel free to share them with me. This is something, or rather this strategy, that I personally
[27:37] This is something, or rather this strategy, that I personally use, so I wanted to share it with you. God willing, I'll see you in new strategies and new videos. See you soon, new strategies and new videos. See you soon, God willing. Peace be upon you.
⚡ Saved you 0h 27m reading this? Transcribe any YouTube video for free — no signup needed.