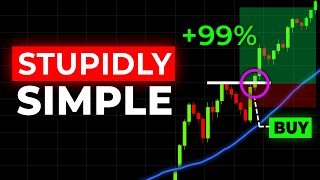

65% Win Rate Strategy!
40sHigh win rate claim grabs attention, promises easy profits for beginners.
▶ Play Clip"The title promises a simple profitable strategy for beginners, and the video delivers exactly that with clear steps and backtest results."
This video presents a simple day trading strategy for beginners using only the 50 EMA indicator and a breakout pattern. The strategy involves waiting for price to break above the 50 EMA, then entering on a pullback breakout with a stop-loss set using the Chandelier Stop indicator and a take-profit at double the stop distance. Backtesting shows a 65% win rate.
A simple day trading strategy for beginners that uses only the 50 EMA indicator. Backtested with a 65% win rate.
Add the 50 EMA indicator on TradingView. Look for price moving below the 50 EMA, then wait for a breakout above it with a candle closing above.
After breakout, wait for a pullback of at least two consecutive opposite-colored candles. Draw a horizontal line at the swing high. Enter when price breaks above that line with a candle closing above.
Use the Chandelier Stop indicator to set stop-loss. Take-profit is set at double the stop-loss distance.
Two invalidations: 1) Pullback breaks below the 50 EMA before breakout. 2) Breakout candle is 3-4 times larger than average, indicating unsustainability.
For short trades, wait for price to break below the 50 EMA, then look for two consecutive green candles, draw horizontal line at swing low, and enter when price breaks below that line.
Examples on USD/CAD and AUD/USD show successful long and short trades following the strategy.
On AUD/JPY 4-hour chart from 2020-2024, the strategy had 32 setups with 21 profitable trades (65% win rate).
This simple 50 EMA breakout strategy can be profitable for beginners if followed consistently. The key is to stick to the rules and avoid trades that get invalidated.
What is the only indicator used in this day trading strategy?
The 50 EMA (50-day exponential moving average).
00:28
What is the win rate of the strategy based on backtesting?
65%.
00:15
After a breakout above the 50 EMA, what condition must the pullback meet?
At least two consecutive opposite-colored candles (red for long trades).
01:21
How is the take-profit target set?
At double the stop-loss distance.
02:17
Name two conditions that invalidate a trade setup.
1) The pullback breaks below the 50 EMA. 2) The breakout candle is 3-4 times larger than the average candle.
02:32
For a short trade, what pattern do you look for after price breaks below the 50 EMA?
Two consecutive green candles (pullback to upside), then draw a horizontal line at the swing low, and enter when price breaks below that line.
04:19
What indicator is used to set the stop-loss?
Chandelier Stop indicator.
02:04
65% Win Rate
Demonstrates that a simple strategy can be highly profitable.
00:15Pullback Rule
Key technique to filter false breakouts and improve entry timing.
01:21Trade Invalidations
Critical for risk management; knowing when not to trade is as important as knowing when to trade.
02:32Backtest Results
Provides empirical evidence of the strategy's effectiveness over a multi-year period.
07:10[00:02] the simplest day trading strategy for beginners you literally don't need any experience to be profitable and it's the strategy I wish I would have known when I first started out because it uses Concepts that professional Traders use
[00:15] but simplified so much that anyone can do it and just because the strategy is simple doesn't mean it's not profitable as I've also did a back test of it and it came out with a staggering 65% win rate which is pretty good for just a
[00:28] simple strategy so let's get started the strategy is so simple we only look at one indicator and we don't have to think about anything else and that indicator is the 50 EMA the 50 EMA is the 50-day exponential moving average it is a line
[00:42] on a chart that shows an average price of an asset over the last 50 days but with more weight given to recent prices to apply this strategy all we need to have on the screen is just a price chart and the 50 EMA to do that pick the chart
[00:55] you want to analyze and click indicators here we look for EMA we open it and go to settings and set it to 50 so what we're looking for is a
[01:07] chart where the price is moving below the 50 EMA such as in this chart for example the strategy starts once the price breaks above the 50 EMA and a candle closes above it as you can see in this chart so the first step of this
[01:21] strategy is complete a break above the 50 EMA then we're going to wait for a pullback however we only consider a pullback a real pullback when we have at least two opposite candles coming down so that's two backto back red candles
[01:35] after we broke above the EMA once we see that happening we draw a horizontal line at the swing high point before we see that pullback then after we see the two red candles we're going to wait for the price to break above the horizontal line
[01:50] but remember the body of the candle needs to close above the line and when that happens such as it does here that's when we buy but even when the setup is perfect a trade is not guaranteed to be successful and that's why we need to set
[02:04] a stop- loss to limit our risk to do that we add one more tool to our strategy so on trading view go to indicators again and type chandelier stop and click the one right here by pip Charlie once it is applied we place the
[02:17] stop loss of our entry at the chandelier stop in this example that would be right here we then set a take profit Target at Double the stop loss which is right here that doesn't always always mean that it's a good trade I have two main things
[02:32] that invalidate the trade for me first when we get a pullback but price breaks below the EMA so let's say that all the first steps in this strategy go according to plan we break the EMA after trading below it for a while we then get
[02:45] a pullback of two consecutive candles which means we can draw the horizontal line but then before we managed to break that line the pullback was too deep that it broke below the EMA if this happens the trade is automatically invalid
[02:59] because it means that her pullback isn't totally clean the second invalidation for me is if the breakout candle is way bigger than the average candle so if the breakout is three or four times as big as the average candle like in this
[03:12] example there's a high chance that the breakout is unsustainable and that price May reverse back down so this is also a type of setup that we should avoid now strategy it's time to talk about the sponsor of today's video and that is
[03:26] simple effects simple effects is a free trading plan platform they have over 60 different currency Pairs and basically all stocks crypto Commodities and indices that you could ever want to trade from Bitcoin to the S&P 500 to
[03:40] even Nidia stock they also come with a built-in trading view chart which means you can analyze traits and execute them on the same platform simple effects allows you to deposit more than 70 different payment methods which means it
[03:53] onto the platform and start trading and to thank my viewers they want to give you all A40 deposit bonus if you deposit at least $100 so if you put $100 on the
[04:05] platform simple effects will give you a fre $40 extra to trade with so give it a try because I think you'll love it now back to the video so in the previous example we started from a chart where the price was trading below the 50 EMA
[04:19] opposite if we take a chart that's trading above the 50 ma such as this one wait for it to break out below it and then begin our strategy by following the exact same steps which in this case we wait for the price to break below the 50
[04:34] Ma so when we get a dip below it we're then going to look for two consecutive green candles so that we can draw the horizontal line at the swing low and then when price reverses and dips below that low that's where we have a sell
[04:47] opportunity so it's the exact same pattern but in the opposite direction but okay now that we understand the strategy let's actually look at some real life examples the first one is discharge the US dollar against the
[05:01] Canadian dollar the blue line here is the EMA as you can see the price had been trading below the 50 EMA for quite some time until it broke out this is where I got interested I then wait for a pullback of at least two consecutive red
[05:14] candles after the breakout which happened right here that's where I drew the horizontal line at the highs it was then time to wait until we broke that line again when we did I bought right at the breakout candle close then I applied
[05:27] the chandelier stop set my stop loss and take profits as you can see the price hits our takeprofit Target here's another example again on the usdcad chart the pair was trading below the 50 ma for quite a while we waited for a
[05:41] breakout and then the reversal of that breakout we then drew a horizontal line at the swing high and once I saw the candle close above the line it was a confirmed breakout and I entered a long position then I applied this chandelier
[05:54] stop indicator and place our stop- loss and takeprofit Target again price hits our takeprofit region this one is an example of the exact opposite in this case the Aussie dollar pair was trading above the 50 EMA for quite a while until
[06:07] we broke it with two very long red candles in a row then I waited for a pullback to the upside when we saw three consecutive green candles that signaled point of the low and when we broke it it was time to short and again it worked
[06:21] out we hit the take-profit target on the short entry just like knowing when a trade will go well is important it is also important to be able to recog ognize when you should cancel a trade when the setup gets invalidated that's
[06:33] why I also want to show you this example as you can see the setup looked good at first we were trading below the 50 EMA for a while we then broke out and price reversed so I drew a horizontal line at the swing high but before we ever broke
[06:46] out of that horizontal line the trade already got invalidated because the price went below the 50 EMA again and if we were to continue with the trade and bought at the breakout anyways the trade would have failed and the stop- loss
[06:58] would get hit so if one of the rules that we set for the trade was not met we should try to get out of the trade because the setup was invalidated now it's important that I show you the back testing results of the strategy as you
[07:10] can see here this is every single setup of our strategy that has occurred on the Aussie Japanese dollar forour chart since 2020 to 2024 and the results the trade was profitable 65% of cases and that's a really good average in that
[07:25] timeline I used the strategy for a total of 32 times and and 21 out of 32 trades were profitable so it's proof that your strategy doesn't have to be complicated if you want to make money with trading you just need to follow a few simple
[07:39] rules and follow them every single time without any exceptions literally just stick to your plan I like this strategy a lot and I think it's the most simple profitable day trading strategy for beginners in 2024 and if you want to try
[07:52] it out for yourself I have something for you before we get to the last part of the video I just want to take a moment to talk about simple effects one more time because I actually think it's the perfect platform to test this strategy
[08:05] with as a beginner you don't want to use a complex platform because trading is it harder because you don't understand the platform I love simple effects because it's so easy to use and that's why it's so perfect for this beginner
[08:18] strategy and to help you all out simple effects told me that they will give each and every one of you a $40 deposit bonus if you deposit at least $100 so deposit $100 on on to the platform to start trading and they will give you an extra
[08:32] $40 completely for free this makes it even more perfect because now you can times before you risk any of your own money so give them a try because I think you'll love it so that's it the strategy I wish I had when I first started out
[08:47] with trading and once you understand this simple strategy and are making consistent profits with it you can start looking at other strategies too that's why I made this video in which I break down four trading strategies that can
[08:59] down four trading strategies that can help any beginner make $500 per day so thanks for watching and I'll see you in the next video
⚡ Saved you 0h 09m reading this? Transcribe any YouTube video for free — no signup needed.



