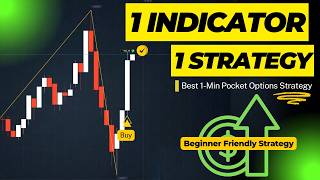

1-Minute ZigZag Strategy Explained
43sClear, actionable strategy promises high-probability trades, appealing to traders seeking simple edge.
▶ Play Clip"The title promises a strategy with live trades, wins and losses, and it delivers on that, but the content is padded with repetitive live trade examples and a heavy push for subscriptions."
This video presents a binary options trading strategy for the Pocket Option platform, using the ZigZag indicator on a 30-second chart with 1-minute expiry trades. The presenter demonstrates live trade setups, explains entry rules for buy and sell signals, and emphasizes risk management and discipline.
The strategy uses the ZigZag indicator on a 30-second chart with 1-minute expiry trades. It is presented as simple and clean, with clear rules for spotting setups.
Open Pocket Option, set time frame to 30 seconds, add ZigZag indicator with default settings. The indicator confirms past price action, not future predictions.
Buy when ZigZag is below candles (recent swing low) and one or two strong bullish candles form with solid bodies closing near the top, no long upper wick. Use 1-minute expiry.
Sell when ZigZag is above candles (recent swing high) and strong bearish candles form with solid bodies closing near the bottom, no long lower wick. Use 1-minute expiry.
Only take trades in the direction of a strong trend. Fighting a strong trend is a common mistake that drains balance.
High-impact news causes sharp spikes that ZigZag cannot handle. Check economic calendar and stay out during such events.
European and New York sessions offer higher volume and cleaner signals. Asian session often has choppy sideways movement causing false signals.
A free PDF guide is available in the description, covering the strategy and an entry checklist.
Price falling, ZigZag prints bottom, bullish candle forms. Buy trade placed, price moves up, trade closes in profit.
After a steep descent, ZigZag forms bottom, bullish candle confirms. Buy trade placed, strong upward move, profit.
After a peak, price bounces, ZigZag above, sell trade placed. Price continues upward, trade closes at a loss. Presenter emphasizes that losses are normal and discipline matters.
Presenter shows both wins and losses, stating that real learning happens from honest content. Encourages subscribing for similar content.
The ZigZag strategy is a simple, rule-based approach for short-term binary options trading, but it requires strict adherence to risk management rules and acceptance of losses as part of the process. The presenter emphasizes discipline and honesty over unrealistic win rates.
What time frame and expiry are used in this ZigZag strategy?
30-second chart with 1-minute expiry trades.
00:01
What does the ZigZag indicator do according to the video?
It confirms what price has already done, not predict future moves.
01:11
What are the two conditions for a buy setup?
ZigZag below candles (recent swing low) and strong bullish candle(s) with solid body closing near top, no long upper wick.
01:23
What are the two conditions for a sell setup?
ZigZag above candles (recent swing high) and strong bearish candle(s) with solid body closing near bottom, no long lower wick.
02:05
What is the first rule to protect your account?
Never trade against a strong trend; only trade in the direction of the trend.
02:35
Why should you avoid trading during major news events?
High-impact news creates sharp spikes that ZigZag cannot handle cleanly.
02:48
Which trading sessions are best for this strategy?
European and New York sessions.
03:12
What is the purpose of the free PDF guide?
It covers the strategy and includes a one-page entry checklist.
03:39
ZigZag Confirms, Not Predicts
Clarifies the indicator's role, preventing misuse and setting realistic expectations.
01:11Trend Direction Rule
A key risk management principle that can significantly reduce losses.
02:35News Event Avoidance
Highlights the importance of external factors in trading success.
02:48Losses Are Normal
Honest acknowledgment that losses occur, reinforcing the need for discipline.
08:27[00:01] consistently find high probability trades on Pocket Option? No complex setups, no confusing signals, just one tool and clear rules. Today, I'm showing you a zigzag strategy that I personally use on the 30-second chart with 1-minute
[00:17] expiry trades. It's simple, it's clean, and once you understand the logic, you'll start spotting these setups completely on your own. Stay till the end because I'm also revealing the two most common mistakes traders make with
[00:29] this strategy that silently kill their profits. But before we dive in, trading binary options carries real financial risk and losses are possible. Nothing in this video is financial advice. Always start on a demo account before putting
[00:43] in real money. Now, let's get into it. First, open your Pocket Option chart and set your time frame to 30 seconds. Now, go to the indicator section, search for zigzag, and add it with the default settings. Don't touch anything. The
[00:56] default values are already well-suited for short-term price action. Once added, the recent highs and lows of price across your chart. And here's something important to understand about this indicator. Zigzag doesn't predict where
[01:11] price is going next. It confirms what price has already done. That confirmation is exactly what makes it powerful for our entries. Now, let's talk about the buy setup. You're looking for two things happening together.
[01:23] First, the zigzag indicator is sitting below the candles, meaning price has just bounced from a recent swing low and the indicator has marked in that point. you see one or two strong bullish candles forming. Strong means a large
[01:37] solid body closing near the top of the candle with no long upper wick. When both of those line up at the same time, that's your buy entry with a 1-minute expiry. Look at this example on the chart right here. Zigzag is below, two
[01:50] clean green candles follow. That's the setup, simple and clear. The sell setup is the exact mirror of that. This time the zigzag indicator is positioned above the candles, meaning price has just rejected from a recent swing high. Then
[02:05] with solid bodies closing near the bottom. No long lower wicks. That's your sell signal. Same 1-minute expiry. See this example here. Zigzag above, strong red candles follow right after. Perfect
[02:20] textbook setup. Now let's talk about the two rules that will protect your account and make this strategy actually work long-term. Rule number one, never trade against a strong trend. If the market is aggressively pushing in one direction,
[02:35] you only take trades in that same direction. Fighting a strong trend back-to-back is the fastest way to drain your balance, and it's the mistake most beginners make repeatedly. Rule number two, stay out during major news events.
[02:48] High-impact news creates sudden sharp spikes that the zigzag simply cannot handle cleanly. Before you start any trading session, check your economic calendar. If a big event is approaching, close your charts and wait it out.
[03:00] Patience here saves your account. Just these two filters alone will cut out the majority of losing trades. One more thing before we get to the live strategy. The European session and the
[03:12] New York session are where this setup performs best. Volume is high, price signals are much cleaner and more reliable. you'll often see choppy sideways movement that generates false signals,
[03:26] so avoid those windows entirely. Now I've put together a free PDF guide for this strategy. Download link is in the description below. It covers everything we just went through, plus a one-page entry checklist you can keep
[03:39] you never second-guess a rule in the middle of a live setup. Go ahead and grab that now. Coming up next, I'm going to show you this exact setup triggering live on a real chart, candle by candle, so you can see precisely how I read the
[03:54] signal and place the trade. All right. Now, let's watch the strategy work in completely different from just hearing the rules. Look at this chart carefully. Price has been falling consistently, one bearish candle after another pushing
[04:07] lower. Then suddenly the zigzag indicator prints its bottom point right underneath the candles. That is the signal we have been waiting for. The low, meaning the recent selling pressure has hit a key point and price is showing
[04:20] its first sign of slowing down. Right at that zigzag bottom, a bullish candle begins to form, solid body closing with strength. now met. Zigzag below, strong candle confirming.
[04:36] The buy trade is placed immediately. After the entry candle closes, price pushes upward cleanly. Another strong bullish candle forms, no hesitation, no The market is moving exactly in the direction we anticipated from the zigzag
[04:52] signal. The timer is counting down and price is holding above our entry point comfortably. This is what patience looks like in trading. You follow the rules, you place the trade, and then you let the strategy do its job. The expiry hits
[05:06] and the trade closes in profit. Now, let's keep the charts open and find another perfect trade setup as per our strategy rules because the more setups you watch in real time, the sharper your eye becomes. Let's go. Here's the next
[05:21] setup and this one is particularly interesting because at first glance, you might think this is the wrong moment to place a buy trade. Price has been falling heavily. The zigzag has printed a massive peak followed by a long steep
[05:35] descent. Sellers were clearly in control for an extended period, but look very carefully at what is happening on the right side of the chart right now. The zigzag is forming its bottom point directly below the candles. That is the
[05:47] indicator doing exactly what we discussed, locking in a confirmed swing low after a sustained move down. And right at that bottom, a bullish candle starts forming with a solid body and clear buying pressure. Both conditions
[05:59] are met. Zigzag below. Strong candle confirming. The buy trade goes in immediately. Now, watch how price responds after entry, because this is where the setup really speaks for itself. The moment the trade
[06:13] goes live, a strong white candle pushes sharply upward. No hesitation. No slow grind. Price moves with clear momentum away from that zigzag bottom point, and the trade is comfortably in profit with the timer still running. This is the
[06:28] kind of reaction you want to see after a zigzag bottom confirmation, a fast, clean move in your direction. The market had been falling for so long that when buyers finally stepped in at that swing low, the bounce was sharp and decisive.
[06:42] The timer is counting down, and everything is moving exactly as planned. everything is moving exactly as planned. Expiry hits. Trade closed. Green badge, profit confirmed. Now, let's keep the charts open and find another perfect
[06:54] trade setup as per our strategy rules, because the more setups you watch in real time, the sharper your eye becomes. Let's go. Here's the next setup. And because at first glance, looking at the left side of the chart, you might think
[07:08] this is the wrong moment to place a buy trade. Price has been falling heavily. The zigzag has printed a massive peak followed by a long steep descent. Sellers were clearly in control for an extended period, but look very carefully
[07:20] of the chart right now. The zigzag is forming its bottom point directly below the candles. That is the indicator doing exactly what we discussed, locking in a confirmed swing low after a sustained move down. And right at that bottom, a
[07:34] bullish candle starts forming with a solid body and clear buying pressure. Both conditions are met. Zigzag below. Strong candle confirming. The buy trade goes in immediately. Now, watch how price responds after
[07:48] entry because this is where the setup really speaks for itself. The moment the trade goes live, a strong white candle pushes sharply upward. No hesitation. No slow grind. Price moves with clear momentum away from that zigzag bottom
[08:02] point and the trade is comfortably in profit with the timer still running. profit with the timer still running. Expiry hits. Trade closed. Green badge. Profit confirmed. Now, let's keep the charts open and find another perfect
[08:14] trade setup as per our strategy rules because the more setups you watch in real time, the sharper your eye becomes. Let's go. All right. Same chart, different setup. And this one I want you to watch very carefully because it
[08:27] teaches you something equally important as a winning trade. Look at the right side of the chart. Price has just come off a massive zigzag peak and crashed down sharply. But then something happens. Price starts
[08:39] bouncing back up with strong white candles pushing higher. Now, the zigzag peak is sitting above. The overall structure is still bearish running out of steam. The conditions appear to align for a
[08:52] sell. Zigzag above from the recent peak and the bounce showing signs of slowing. The sell trade is placed. there. The trade goes live and immediately you
[09:05] can feel the tension on this chart. Instead of rolling back down the way we anticipated, price keeps pushing upward with momentum. Those white bullish candles are not stopping. They are continuing to climb aggressively against
[09:17] our sell position. The market is telling us something different from what we read at entry. Trade closed. This one went against us, a loss. And I'm showing you this on purpose because anyone who tells you every trade wins is not being honest
[09:30] with you. Losses are a normal part of this strategy, a normal part of any strategy, and a normal part of every trader's journey. What matters is not the single trade. What matters is that you followed the rules, read the chart
[09:43] correctly, and did not break your own discipline. That is what separates traders who last from traders who quit. Take a step back after a loss, review the setup, and come back stronger on the next one. If you watched this entire
[09:55] video, I appreciate you. Most people skip past the losses and only share wins. We show you everything here because that is how real learning happens. If this kind of honest trading content is what you have been looking
[10:07] for, hit the subscribe button right now and turn on notifications because every video on this channel is built exactly like this one. Real trades, real results, wins and losses both. I will see you in the next one.




⚡ Saved you 0h 10m reading this? Transcribe any YouTube video for free — no signup needed.