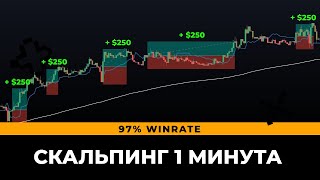

97% Winrate Scalping Strategy Revealed
44sThe high winrate claim and promise of a simple strategy hooks viewers looking for quick profits.
▶ Play Clip"Title promises a scalping strategy with 30 trades a day, and the video delivers exactly that with clear rules and examples."
This video presents a scalping trading strategy using three indicators (STC, 200 EMA, and Trend Trader) to identify entry points in trending markets. The strategy aims to capture quick profits by entering at the bottom of pullbacks within the trend, with a low risk-reward ratio.
Scalping involves holding positions for a few minutes, suitable for beginners to learn markets and grow small capital. The strategy can open up to 30 positions a day.
The strategy uses STC indicator (replaces traditional stochastic), 200-period exponential moving average (EMA), and Trend Trader indicator (similar to candle Heikin Ashi).
Price above 200 EMA indicates uptrend; price below indicates downtrend. Only trade in the direction of the trend.
Shows trend direction: movement below blue line turns red (bearish), above turns green (bullish). Helps see trend within trend.
Rule 1: Price above EMA (uptrend). Rule 2: Wait for a pullback (fall). Rule 3: Price closes above Trend Trader (green candle). Rule 4: STC turns green. Then open buy.
Price above EMA, pullback occurs, green candle closes above Trend Trader, STC turns green → buy entry.
Use low risk-reward ratio (e.g., 1:1). Place stop loss below last low, take profit at same distance. Example: $250 risk per trade.
Same strategy in reverse: price below EMA, wait for a rise, red candle closes below Trend Trader, STC turns red → sell entry.
In 2.5 hours, 4 good positions. With $250 risk per trade, earned $1000. Avoid sideways markets.
This scalping strategy provides a systematic approach to trading pullbacks in trending markets using three indicators. It emphasizes discipline, risk management, and avoiding sideways price action.
What are the three indicators used in this scalping strategy?
STC indicator, 200-period exponential moving average (EMA), and Trend Trader indicator.
00:46
What does the STC indicator replace?
It replaces the traditional stochastic indicator.
01:24
How do you identify an uptrend using the 200 EMA?
If the price moves above the 200 EMA, it is an uptrend.
01:56
What are the four rules for opening a buy position in an uptrend?
1. Price above EMA. 2. Wait for a pullback (fall). 3. Green candle closes above Trend Trader. 4. STC turns green.
02:55
What is the recommended risk-reward ratio for this scalping strategy?
A low risk-reward ratio, e.g., 1:1.
06:10
How do you set stop loss and take profit for a buy position?
Place stop loss below the last low and take profit at the same distance (1:1 ratio).
06:26
What should you avoid when using this strategy?
Avoid trading during sideways price movement.
09:47
How many positions can this strategy open in a day?
Up to 30 positions a day.
00:28
What is the Trend Trader indicator compared to?
It is compared to a Heikin Ashi candle.
02:13
In the example, how much was risked per trade and what was the profit in 2.5 hours?
$250 risk per trade, $1000 profit in 2.5 hours.
09:18
Scalping for Beginners
Highlights that scalping helps beginners learn markets and grow small capital.
00:01Four Rules System
Provides a clear, rule-based approach to entry, reducing emotional trading.
02:55Low Risk-Reward Ratio
Emphasizes using 1:1 risk-reward, which is unconventional but suits scalping's high win rate.
06:10Avoid Sideways Markets
Crucial advice to prevent losses during non-trending periods.
09:47[00:01] Scalping trading strategies are widely used, positions that you hold for only a few minutes and then sell them again. a few minutes and then sell them again.
[00:14] useful for beginner traders because this way of trading allows them to get acquainted with the financial markets and increase a small capital. In today's video, I will tell you about a strategy that allows you to open up to
[00:28] 30 positions a day, so this is a strategy for real so this is a strategy for real day traders
[00:46] in this strategy, we use three indicators, let's add them at once, the first indicator we add is the STC indicator, the second indicator is the um-hey or
[01:00] exponential moving average, the third and last indicator we strategy, let's set up the indicator and email,
[01:12] click settings, change the length to 200, answer, make it white. like this. To begin with, it is useful to know what we
[01:24] will use each indicator for, let's start with the STC indicator, we will use this indicator as a replacement for the traditional indicator, and where, as you probably already know, is attrition, where the
[01:39] movement of the line from the top is a signal to sell, about the movement from the bottom to buy, the Stacy indicator makes it easier by simply showing green or red buy or sell line to see the trend we use the moving average indicator
[01:56] very simply if the price moves above the moving average then we are moving in an uptrend and if the price moves below the moving average then the price is moving in a downtrend then we have the trend trading indicator
[02:13] it gives us even more clarity about the direction of the trend you can compare this indicator with a candle high crane cash as you can see movement below the blue line turns red and movement
[02:27] above the blue line turns green thus we can easily see thus we can easily see the trend within the trend as you know the price never moves up or down in a straight line
[02:40] the price always moves in waves the goal of this strategy is to find the bottom of such a wave and act accordingly thus we are looking for the exact bottom the work of this strategy is divided into four rules
[02:55] now I will explain all the rules step by step then I will show you practical examples rule 1 we want to know where the price is moving relative to the MA
[03:08] Here on the chart you can clearly see that the price is moving at a higher M.A. So we can talk about an uptrend, we always open only buy positions during a rising trend. Rule 2:
[03:24] To find the bottom, you first need to see a fall. That is, we want the price to fall when it is generally moving in an uptrend. Therefore, rule 2 says, wait for a fall. Rule 3:
[03:39] To be able to talk about a day, we want the price to rise above the trend trader indicator again. That is why the red candles should turn That is why the red candles should turn green again. The last line is line 4.
[03:54] In this line, we look at the tesi indicator. green. As soon as it turns green, we can open a buy position. Therefore, always wait for the green line on the
[04:08] tessi indicator. Now, let's look at practice. look at practice. We see that the price is moving higher. Therefore, we begin to look for a buy position.
[04:23] that together form a slight decline. Therefore, we are now waiting for the green candle to close above the trend trader indicator. This happens here. Finally, we are now
[04:36] waiting for the green tessi line. This also happens. Now we can place a buy position.
[04:48] following minutes. I often see comments under my videos from people. Interested in where is the best place to open a position and which platform is best for trading cryptocurrency? I always trade on the Babbitt exchange.
[05:03] I do this because it is a clear and professional crypto platform where you can easily place buy and sell positions. In addition, I always use leverage to be able to make a profit faster.
[05:17] to be able to make a profit faster. your positions 100 times faster, but you can also lose 100 times faster. Therefore, only use this feature
[05:30] if you are using a good strategy. I also use this s4 scheme with us to easily track multiple quotes. It is quotes. It is very useful if you are a day trader.
[05:43] In short, Babbitt is a good and reliable crypto exchange for trading. Do reliable crypto exchange for trading. Do you also want to trade on this exchange? Then you are in luck because Babbitt provides a one-time
[05:56] deposit bonus of up to three thousand dollars. You can visit Babbitt using the link in the description. Let's quickly return to the scalping strategy. The strategy is essentially getting as much profit as possible in the shortest
[06:10] possible period of time. In other words, you want to make money as quickly as possible. Therefore, in this strategy, you can stick to a low risk-reward ratio.
[06:26] In this example, I will Maintain a risk slash reward ratio of 1, this means that I lose as much as I can win. I place a stop loss below the last low and place a take profit target at the
[06:40] same level. After 1 hour, the position closed with a profit slightly lower in price. We can reopen the position. The price is still moving higher than the emoi and we see a fall with red candles.
[06:54] Then we see a breakout with a green candle. The indicator with the tise turns green and the position grows again. After opening a buy position, as you can see, it is
[07:06] not necessary for the indicator line and the tise line to move down. The line can also turn green at the top.
[07:18] downtrend. This strategy obviously also works in a downtrend. You can make money by placing sell positions. make money by placing sell positions.
[07:32] because this strategy can be executed in a downtrend and an uptrend. You can trade every day in a downtrend. The strategy also works only in the opposite direction. At the beginning, we want to see the price
[07:47] move below the emoi, then we want to see a small increase and then a red candle closing below the trend indicator. Trogir then the bone indicator should turn red
[08:01] very simple on the left side of the screen we see the first trade we see several green candles after which the red candle closes below the Trogir trend indicator if we now look at the
[08:16] Stessie indicators it also turned red now we can open a position now I place my stop loss above the last maximum and the take profit target at the same level this position was closed within 2
[08:32] minutes then we see another small rise and the red candle closes below the indicator then the Stessie indicator turns red and we can open a sell position
[08:49] this position was also closed within 2 minutes we see a small rise followed by a red candle now the indicator with the tise turns red and we can open positions
[09:06] this position lasted a little longer about half an hour just
[09:18] this position was closed again within 8 minutes in two and a half hours we got 4 good positions personally I always risk 250 dollars on one position
[09:32] this means that in two and a half hours I earned 1000 dollars using this strategy keep in mind that There may be periods when the price moves sideways, as here, during such a period you should not trade.
[09:47] This is due to the fact that the price does not move in a clear trend, which can lead to the loss of several positions in a row. Therefore, avoid sideways price movement. If you do not have the time or desire to analyze prices throughout the day,
[10:04] then you can use our premium subscription. We will monitor prices throughout the day and let you know when we find a moment to enter. The only thing you will need to do
[10:17] is open a position on Babbitt. Do not make money with us, then you will get your money back. More detailed information can be found on our website. I want to thank you for watching and I look forward to
[10:33] seeing you next week.
⚡ Saved you 0h 10m reading this? Transcribe any YouTube video for free — no signup needed.