
I Made 14R in 2 Trades (Proof)
51sReal trade results with high R-multiples immediately grab attention and establish credibility.
▶ Play Clip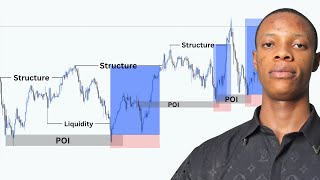
"The title promises a complete course, and the video delivers a thorough breakdown of SMC, though it includes promotional segments and some repetition."
This video is a comprehensive trading course on the Smart Money Concepts (SMC) strategy, focusing on structure, liquidity, and Points of Interest (POI). The instructor, Godswill from Day Trading Geek, explains how to trade like institutional traders by identifying market trends, liquidity pools, and optimal entry zones. The course is designed for beginners and aims to provide a complete framework for executing trades with a high reward-to-risk ratio.
The instructor shows several trades, including a 10R and multiple 4R trades, to demonstrate the strategy's effectiveness.
The strategy is called Smart Money Concepts (SMC), which helps traders mimic institutional trading behavior, buying at demand zones and selling at supply zones.
The strategy uses three main components: structure (trend), liquidity (fuel for moves), and POI (point of entry).
Structure refers to the market trend: bullish (uptrend) or bearish (downtrend). Traders should look for buys in bullish markets and sells in bearish markets.
A BOS is a break above a high or below a low, indicating trend continuation. It must be a break with a full candle body to be valid; a wick break is considered a sweep.
A CHoCH is a sign of reversal, the first break against the prevailing trend. It should occur at a key reversal zone and be validated by a BOS.
Liquidity is money in the market, including orders and stop-losses. The market seeks liquidity to fuel moves, often taking out stop-losses before continuing.
The instructor identifies three liquidity scenarios: first pullback after BOS, internal pullback before BOS, and engineered liquidity (a false move to trap traders).
POI is the entry zone. The instructor uses two types: order blocks (last opposite candle before a move) and breaker blocks (failed order blocks).
An order block is valid if it has a BOS and liquidity protecting it. Without these, the zone is likely to fail.
The instructor uses a top-down approach, starting from higher timeframes (daily, 4H, 2H) to identify key levels, then moving to lower timeframes (1H, 30M, 15M) for entry.
On higher timeframes, the instructor marks key levels (often long weeks) as potential reversal zones or targets, helping to anticipate price movements.
Trades are taken when all criteria align: BOS/CHoCH, liquidity, and a valid POI. Stop-loss is placed slightly below/above the POI, and targets are set at the next BOS.
After a trade, the trader should mark new levels and continue looking for opportunities in the direction of the trend.
The video provides a complete SMC trading framework, emphasizing the importance of structure, liquidity, and POI. By following the top-down analysis and validating entries with BOS and liquidity, traders can replicate the strategy for consistent results.
SMC Strategy Introduction
Establishes the core framework of the course, emphasizing institutional trading.
01:19Break of Structure Definition
Provides a clear, actionable definition of BOS, a fundamental concept for trend identification.
04:25Liquidity as Market Fuel
Explains why the market hunts liquidity, a key insight for understanding price movements.
12:15POI: Order Blocks and Breaker Blocks
Details the two types of entry zones, giving traders specific levels to watch.
22:09Top-Down Analysis Approach
Outlines a systematic method for analyzing multiple timeframes, improving trade accuracy.
34:23[00:02] This very trade gave me 10 arrow. Now this was when I had the opportunity when I had the setup. Now this is another buy I took. This other buy gave me 4 arrow.
[00:15] And this was when I had the buy opportunity right here. Now if you watch this second trade now was dropped in this very group where I said that your this very group where I said that your entry is kind of risky. I prefer the BB.
[00:27] Now these are other trades I took. This is a buy I tried taking. This buy went against me of which you know strategy does not work 100% of the time. So this very one did not go as I was expecting. Now this another buy I took. This very
[00:41] trade now gave me four arrow arrow and this another buy I took. This other buy gave me four arrow arrow. In this very video I'm going to teach you guys a complete structure liquidity POI trading course. Right. People pay thousands of
[00:53] dollars for this type of video but I'm going to teach you guys for 100% free. I'm going to give you the beginner aspect to a point where I now execute trade what I look out for in taking trade everything right once you are done
[01:06] watching this very video you'll go back to your chart replicate it and you're going to see similar results so I'm not going to waste time let me begin now the strategy I use is called the SMC
[01:19] is called the SMC which is the smart money concept many of which is the smart money concept many of you already know that the SMC Right? The smart money concept. Now what this strategy helps you do is it helps
[01:31] you trade like the institutional traders. It helps you trade like the traders. It helps you trade like the banks. Now remember this in nature a lower price and they want to sell at a supply zone. They want to sell at a
[01:46] supply zone. They want to sell at a higher price and you know they need Now I'm going to explain everything so you can easily understand it. Now these are the three things I use with this SMC. SMC is wide. We have a lot of
[02:01] things with this smart money concept. We have your fair value gap, mitigated very strategy. But these are the three things I use. It's very simple. The first one is the structure and this structure now is just the trend to know
[02:18] what direction the market is trading on. So that's the trend. Then the second one is liquidity which liquidity is going to help fuel the move. I'm going to explain it. Then the third one is the POI. This PI now is my point of interest, right?
[02:32] My point of entry. Those zones where I'll be taking the trade from, where I'll be taking the buy from, where I'll be taking the sale from. Now the very first one which is structure like I said is a trend. the trend of the
[02:47] like I said is a trend. the trend of the market and in knowing the trend or overall the trend we have two two main trends the bullish trend and the bearish trend these are the ones I trade we have three trends in the market the bullish
[03:02] bearish and the consolidating market but these are the only two I trade I show the bullish and the bearish market so bullish market now helps me know okay this market is trading going up right and I meant to keep looking out for buys
[03:16] I'm meant to keep looking out for buys on this very market. Then bearish market now shows this market is going down. I'm meant to keep looking out for sells on this very market. So with this I'm able to know okay if I'm on this chart and I
[03:29] meant to look out for buys or I meant to look out for sells. Now how do I know that a market is bullish or a market is bearish? Now like I said bullish now is when it's going up price trailing up. Gold has been going
[03:42] up for over a month. Meaning gold was bullish at that very period. It was going up. It was creating a higher price. Let me show you on the chart. Now if you watch this trade I took now where buys and if you
[03:55] watch this market now was going up because it got here it retrace. It again retrace. It created a higher price. It got there now retrace. It's currently now about to create a higher price. So showing that it's creating
[04:09] higher prices. Price is going up. At the time of me recording this very um video, time of me recording this very um video, gold is over $4,000 about $4,17, gold's price is going higher. Bullish. Now, how do I know that this market is
[04:25] out for buys. I'll be looking out for sells. I personally use the break of structure. Now Bos now break of structure is a Now Bos now break of structure is a break above a high or below a low.
[04:42] Notice this. This is a high a point where price got to I just want to use it chart and I show you it pointed the price got to then on coming back up it broke above it. Price got there the first time came back down. On going back
[04:58] up it broke above it. That's a high price broke above. Same thing. It has another high coming back breaking above it. That break is a break of structure. So I indicate it with my trend line mark it out as my B where the price broke.
[05:12] Now this is a high and the price broke above it. But in a case where is now breaking to the downside. This is a low and it broke below it. This now a break to the downside showing that this market is bearish and meant to look out for
[05:26] sells. This is another low and the price broke below it. So this breakout that breaks to downside. Now this the chart right here. This was a high. Price had this very high right here.
[05:39] What happened? It broke above it. That's a break of structure to the upside. Then if you watch price had this other high right here. Price broke above it. That's what is this showing you? That this market is bullish and creating higher
[05:55] prices. It's creating higher price. And what do you expect? This is another high retracing. It's currently going up and you expect it to break above it again as a break of structure to the upside. So this market now is bullish. It's
[06:09] bearish is going to be break to the downside just like that. Now what's going to make a breakup structure valid? What's going to validate break of structure? Not all breaks are valid, right? What's going to make it valid?
[06:22] Now we have only one thing that's going to make a break of structure valid. That's going to make break not valid or valid. First one, it should be
[06:35] a break with a full candle body. Now, it should be a break with a full candle body. Now, what this means is if
[06:48] you're going to consider any level as a breakup structure, you should break it with a full candle body. Like this very example, price having this high, it came down on going back up, it broke past it to a full candle body.
[07:04] In a scenario where it broke past it with a week, where it breaks past it with a week, let me find an example where it breaks past it with a week. That's not a valid breakoff structure like this very example right here. Price
[07:18] had this um low. This is a low. It pointed the price got past it. You can see how it broke past that very low a low price went up coming
[07:30] back then it broke past it. This is not a break of structure because this is a long week that broke past it. This is what we call sweep and this price is using it to hunt for liquidity to generate liquidity. So this is what we
[07:42] breakoff structure. That's the only thing that's going to make a breakoff structure not valid. Now that's all for breakoff structure. That's going to help me know the trend or what I will be doing in the market. If I be looking out
[07:56] for buys or I'll be looking out for sell good when it was bullish it was breaking strong to the upside. It had this high. What happened? It broke past it to the upside. That's a B. Now with this I'm able to know I'm meant
[08:10] That's another high. It's broke past to the upside. That's another B. But at downside of which most of them are not valid. Right? Most of them they are sweeps for you to continue the buy which I'm going to still explain later on. Now
[08:25] so those are break of structure showing that this market is bullish. Then the second is a change of character. Change of character now is a sign of reversal. A sign that this market is now changing from maybe bullish to become bearish or
[08:42] bearish to become bullish. You know on the normal since the price has created a higher price it's meant to come down lower to a point maybe here then go up to break and then create another higher price. But now if it now goes down and
[08:56] then break this very low this now what you call a change of character. Now why of structure. But since it's the first time the price is doing it, the price the first time is breaking to the downside. That's what we consider as a
[09:11] change of character, right? A shift. Some are going to call it a shift in market structure, right? But me, I call it change of character. first time is doing the opposite of what it has been doing. It has break to the
[09:25] upside, but this is the first time it's break to the downside. Same thing. If this price goes up now and break to the upside now, that's a change of character because the first time is doing it. Now if you watch go the change of character
[09:38] at this very zone right here. What happened? It had this break of structure to the upside right there. And if you watch it t this break to the downside validating a change of character. You can see that
[09:51] because it's the first time it's doing it. And did that what now happened? Go I lost this very trade. I was just trying to buy but what happened? Started going down. If you notice, it didn't break that high
[10:05] It's now breaking to the downside. Another low. Price broke past it just like that. Now, what's going to make a change of character valid? There are only two things I consider. The very first thing I consider is it
[10:21] should have a B. meaning you're going to need a B to validate a change of character. Then the second thing I consider is that it should happen at a key
[10:36] reversal zone. consider. First thing you should have a break of this what that means. If you're of character which is the first time it's doing it break to the downside now
[10:51] the upside. You want to watch and then see that it's first broke to the this way in a simple way you're going to understand it. It should break structure downside and break to the upside. So validating a change of character just
[11:08] like that. Now the second thing it should happen at a key level or at a key reversal zone. I can't just go to the market and then start saying price has given a change of character. Notice when I started buying notice why I started
[11:21] taking this very buy. I started taking this very buy market was bearish. You can see it's break to the downside. Another break of shot to the downside from this very low right here. This is the lowest point it got. That's another
[11:33] break of structure. Then it breaks to the downside. Right. But on getting to this very point, this was a possible a key reversal zone, a key zone that
[11:47] for a buy. It's a demand zone. So on getting there, what happened? It gave a started looking out for buys. If you notice, it was going down. I meant to look out for sells. But now, since it gave a change of character at this very
[12:02] zone, I started looking out for buys. I took my first buy. I took my second buy. third buy. Why? Because it has gotten here. It has a possible reversal. So there are two things that's going to make a change of character value. So
[12:15] strategy. Now let's move on to the second thing which is liquidity. Liquidity is money within the market. Now if you are in a trade, right, you take a trade and that trade goes in your favor.
[12:31] You make money. You need to take profit now and you make money on that very market. You are taking liquidity out of that very market. That money you made is out of that very market. Same thing if that trade goes against you and you hit
[12:45] stop loss you are providing liquidity for that very market. So liquidity is for that very market. So liquidity is money within the market. Orders and stop-loss are the liquidity, right? Which orders you enter a position, you
[12:58] enter a trade, your money is now into the market. If the money is still in your trading broker, you didn't take any trade, it's still your available equity. as you are now in a trade, that your money automatically is now a liquidity
[13:12] available to the market. Now, if the trade goes against you, hit your stop loss, you're going to lose money. And liquidity is all the market wants. These Liquidity is all the market want. And our stop loss as SL if you lose money
[13:31] you're going to provide liquidity for the market. And that liquidity you many of you going to ask why is it needed? Why does the market want to look for look out for our liquidity? Why does the market want us to hit stop loss? And
[13:43] this is the reason. Now for each to get involved they need liquidity. They need money. They need sufficient pool of liquidity in the market. Liquidity is trade now they're going to enter with a large capital. So for them to get
[13:58] enough money in the market so they can get involved. Just similar you want to buy something you're going to need a quantity available you want to buy, right? So that's just what it is. So, if they want to open a position on gold
[14:12] now, maybe 10,000 units position, right, using 10,000 lots, they're going to need So, what are they going to do? They're going to first stop traders out. And
[14:24] what happened? This was a nice zone. This was a nice zone. Traders are going to buy from. But once they buy from there, they're going to have once they buy from, they going to have their stop loss below the price. They're
[14:38] price and they can see let me take my profit right here. Automatically on getting there the orders have been filled but now there was no enough liquidity to push the price up from that very zone. So what happened? Price had
[14:51] to take out that zone first on taking out that zone. Now those got stopped out. If you yourself you tried buying from here you have a stop loss here to also get stopped out and now you've provided liquidity for the market
[15:04] and what will happen the price will start buying from this next zone. Why? Because liquidity has now begotten can now get involved at the nearest POI at the nearest buy zone. This was the first buy zone but the price did not buy
[15:18] from here because there was no liquidity on getting the liquidity. Now the price on getting the liquidity. Now the price will now buy from the nearest buy zone. Now our stop loss which you already saw that
[15:30] is liquidity. These are two um three liquidity I use. Three liquidity three things you can easily watch out for. Just see these three things just you need one of them but these are three case scenario what I
[15:42] watch out for just watch out for just one and you you use it. So let me replicate it with the pattern then I'll go to the chart and show you. Now the go to the chart and show you. Now the first one is the first pullback after
[15:54] breakoff structure. You know B I said it was a breakoff structure. Now what this means is the price going to goes up right? go up, come down. It's going to That's a break of structure. On breaking that structure, the first time the price
[16:10] Automatically, that retracement is going to act as liquidity. This is the first buy zone. Then this is a second buy zone which demand zone. Those who trade support inance, this is a support zone. I'm
[16:25] going to explain it is the third thing with the strategy. But in this case now price had this break of structure. second break of structure. This first zone I was now used as liquidity for this second zone. Why? Because market
[16:37] need liquidity. So price is going to take out this first zone. They respect this other zone. So automatically this first pullback the first retracement the price going to do after that break structure is a liquidity with this very
[16:52] strategy. So if you are watching that to take a trade, you want to check if you and you know if you have the liquidity you're going to need to stop and then at not being the liquidity. Now look at a nice example. Price had this break of
[17:08] structure. Immediately it broke this structure. Now automatically it this retracement came back down then continually buy automatically this retracement now is now a liquidity and unless this retracement have its own
[17:21] liquidity it's not valid. It's going to act as a liquidity protecting this lower act as a liquidity protecting this lower zone. So this not an inducement then this is the valid zone to buy from. So this are the first pullback. The second
[17:35] case scenario is a internal pullback. In this case, it won't break structure is a break of structure. It was after the break of that it created the liquidity. But in this second case, which is the second one, the second is
[17:51] the internal pullback before a boss. Now before it breaks structure and it's going to have the pullback, it's going to have the retracement like this, right? before it eventually got to the break. This is a high price came down on
[18:06] going up it had this retracement then break structure. So automatically this low now is acting as liquidity protecting this very second buy zone because here we also have two buy zone which is this demand zone
[18:20] right and this second lower demand zone but this first one will not be respected because it does not have its own liquidity. If it had its own low, a low like this, then it's going to be valid just like that.
[18:33] And this was one of the one I used for this very buy. This was the one I used for this very bar right here.
[18:49] price break structure, it had the retracement. It had this it had the liquidity before it broke structure. Now this is a a sell right now. It had this other low break of structure to the downside. But before it eventually went
[19:04] down to break structure, it had this retracement push up. This retracement now acted as liquidity before it finally broke structure. That retracement acted as liquidity protecting this very sell zone. So I'm coming back up. Started
[19:18] dropping. Now this other buy I took. Notice this liquidity I used. Now this very high break structure. It had this retracement this pullback automatically acted as liquidity protecting this my buy zone. So that was
[19:32] I call this very bad. I'm going to show you everything. Then the third liquidity you everything. Then the third liquidity we have is the engineered liquidity.
[19:46] engineered liquidity. And in this case this is what happens. Many of you know Right? In this case this is what happen. The price going to have a high then retrace then break structure but break after breaking structure does not have
[19:59] any pullback. It didn't have any other internal pullback. It didn't have any frost pullback. But coming close it's going to create a low go up take out that low then I'm buying. So this low it created
[20:12] now is an engineered liquidity. This very low right here. Why? Because it's very low right here. Why? Because it's going to make traders jump in, right? It's going to create an illusion that's going to make traders jump in. And this
[20:26] is a nice example on how I cut with this very trade. Now watch this closely on very trade. Now watch this closely on coming close to my POI. liquidity on coming close to my POI. It got here. This was the PO I was using.
[20:41] It didn't get there. It didn't tap on the POI, but it came close and went up. character. So traders, you start thinking this market is going to has left. this price has left us then it will start going up and they will start
[20:54] jumping on buy and having their stop loss below this very low and what tends to happen the price will go down take them out before it to eventually start liquidity why because there's no frost pullback there's no internal pullback
[21:08] pullback there's no internal pullback protecting the zone the buy zone so protecting the zone the buy zone so price had to engineered how to engineer liquidity to take traders out then started buying Now those are the
[21:21] three liquidity. Now what's going to make liquidity valid or what's going to trade? There's only one thing I look out for. There's only one thing that makes my liquidity valid. The only thing is is that it should
[21:40] be close to your entry. Should be close to your POI. should be close to your entry. You know, POI and entry, they mean similar thing,
[21:54] right? POI, like I said before, is your point of entry, point where you likely take your trade from. So, the liquidity should be close to your POI, which brings us to the third thing with this very strategy, which is the POI. POI is
[22:09] an extremely important aspect of this very strategy. Why? Because is now your point of interest. Literally, your point of entry where you enter the trade. Now the first two things you know okay this market is bullish I met to look out for
[22:23] market is bullish I met to look out for buys then okay all of these lows now has liquidity all of these eyes has liquidity but where will I now enter this trade from where will I now set my buy limits or set my sell limit on they
[22:36] are now the POI and there are two POIs I use these are the only two POIs I use the very first one is the order block I don't know if you have heard of what order block is order block is where we have large resting orders where
[22:52] incidents are waiting to take their trade. Then secondly there are also levels where institutional traders has previously executed their trade where they have previously entered the market. Now generally order block is the last
[23:07] opposite candle before an opposite move and this is what that means. nice example. Price was going down at this very zone.
[23:23] Price had this sell on going down. It got here. What happened? Continually buy. So the other block right here now is the last bearish candle before the bullish move. Just take it this way. Like I said, the last opposite candle.
[23:37] going to be this black candle. My chart is black and blue. on your own chart, it's going to be the last red candle before I started showing green candle, right? So the last opposite candle is the order block. So we do mark it out
[23:52] with a right angle too. So this is the other block right here. And this is now a zone where I'll be buying from a buy zone. Now long weeks, right? You can as well mark out long
[24:06] weeks and those long weeks can as well be your other blocks. Let me show you be your other blocks. Let me show you and let me write it out in bracket and let me write it out in bracket comma long weeks can be
[24:21] comma long weeks can be order blocks can be your OB. a long week in a case where you have long weeks like this very one now this
[24:33] is a long week and this very long week now I can indicate it from the very beginning of the week to the point where the week stopped I can mark it out as my other block. So this long week can as well act as other block long week not
[24:46] tiny weeks. This very one is a tiny week and I can mark it out. Now long week, you can't say it need to be a bullish or a bearish long week. As far as a long week, this another long week right here is an order block. Right? This is not a
[25:01] long week. I can't mark this out as an order block. This is a long week. I can mark this out as an order block. Now, this is a long week. There are multiple weeks. Now, I can mark it out as an order block. So, this long week can act
[25:13] order block. So, this long week can act as order blocks. Right now, are two ways you can mark other block. Other block they are generally the last mark out an order block right here is going to be this black candle right here
[25:29] for generally what other block is. But this long week and now is the order block in this very case. Why? Because on a lower time frame this long week is an actual order block. I'm on a 15 minutes time. If I go to 5 minutes time frame,
[25:43] if I indicate this very zone now and I go to a 5 minutes time frame, this can go to a 5 minutes time frame, this can easily show that it's a black candle, candle and you can see that clearly right there. So this was the point and
[25:56] a 15 minutes but on a 5 minute time frame now is an actual black candle. So obviously an order block but the higher time frame it was showing a long week
[26:09] which those long week now they are as well order blocks. Now like I said other blocks that last opposite candle before an opposite move and that's how we mark it out can mark out the long as an order block or can mark out if there's no long
[26:24] generally we mark out the last opposite candle right there. And if you watch all of this trade I took this very buy I took this very buy I took I took it from it. If you notice what I marked out, this very last blue candle, it was for a
[26:38] sell. But since the sale failed, it was now for a buy, right? If you notice other buy that happened, it was from this very other block right here. Notice the price was going down on going down, getting to this very other block,
[26:52] very buy I took right here, what did I mark out? This very long week below the price. This was what I marked out. Then I used it to take my buy, right? All rested now, it was this very long week right here. So, long week can act as
[27:06] order block in a case where there is no clear order block. Then the second PI I use is the breaker block. I heard I believe you heard me mentioning breakout block. Now breakout block are failed order block. Just the same way your
[27:21] support fails, turn it to resistance or your um demand fails, turn it to supply. That same way block can still fail. Once they fail now automatically they are now example. This the last blue candle before price
[27:37] up price just came back up and broke out. Did not respect it. So coming back there it was now a valid zone to buy from. So I took my buy and watch price just respected it and went up. Now you can't just mark out other blocks and
[27:53] then you start jumping on trades, right? There are things that going to make an order block valid, right? There are two things that's going to make an order block valid. First thing is that it should
[28:08] thing is that it should have a B. have a B. Then the second thing is that it should have liquidity
[28:23] liquidity protecting it. two things are not present meaning that other block is not a valid zone to buy from. Now if you watch with the whole strategy now they combine each other but
[28:38] they work hand in hand. Now first I marked out this other this breakout block for my entry to buy from. I want to buy from this very breakout block. Then if you watch this breaker block has this high and it's broke past it. That's
[28:52] telling me? That this market is bullish. And if you watch, we have another high. here. Price also broke past it. That's another break of showing that this market is bullish. I meant to look out for buys. Then if you watch
[29:08] this low acted as liquidity, the three things are now complete. First bullish. Break of structure. Break of structure. Break of structure.
[29:20] immediately broke this structure. This was the first retracement it did. This down. I think that's liquidity. Then I take the buy from the breakout block. I took my buy. Price went up straight up to take profit right now. Why? Because
[29:36] market is bullish. There's liquidity and my point of interest breaker block. You can see the strategy is working together. Those are three things I need. Now for other block to be valley should have a break of structure. If I'm going
[29:51] to mark out any order block to take my buy from it should lead it should push the price up to a break of structure. The price having a high goes down creates an order block. If it does not go up to break that previous high as a
[30:04] breakup structure that other block is not yet valid until it breaks that structure. Then once it comes back down I can buy from the other block when there's liquidity protecting it. So those are tools are going to make an
[30:16] order block valid and let me show you other block that is not valid and you other block that is not valid and you will see it right away. not valid and you're going to see see for yourself that the price will not
[30:30] for yourself that the price will not respect it. you. And if now this is a nice example right here. I've seen a nice example. Now watch price at this very order block.
[30:46] This an order block for a buy. Price had this other block on creating this very price goes down creates the other block. On creating it, it had this internal pullback which acted as liquidity. Then
[30:59] break this previous high. So there was no B. Meaning this other block is not valid. Though it has liquidity but there was no BS. So obviously this is not valid. So what happened? Price just came violated the other block did not respect
[31:14] it. Why? Because it didn't if it had broke structure then the price will come down respected and continue going up. So they work hand in hand. So these are three things with this strategy
[31:28] right and these are three things I used to approach the market. Now the final to approach the market. Now the final aspect of this is now how I do it. the different time frame I go to once I go to the market what I look out for and
[31:41] how I eventually end up taking this very trade. Before I go on, if it's your YouTube channel, you are highly welcome and you are watching the day trading geek. My name is Gossu and I create YouTube video for this very channel to
[31:55] help you guys become profitable. So, if it's your first time, do well to support the channel by liking the video and subscribe so you get more videos like this, right? And before I go on, I have a mentorship
[32:07] class where I teach people how to trade. Now, the mentorship class, I teach you the strategy and everything, right? But the main course of the mentorship class is for me to guide you, take your hand and then guide you on how to become
[32:20] video, you go to your chart, start applying what I'm teaching, then you're going to do some things that is going to make you hit stop loss. And you can't if you are not my student. But if you're my student, I have a group where you can
[32:34] easily ask question. Me personally, I'm there. I'll reply you, give you my feedback, give you my expectation, show you what you did wrong, and then you then learn. And we have other traders there as well that are ready to also
[32:48] help you. There have been training for some time who are profitable that also guide you in the mentorship class. So, it's just me training you until you become profitable. I guess I received a couple of testimony from my students um
[33:01] on my notification while recording this very video right I'm going to post on the telegram my telegram link is in the description is 100% free so this is the telegram right here the link will be in the description right of this very video
[33:14] now notice this is a general group for group this is the center general group and if you watch this person sent a buy on gold he said he was expecting a buy then he tagged me and said my name is God's will. Then I
[33:29] said, "God's will please check this out and confirm it it's valid." So I said that your breakout block is kind of risky. Meaning the opportunity he had was kind of risky. Then I said, I prefer this breakout block, right? So I sent
[33:43] him the setup and that was one of the setup I showed you guys earlier. This very one that played out given one is to four arrow arrow. So all he had to do now was just to redo his analysis, correct himself and then follow it the
[33:57] way I've given him. So with that he's my student. He was in September class which is last month. This month is currently October class. So to join the metric class about $40 and if you want to get access to me oneonone I'll teach you
[34:09] oneonone section. I also offer oneonone section. Link is in the description to join. So that's that's by the way if you wish. Then let's go on now. How do I now go about this? Every single time once I go to the market, the first thing I do
[34:23] is I go to higher time frame. So I do top down analysis, right? With this strategy, I do my top down analysis. Now many of you are going to ask what's top down analysis and top down analysis is you analyzing from
[34:38] different time frame, right? Starting from a maybe a higher time frame to a lower time frame or a lower time frame to a higher time frame. But you won't looking out for order block break of structure liquidity and start buying or
[34:51] selling. So you want to make sure you are starting from maybe a higher time frame from a lower time frame. That's what top down analysis is. But me personally, I tend to start from a higher time frame. So my top analysis
[35:03] higher time frame. So my top analysis now starts from a higher time frame then to a lower time frame where I finally now take the trade. Right? So the time time frame I use and how I go about it. The very first higher time frame I use
[35:18] is the 1 day. That's my highest time frame because I'm a day trader. Then the second time frame is a 4 H. That's another time frame I also use. Then the third time frame is a 2 H. This is the third time frame I use are three higher
[35:31] time frames. These are time frame I consider as my higher time frame. And I'm going to show you what I do on these different time frames. Then for my entry different time frames. Then for my entry to execute my trade I use 1 hour as my
[35:43] to execute my trade I use 1 hour as my entry time frame 30 minutes and the 15 minutes time frame the three time frame now I use for my entry sometimes I do go to 5 minutes time frame you know 5 minutes time frame now
[35:57] is more of I'm now scalping so I do use 5 minutes time frame sometimes right so these are the three different time frame I use for my entry time frame first on a Once I go to this higher time frame, I want to know
[36:12] right what I do on this first time frame is I mark out.
[36:24] Now these levels there are levels where I expect a price to get to. Then I also zones. Let me write it out. Why do I mark out this level? Why do I need to go to high? Why can't just why can't I just
[36:38] and start marking out order block liquidity and break up structure and start taking trade or just go to 15 minutes and start doing that first I mark out this key level on a higher time frame and these are the reasons first
[36:51] frame and these are the reasons first thing I want to know where price is heading with my higher time frame you know price respect more time frame moves right now
[37:04] I want to be able to Okay, this price is going up. Where is price heading? Everybody, gold was going up. Everybody was able to easily just see, okay, gold is going to likely get to $4,000, right? So, it was really going up and
[37:17] everybody was expecting $4,000, $4,000 and eventually it goes to that $4,000. So, that's also what this key level does. It's going to help you know, okay, where do I expected price to get to? Then, since you've marked that level,
[37:29] was not looking out for buy. Nobody was selling. Why? because everybody was expecting it to get to that $4,000. So the same thing. So since you have that looking out for buys, buys, buys, buys till the price gets there. The second
[37:45] till the price gets there. The second thing is those are those levels. They are possible reversal,
[37:57] right? Those are possible reversal zones. reversal zones or reversal levels meaning on getting there now price can decide to change change character and start becoming bearish or start becoming bullish. Now gold has been going to
[38:10] going up everybody was expecting 4,000 on getting there canide to change and going down just like that. Why? Because achieved the goal it has gotten to that supply zone just like that. the same thing once you get to that level there's
[38:25] a chance that it can change and start becoming bearish or start becoming bullish so that's why it's needed those are the two reasons I use it a mark key level then is these other ones now they for my entry
[38:38] which is now my entry time frame now for my entry you already know what I look out for first which you already know breakoff structure or the change of character is that it has a break of structure or it gives a change of
[38:53] character. The second thing it is going to have the liquidity. You it is going to have the liquidity. You know liquidity needs to protect the
[39:05] order block. Then the final thing is I'm going to look out for order block or my breakout block. Then I take my trade. So with this I approach the market every single time. So this is a plan on how I approach the market. So now I want to
[39:19] analyze gold. I want to take trade on gold. So I want to go to my higher time frame to start my analysis, start my prediction, start doing my setups, right? Start looking for my setup, start looking for opportunity. So once I go to
[39:34] closely. Remember what I mark out on this higher time frame, key levels. And this I mark out my key level. I tend to mark out long weeks because on a higher time frame, it always tend to be long weeks.
[39:48] tend to be long weeks. Most times you will hardly see an actual order block on a on a higher time frame. So in this case now this is a long week and I can mark out this long week with a with a box. This
[40:02] this long week with a with a box. This is an order block, a demand zone. But I line and that's why I do call it key level. It's an order block. So I do use a line to just indicate it like this. That's where the long week I'm followed
[40:16] actual order block on a lower time frame. So I just mark it out like this possible buy zone. Then if you watch this another one a long week I can mark this another one a long week I can mark it out
[40:31] possible zone where price is heading. So now okay I've marked out this very level going down if I see that good is going down I'm going to be looking out for sells till it gets here and on getting here there's a possible there's a chance
[40:44] that possible reversal can happen and once it gives any reversal I'll start looking out for buys then if you watch it has another zone right here it had this long week I can I mark this long week now as an order
[40:57] block as a key level but I don't tend to just use my horizontal line I'll just indicate from where the long week started with my horizontal line so closely. You're going to see more of lines. You can see different lines on my
[41:10] chart. Once I'm doing analysis, I don't think to just use the line. Now, if you watch, this is another long week I use. This was when I caught the buy. This was a long week right here. Then I can also
[41:22] mark it out as a zone where I can easily take my trade from as a possible reversal zone. So, just like that. Now, first gold is going down. I just marked yet. But I just marked out this bus as a zone where gold can easily get to on a
[41:37] 4hour time frame. Now you're going to ask why do I go to why do I have different time frame? Why can't I just use keep using my 4hour time frame? This what it is on different time frame is going to show you different things.
[41:49] 4hour time frame can show you a long week. Daily time frame cannot show you. 2our time frame can show you another different week. So you want to go over check out the different time frames. So what I do is daily time frame if it's
[42:01] not clear I can go to 4hour if on 4hour is not clear I can go to 2 hour time perfect opportunity that's the reason I do tend to use these different time frames right and there are also some um
[42:15] tips which the video is already getting too long I teach this in my mentorship class you can join and you get those tips right on how you can easily jump on trade with these key levels and you know some secrets to the market which I'm
[42:29] class. If I say let me do it, it's going to be long for this very video. Probably I'm going to record a video on it. I don't know yet. So join my mentorship class and you learn that. But this is what I do since I know, okay, this is a
[42:41] level gold can likely get to on a 4hour time frame. I've marked it out. Then I minutes. That's what I love to use most times. I can go to 15 minutes as 15 1 hour time frame as well. Any of them, they are all the time frame I use for my
[42:57] entry. So since I have that time frame, I can start looking out for trades. So I can start looking out for trades. So now if you watch price this other block, you can see it's an order block on the 30 minutes time frame. It was the last
[43:10] before the price actually started dropping. It created a blue candle. It dropping. Then that blue candle has this low which it broke as a break of
[43:22] structure. Then if you watch it had this engineered liquidity having this high retrace down will goes up and take out that high engineer liquidity formed. time there was also another internal pullback right here but it's not clear
[43:36] on the 30 minutes time frame. That's another reason I do use different time go to 30 minutes time frame and then start jumping on trades. Right? I don't frame is not clear I can go to 15 minutes. I can go to 30 minutes. If I go
[43:50] to 30 15 minutes now, it's going to show that there's an internal pullback. So, it's now validating my setup. It's now giving confirmation that okay, this is valid for my trade. Just like that. Because it had that pullback. Now, it
[44:04] had this other low. It broke through downside. I'm now looking at for sale. If I'm selling, where do I expect for the price to get to this very level? Now, I didn't I almost forgot to show you guys this. This is how we now take
[44:16] trade from these levels. This how we enter trade. Once we have the price going up, goes down break structure having a first pull back as liquidity. Then we wait for the price to come back to this very um buy zone which
[44:33] is this other block right here. Then if you watch this first order block now is now acting as liquidity protecting this other one. So criteria are complete breaker structure liquidity then other block is where I'll buy from. So we
[44:46] place our long position two. Then our stop lo is going to be slightly below this very um other block we mark out. It shouldn't be too tight. Same
[44:58] thing. It shouldn't be too far from the other block. Just slightly below it. Then you can easily say let me target this high as where I expect the price to break as a break of structure. So that's how we take trade with this
[45:10] strategy. So in this case I target this break of structure to the downside. Then it had this um engine liquidity on a 30 minute time frame. But on a 15- minute time frame now, it also has a clear internal pullback. Stop loss
[45:25] slightly above that high. Then I can target this low as my expected break of structure. So what happened? Price gave you clean 1 So what happened? Price gave you clean 1 is to 6 R almost 1 is to 7 R. Beautiful.
[45:39] I'm now looking out for sale knowing fully whether this is where I expect the price to get to. And remember, we don't just jump on because the price break, we just click keep adding up positions. It doesn't always work that way, right? If
[45:52] the price breaks, then you wait for the price to retrace maybe to this next order block, then you continue your sell or to the next breakout block or you continue your sell just like that. But since it broke,
[46:05] it finally just dropped without giving any other opportunity on getting here. What do you think I would do? I will no longer start looking out for sale. I'm going to stop selling for now. Then maybe start looking out for buy because
[46:18] of character. So on getting there, what happened? It gave a change of character. This was when I had this was I had the buy opportunity from here. I had the buy Why? Because it's a possible reversal zone. It has not given a change of
[46:32] character yet for me to confirm it. So this was when I had the setup for the buy, but I didn't just jump on it. And if you watch, I didn't show that buy in my live. If you watch, I didn't show that by when
[46:45] I begin the class, when I begin this very video. Why? Because I didn't take it. Even my YouTube my I didn't post on my Telegram because I didn't take it. This was when I had it set up right here. You can see. So I didn't take it
[46:57] personally. So that's why I didn't show it. I didn't post it. It went well. It's didn't just take it because it's not what I it's not how I trade. Now on change of character and let's see if it
[47:10] give a change of character. Price had this very um low it didn't break structure to the downside. So there was no break of downside but it had this high it broke past it. So this was the high it broke and that break of
[47:23] character. Since the price was just selling aggressively, there was no clear low it created. But this was a little low that the price created, retraced up, then come back down. So this low now can as a high,
[47:37] sorry, a high. Then on breaking past that high as a change of character and that change of character has a break to the downside and a break of to the upside. I didn't use this very break. I didn't use this very break right here.
[47:51] Why? Because it didn't break to the downside. So now I started looking out for buys and all you need is just your breakout structure. Watch out for where the price breaking structure to. This was a break to the upside. So I'm
[48:04] looking out for buy. Another break to the upside. I'm looking out for buys. Then I took my buy from here from this other block. You can see the 15 minutes buy. Then this low you can see it clearly.
[48:19] Acted as my liquidity. Then I took my back. I target this next high as my take profit stop loss below this very low giving me my clean one is to four one is to 4 R. Right. So pretty much I can keep looking
[48:35] out for buys because all the break that are happening now they are now breaks to going to do if I come back to the chart the next day? What do you think I'm going to do? I'm going to mark out another level at the top where I can see
[48:48] this where the price is heading to. Then I'm going to keep looking out for buys till the price gets there. Just like that. So I believe this video was helpful and with this video you can go to your chat and then replicate what
[49:00] I've said and you're going to see similar results. Right? My students are you're in this on my free telegram you're going to see a whole lot of testimony I post about my students. Let me just show you few then you decide
[49:13] if you want to join the mentorship class or not. Now notice very person messaging or not. Now notice very person messaging me. He passed the phase phase one of his challenge. All right. Notice what he said. You are now officially a funded
[49:25] maven trader. Congratulations. So he got funded. This is my one of my students. Then this is another person right here saying consistency. Thank you very much. My name tagging me. My eyes are wide open now. So I teach you everything. And
[49:39] if you watch this very personal, he had three wins in a row. That's about $1,300. Another amount right there is a profam account. And if you watch this another person right here, she's an October
[49:52] student who is currently killing the market. He she caught the gold buy I took, right? He caught the she caught the gold buy I took as well. Now these are different people um giving testimony and you can see this one catching sales.
[50:07] They always tagging me, right? But once they get their set up, once they got testimony, they will tag me and then just to show how it's going for them, right? And show because I do I give them everything how I if not to me
[50:23] personally, I'm winning the trade. So as far as I'm winning, they will definitely win because I'm winning. It's working for me. What I'm teaching is working for me. So watch this YouTube video, apply it, and then see for yourself how it's
[50:37] to join my mentorship class, click on the link in the description and then you the link in the description and then you join for $40. The oneonone is about oneonone mentorship is about $300 and you can pay two times. So
[50:52] without further ado, I'll see you guys in the next video. So take care guys.
The video opens with immediate trade results (10R, 4R) to grab attention and establish credibility, making viewers believe they can achieve similar gains.
This [STRATEGY] gave me [NUMBER]R in [TIMEFRAME]. In this video, I'll teach you [TOPIC] for free. Watch until the end to replicate my results.
AI-generated clip ideas for Shorts based on the transcript
Real trade results with high R-multiples immediately grab attention and establish credibility.
▶ Play ClipOffering a 'paid' strategy for free creates high perceived value and click-through potential.
▶ Play ClipDemystifying institutional trading secrets appeals to retail traders' desire for an edge.
▶ Play ClipClear explanation of a core SMC concept with practical examples, highly educational for beginners.
▶ Play ClipActionable walkthrough of the entire trade setup process, perfect for viewers wanting to replicate results.
▶ Play ClipSnapshot 2026-11-18
Every observation TubeSum recorded, plotted as measured.
The vertical axis starts at 53.9K, not zero, so later observations stay readable.
Based on 8 observations · last observed Nov 18, 2026 · solid lines connect consecutive measurements (≤2 days apart); dashed lines span days TubeSum did not measure. · vertical axis focused on the observed range (starts at 53.9K)
Based on 8 observations · last observed Nov 18, 2026 · solid lines connect consecutive measurements (≤2 days apart); dashed lines span days TubeSum did not measure. · vertical axis from zero
Exact daily observations; gaps mean no observation was taken that day.
| Date | Views | Avg views / hour | Channel median |
|---|---|---|---|
| 2026-11-18 | 55,731 | 5.8 | — |
| 2026-11-17 | 55,472 | 5.8 | — |
| 2026-11-16 | 55,407 | 5.8 | — |
| 2026-11-15 | 55,113 | 5.8 | — |
| 2026-11-14 | 54,808 | 5.7 | — |
| 2026-11-13 | 54,617 | 5.7 | — |
| 2026-11-12 | 54,413 | 5.7 | — |
| 2026-11-10 | 54,017 | 5.7 | — |
Audience reaction — separate from the performance metrics above.