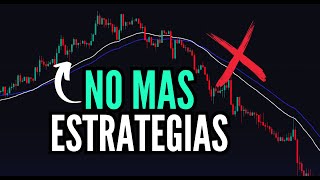

Stop Searching Trading Strategies! Do THIS Instead
42sThe opening directly challenges viewers' common frustration of strategy overload, creating immediate curiosity and relatability.
▶ Play ClipThis video helps traders identify the single best trading strategy by focusing on market patterns that repeat over time, rather than trying to use every indicator at once. The speaker shares personal experience and a specific Fibonacci-based approach to achieve consistent profitability.
[00:00] among all the trading strategies that exist, which of them is the right one then this video is completely
[00:14] because I am going to help you. to say what is the strategy that, can lead you to achieve the best results. telling me that of the many
[00:28] and I am sure that this is probably because It also happened to me when of so many strategies that I knew
[00:42] I wanted to apply them all at the same time. . Technical analysis I marked indicators. I changed values
[00:55] had said in a video that this strategy that with so many tools that I put on my chart at the end of the day I was left completely blank
[01:11] 95% of traders or are trying to educate themselves for example, because you will always see videos that say
[01:26] this is the infallible strategy, when we learn all at the same time
[01:38] appropriate on strategies that are based on the action of the pre. Strategies are based on market
[01:54] . Many times I have been asked what and clearly indicators are a great tool many indicators today
[02:06] since many traders begin to mark many everywhere that perhaps they do not so try to find a strategy that is based
[02:21] If there is one thing I can tell you, it is that in my Personal case were the from a graphic tool,
[02:37] graphic tools can be resistances, supports, a Fibonacci, for example these tools made me
[02:50] and at the end of the day that is what you only need one to be profitable and make a living from trading
[03:03] to understand the markets chart patterns in my point of view are the best and furthermore
[03:17] will always repeat patterns and repeat so look for a strategy that fits all of that different than you opening a chart
[03:31] trying to predict what the next that can be really complicated do that
[03:44] an easier way to understand my graphs situations in the market's past remember that if you want to operate
[03:58] in the description of this video You have the link you have all the details in the description tells us that we need a trend
[04:14] to break our last minimum the chart breaks it, it does a pullback, , when I open a chart
[04:28] similar to this that I already know works, can get here and can do this no no chartist figures
[04:43] has repeated based on the strategy that I use like the one that I was telling you, in the case of Fibonacci,
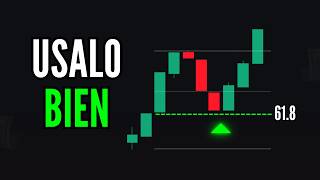
[04:55] You can see on my social networks are in Fibonacci or in Fibonacci extensions, to do a Fibonacci retracement. at 61.8%
[05:12] another Fibonacci retracement at 61.8% that is where I can look to place my operations if the chart does not have the conditions that I need
[05:28] or I don't even spend the time trying to decipher it all the charts those that work for you.
[05:43] Fibonacci tensions. I need to have a trend. with small retracements from the beginning to the end of the trend
[05:55] I mark my fibonacci from the beginning to the end I mark my entry point at 60 and 1.8 and depending is where I confirm my operations
[06:10] what I am going for is that I am not inventing I am not trying to make all the strategies I am simply using it is themes images
[06:24] that I have already operated that the graph has repeated countless times here I have exactly the same impulse retracement
[06:38] impulse I have here and my trend marked a Fibonacci from the beginning to the end excellent I mark my entry point at 60 and 1.8% and if you look at
[06:55] the same as the one I have on the right side these same principles to All my operations those situations in the market that have already been repeated
[07:11] I only hope that the graph adapts to it need one strategy , you can follow The same thing that you use is Fibonacci
[07:26] imbalance always try to look for situations that you already know are effective if the graph repeats them
[07:40] that the majority of my traders, when they open a chart, minute by minute, It is because I have resistance here,
[07:55] but now it's reaching the minimum and this is super ineffective for example because my The strategy is the Order Blocks,
[08:11] I see that I have liquidity in the area of the order block. a blog breaker, , come back and at this moment I place my operation.
[08:27] that I know that the chart repeats over and over and over again this really it is the same scheme
[08:42] these same principles using 500 stick to a single strategy
[08:55] try to perfect the principles of your strategy check if what you are seeing on the graph ? If it doesn't look similar,
[09:07] then we go all out in our operations. and subscribe to our channel and tell me in the comments and Here I leave you an upcoming video so you can see it,
[09:22] click on this other video
⚡ Saved you 0h 09m reading this? Transcribe any YouTube video for free — no signup needed.