
AI Summary
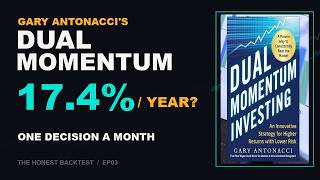
The video tests the dual momentum investment strategy using real, tradeable funds from 2004 to 2026, revealing both its strengths and critical weaknesses. It compares the strategy's performance against a simple S&P 500 buy-and-hold, showing that while it offers drawdown protection in some crashes, it significantly underperforms in bull markets.
Chapters
The strategy asks two questions monthly: Did US stocks beat cash over the past year? If yes, which performed better — US or international stocks? Hold the winner for the next month.
The test uses real funds from October 2004, charges 10 basis points on entry and switches, and assumes month-end closing fills. The international fund excludes emerging markets, making it an approximation.
In January 2008, US stocks underperformed cash, so the model moved to bonds. Dual momentum lost 17.7% from its peak vs SPY's 50.8% — the strategy worked as advertised.
During COVID, the 12-month signal reacted too slowly. The model stayed in stocks through February and moved to bonds only at the end of March, resulting in a 20% drawdown vs SPY's 19% — no protection.
From 2004 to May 2026, dual momentum grew $100,000 to $698,000 (9.4% a year) vs S&P's $994,000 (11.2% a year). The defense cost almost $296,000 of ending wealth.
From late 2004 through 2013, dual momentum beat S&P 10.4% vs 7.6% a year. From 2014 through May 2026, it reversed: 9.0% vs 14.4%. Across 12 completed calendar years from 2014, dual momentum won 1, tied 3, and lost 8.
The result doesn't prove dual momentum is broken. The rule still delivers smaller drawdowns, but the 12-month gate reacted too late for COVID, and aggregate bonds were a weak shelter in 2022. A fair follow-up would let cash compete with bonds.
Mentioned in this Video
💡 Key Takeaways
2008 Crash Protection
Demonstrates the strategy's core value: cutting drawdown from 50.8% to 17.7% during the 2008 financial crisis.
01:55COVID Failure
Reveals a critical limitation: the 12-month signal reacted too slowly to the fast COVID crash, offering no protection.
02:07Long-Term Underperformance
Shows that over the full test period, dual momentum underperformed a simple S&P buy-and-hold by 1.8% annually.
02:22Trade-Off Between Defense and Return
Highlights the fundamental trade-off: smaller drawdowns come at the cost of lower long-term returns.
03:28Full Transcript
[00:00] 17.4% a year. The S&P did 12.3. Maximum drawdown, less than half, and the whole system made one decision a month. That table turned dual momentum into one of the most famous rules in systematic
[00:12] investing. We wanted to know what happens when the indexes are replaced with funds you could actually buy. We're ordinary people with real data. Case number three, dual momentum. term.
[00:25] Once a month, the strategy asks only two questions. First, did the USS stock market beat cash over the past year? If the answer is no, step out of stocks and hold bonds. If the answer is yes, ask which market did better, US stocks or international stocks.
[00:42] Hold that winner for the next month. That is the entire rule. In January 2008, US stocks were down 2.7% while cash had earned 4.2%, so the model moved to bonds.
[00:54] Now the honest part. The famous 1974 through 2013 table used hypothetical total return indexes and no trading costs Our test begins in October 2004 using real funds for U stocks international developed stocks and U aggregate bonds
[01:12] The international fund leaves out emerging markets, so this is an approximation. We charge 10 basis points on entry and every switch. The baseline assumes a month-end closing fill,
[01:26] and we also test the next market open over the daily data overlap. long history drawdowns are measured at month end not intraday put a hundred thousand dollars to work in late 2004 for three years the model followed the
[01:41] stronger stock market then January 2008 the S&P's 12-month return fell below Treasury bills so the model switched to a GG before the worst of the collapse at month end marks dual momentum lost seventeen point seven percent from its
[01:55] peak. SPY lost 50.8. This is the strategy working exactly as advertised. But the next crash was different. COVID fell faster than a 12-month signal could react.
[02:07] The model stayed in SPY through February and moved to bonds only at the end of March Its drawdown was 20 SPY was 19 No protection at all In 2022, the model moved to bonds at the end of April.
[02:22] Bonds fell too, but dual momentum still cut the month-end drawdown from 20.3 to 14.7%. Not an escape, just a smaller loss. Now pullback. By May 2026, $100,000 grew to about $698,000 in dual momentum and $994,000 in S&PY, that
[02:41] is 9.4 vs 11.2% a year. The defense cost almost $296,000 of ending wealth. The timing of that trade-off is even more revealing. From late 2004 through 2013, our EDF approximation beat S&PY 10.4 vs 7.6% a year.
[03:00] In 2014 through May 2026, it reversed 9.0 vs 14.4. Across the 12 completed calendar years from 2014 through 25 dual momentum won 1 tied 3 and lost 8 waiting until the next trading day open reduced its 2015 plus CAGR by another 0 percentage points At 25 basis points per switch the full window result was still 9
[03:28] Our result does not prove dual momentum is broken, and it does not prove bonds are the whole problem. Across the months spent away from SPY, roughly 3 fifths of the pre-cost performance gap accumulated during a GG periods and two-fifths during EFA periods. That is a
[03:44] description of this sample, not a forecast. The rule still delivers something many investors value, a far smaller long window drawdown. But the 12-month gate reacted too late for COVID,
[03:56] and aggregate bonds were a weak shelter in 2022. A fair follow-up would let cash compete with bonds. That would be a new test, not a rewrite of this result. Next, we're testing Larry Connor's RSI 2 pullback rule. Buy after a sharp 2-day panic,
[04:14] then sell the rebound. If this helped, liking and subscribing genuinely help us keep these tests coming. Thanks for watching and we'll see you in the next one.