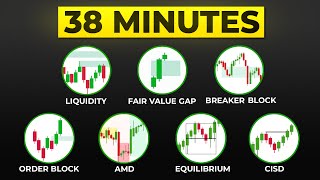

I made $120K last month trading ICT
45sHigh earnings claim grabs attention and sets up authority for trading advice.
▶ Play Clip"The title promises to explain ICT concepts that made $120k, and the video delivers a thorough breakdown, though the income claim is unverifiable."
The video explains key ICT (Inner Circle Trader) concepts that the trader claims helped them earn over $120,000 in a month. It covers buy/sell-side liquidity, fair value gaps, SMTs, order blocks, and other concepts, emphasizing that traders should pick a few concepts to build a simple, profitable strategy.
Lists key ICT concepts: fair value gaps, SMTs, order blocks, liquidity, breaker blocks, equilibrium, low resistance liquidity, data highs/lows, market maker models, AMD. Recommends picking three to build a strategy.
Buy side liquidity is a high where many orders rest, creating a pool for price to take before reversing. Traders should wait for major highs to be taken before entering shorts.
Sell side liquidity is a low where stop losses rest. Traders should wait for major lows to be swept before entering longs.
A three-candle sequence where wicks of candle 1 and 3 do not meet, creating an imbalance. Price gravitates to fill the gap and then continues in the original direction. Acts as a magnet.
Divergence between correlated assets (e.g., ES and NQ). If one takes a high/low and the other fails, the failing asset doesn't need to revisit that level, indicating a reversal.
A sequence: low, high, lower low, higher high (bullish) or high, low, higher high, lower low (bearish). The last candle before the break becomes the breaker block. Used for confirmation.
Highs and lows of news event candles (e.g., CPI). These act as liquidity pools; price often takes them out and reverses.
Generated by failure swing highs/lows (stacked highs or lows). Price tends to run through all of them, providing high-conviction targets.
The 50% retracement level of a significant leg using Fibonacci. Price often pulls back to EQ before continuing the trend. Buying at discount (below EQ) increases probability.
Bullish OB: first bullish candle after a sellside sweep, confirmed by close above it. Bearish OB: first bearish candle after a buyside sweep, confirmed by close below it. Price often wicks into OB and reverses.
Similar to breaker block but occurs earlier. After a break of a swing point, the last candle before the break becomes a CISD level. Price reacts off it.
Identifies whether price is generating buy side or sell side. Once confirmed, price runs all generated liquidity. Overcomplicated; simply identify which side has more liquidity.
Three-phase sequence: accumulation (sideways), manipulation (false breakout), distribution (trend). Trade during distribution, not accumulation.
The trader emphasizes that success comes from picking a few ICT concepts, building a simple strategy, and sticking to it with discipline. They personally use fair value gaps, liquidity, and SMTs, and encourage viewers to take action and follow their rules.
What is buy side liquidity?
A high where many orders rest, creating a liquidity pool for price to take before reversing.
01:10
What is a fair value gap?
A three-candle sequence where the wicks of candle 1 and 3 do not meet, creating an imbalance that price gravitates to fill.
06:48
What does SMT stand for and what does it indicate?
Smart Money Tools; divergence between correlated assets where one takes a high/low and the other fails, indicating the failing asset doesn't need to revisit that level.
09:45
How do you identify a bullish breaker block?
Sequence: low, high, lower low, higher high. The last bullish candle before the break becomes the breaker block.
13:09
What are data highs and lows?
The highs and lows of news event candles (e.g., CPI) that act as liquidity pools.
15:44
What is low resistance liquidity?
Generated by failure swing highs or lows (stacked highs/lows); price tends to run through all of them.
17:16
What is equilibrium in trading?
The 50% retracement level of a significant leg using Fibonacci; price often pulls back to EQ before continuing the trend.
19:24
How do you identify a bullish order block?
The first bullish candle after a sellside sweep, confirmed by price closing above it.
22:26
What is a CISD?
Change in State of Delivery; after a break of a swing point, the last candle before the break becomes a level where price reacts.
26:26
What are the three phases of AMD?
Accumulation (sideways), Manipulation (false breakout), Distribution (trend).
32:14
Core ICT Concepts List
Provides a comprehensive list of ICT concepts, setting the stage for the entire video.
00:28Buy Side Liquidity Definition
Clear explanation of a foundational concept with practical application.
01:10Fair Value Gap as a Magnet
Simplifies a key concept into an intuitive analogy, making it easy to understand.
06:48SMT Divergence Between ES and NQ
Explains a powerful confirmation tool using correlated assets.
09:45AMD Phases Explained
Breaks down market structure into three actionable phases, helping traders avoid false moves.
32:14[00:00] I've spent hundreds of hours learning and trading ICT and honestly I could have made progress a lot faster. So I'm making this video to explain every ICT concept that actually matters and helped me make over $120,000 last month's trading.
[00:13] Let's get into it baby. Let's get into it. Now let's get into the actual ICT concepts. Here's a list of all the ICT concepts that I will be covering in this video. These four ICT concepts that I have highlighted are the ones I use most and I will be going more in depth with that towards the end of the video.
[00:27] So all the concepts that we're going to be going over is Fair Value Gaps, Bearish EIC, Bullish EIC, SMTs, Bullish Order Blocks, Bearish Order Blocks, Buy Side Liquidity, Sell Side Liquidity, Blaker Blocks, Equilibrium, No Widgetist Equity, Data High Low, Market Maker Buy Model, AMD, Market Maker Style Model.
[00:43] These are the ones I consider to be the most important, but I don't even use all of them. There's a time and place for each of these and the most important thing that I want you guys to know is that after watching all this video, I want you to pick the three that you like most and try to create a strategy out of that because that's really all trading is.
[01:00] You just want to find these three concepts that resonate with you the most and you can build the most profitable strategy in the world. I literally only use like three of these and we are back with the freaking broken finger. All right, so the first one we got is buy-side liquidity, which is practically just a high where lots of orders are resting, creating a liquidity pool for price to take before delivering lower.
[01:19] Often can be seen as where lots of stop losses are resting for retail traders, right? So the whole reason we want to be able to identify buy-side liquidity, which I just like to use major highs, is because we know that once these major highs get taken, we can anticipate a reaction for price.
[01:34] So we want to wait for any buy-side liquidity to get taken before we enter any sort of short. So if we pull up the charts here, for example, and we mark out our buy side liquidity, you can see that our significant highs are going to be this high, are going to be this high, and are going to be this high.
[01:49] With this high all the way at the top being our major high, because this is the most significant high of all. Of this entire price action that we see here, this is the highest point in price action. So we know that once price takes out this high, we can anticipate a really strong reaction down.
[02:03] So if we watch how price plays out here, it'll go for that first high, bang, and then it'll go for that second high, bang, and then finally it'll go for that third high. And we know that once price takes out this third high, that practically all those retail traders who were in shorts have been stopped out.
[02:20] And now we can enter shorts safely knowing that our high will most likely be protected and won't be used as buy side liquidity for us to get absolutely screwed over. So now that this high has been taken, we can anticipate that price will most likely want to sell off because we have taken this major buy side liquidity here, stopped out all retail traders, and have practically set up smart money to enter trades and absolutely cook.
[02:45] And so as you can see, right after that level gets taken, price sells off pretty damn hard. So if we were to take shorts anywhere along this line, we would probably be printing. And just to throw in some really important thoughts for you guys, because this isn't just some basic shit about, oh, buy side liquidity is just going to be those major swing highs.
[03:00] But what I really want you guys to focus on here is these major highs, right? Because if you're taking longs, price is very unlikely to just have a reaction off these two highs without running this final high.
[03:12] What I'm trying to say is if there's a low chance, price will just reverse after taking this high. So if you were taking a long from down here, right? Let's say you took like a nice sell side sweep. let's say like you see okay price pick up the sell side then there's a five minute inverse of the
[03:26] upside and I'm taking a long setup right here it doesn't really make sense for you to be taking profits anywhere along this line until this final high gets hit because there's no reason price should be reversing any place before this major buy side so yeah on to the next one next
[03:43] we got sell side liquidity which is just the opposite it's a low where lots of orders are resting creating a liquidity pool for price to take before delivering higher often can be seen as there are lots of stop losses arresting for retail traders. Same thing, vice versa.
[03:55] Instead of buy side, we're talking about sell side here. So we want to focus on those major lows and we anticipate that any time price creates these major lows, that that's where retail traders stop off arresting. So if we want to enter any sort of long,
[04:07] we want to wait for these lows to be swept and then that's when we enter. Because most people will see those lows as an area of support, right? They're taking like some fucking support and resistance to have a trade. Fuck that shit. We're not doing that. We're waiting for those lows to get absolutely freaking nuked.
[04:21] And now we're coming in fast like you've seen Bolt. And we're going to smack some fucking longs to all-time highs. Probably not all-time highs. Probably just like a 1-1, 1-2. But it's true. It's true. Now, same idea is going to be applied here with sell-side liquidity, right? If we mark out our major swing lows here.
[04:35] We got this one. We got this one. We got this one resting right above this one. Sorry. And to keep shit simple, just like I said, the only thing I want to focus on is the major swing low.
[04:47] So, of course, I know that because we have all this outside liquidity, price is going to want to run all of this. But the biggest thing for me is seeing this final low get taken. And I know that once this final low gets taken, that price is most likely to give us a reaction.
[05:00] So, a lot of people will look at something like this and be like, oh, we're trending bullish. Let me just take a long, maybe off like this five-minute bullish or a value gap. Just because, you know, we've been going higher and now we're inside this five-minute. But no, no, you don't want to be trading against all this liquidity generated that's not in your fucking favor.
[05:18] There is a ton of sell-side liquidity right below you. So what do you want to wait for? You want to wait for price to go lower, see if there's sell-side, and then you want to look for longs. And you'll see that price is attracted to where all these orders are resting. It wants to get rid of all these retail traders.
[05:31] It wants to manipulate a bunch of people. And then people like us can make a lot of money. Then we can print, bro. Then we can print. Bang. so after you take out this what happens price gives us a nice reaction to the
[05:45] upside and we start going higher and I like damn we got the sell side sweep buying and now we're getting this inverse bang what are we gonna target this buy side bang and just like that right it's as simple as that
[05:57] freestyle freestyle but yeah like I said focus on those major lows same way I told you at the buy side focus on the major highs there's no reason price should reversing at any point around here it's only going to reverse or most likely going to reverse once we
[06:11] take out all that sell side liquidity so taking out this final major low right here and a little bit of extra sauce here but you can see that this low which we wanted to get taken that's that major swing low there this is a low that traded into a bullish for a value gap right and so if this low
[06:26] gets swept which was inside a bullish value gap that's when you can anticipate really strong reactions you'll see price goes ahead sweeps that low and then you get super strong displacement upwards. That's because it's inside a higher time frame key level. Think about it. Think about it.
[06:41] Next, we got Fair Valley Gaps. I hope you know what this shit is at this point. Unless I'm like the first person you've ever watched on this planet, then I don't know how you don't know what this is. But anyways, it's a three candle sequence where the wicks of candle one and three do not meet. The gap between these wicks creates an imbalance in price where price gravitates
[06:57] towards the fill, the imbalance in orders, and then pushes price in the corresponding direction. So in four words, it is a magnet. And if we make it six words, it is a magnet for price.
[07:09] Anytime we create these imbalances with this three candle sequence where the wicks of candle one and three do not meet, it creates this imbalance in price that price will gravitate towards and react, right?
[07:21] So that's what a fair value gap is. All right, now we're on the charts. Let's look at something like bullish price action. What does bullish price action look like? It looks like this, right? As we're trending higher, we get pullbacks. and these pullbacks are typically into these higher time frame for value gaps you can use
[07:33] your value gaps on any time frame whether it is for your entry whether it is for determining your bias or the next round liquidity right that all depends on what time frame you use you mark out your fair value gap so if you look at something like the hourly chart for example and we look
[07:45] right here and we mark out all these hourly fair value gaps we can see that price comes higher goes lower opens up these fair value gaps price goes higher trades lower hits these fair value gaps reacts what happens price goes up comes down hits these fair value gaps reacts price comes up
[07:59] comes down, hit these fair value gaps, reacts. Price comes up, comes down, hits these fair value gaps, reacts. Price comes up, comes down, right here, hits this fair value gap, reacts, and keeps pushing price higher. Right, so it serves as a magnet. Like if we
[08:11] break down this leg right here, let's just look at this, and we see price comes up, we can mark out wick 1 and wick 3 here. They do not need of this candle, that creates a fair value gap. What happens?
[08:23] Price trades into the fair value gap and then goes higher. What happens right after? We can mark out these three candles right here. One, two, three. We open up a fair value gap. Price trades into that, reacts, goes higher.
[08:36] What do we do one more time? Price opens up a fair value gap. This candle, one, two, three. One and three wakes you down. What happens? Price trades down into it, keeps going higher,
[08:48] and this happens over and over and over and over again. And that is literally the whole essence of fair value gaps. Whatever time frame you use them on is going to determine whether it's helping you find your bias over on narrative of price or whether it's helping you find your entry.
[09:01] But they are one of the best concepts, if not the best concept, in the entire planet. You see everyone using them for a reason. Yo, you chub, I'm lowkey mogging right now. Am I mogging? Yo, someone make an edit of me.
[09:18] Yo. Keep this casual flex. back to the chart baby let go right so same thing we back on the hourly chart same thing with these bearish caps we see them open up price trades back into them and then pushes price lower Price opens these fair value caps up trades back into them and then pushes price lower
[09:38] You use fair value caps to help you determine the narrative of price. You see how we're reacting off them. You see if we're delivering from them. All these things. It's the same thing that our practice was done over before, but in the bearish sense. Now we got SMTs. SMTs are a divergence between two correlated assets where one pair takes a high or a low
[09:53] while the other fails to do so. This is an indication of a potential reversal from that key point because the divergence implies that the asset which failed to take the higher low now doesn't need to take the higher low because the other asset did so.
[10:06] Did that sound hella complicated? Did I overcomplicate the absolute shit out of that? In other words, let's say we're on NQ and we're looking to target some buy side liquidity and we see that ES, which is the future sharp for the S&P 500,
[10:20] ES takes out that buy side liquidity because they're correlated assets. They both have that buy side. And so if ES takes the buy side liquidity and NQ doesn't, then we can just assume that NQ took it. They work together.
[10:32] So we use ES and NQ as guides for each other. And anytime we see these divergences occur, this is a strong indication that price no longer needs to go back towards that high or that low where the divergence happens.
[10:45] Right? Like, just imagine this is NQ on the left, and NQ takes the high, and ES fails to take that same high. Right? We can see that it never took that high, never swept it, but NQ did. Then we mark out an SMT at that major high, and we know that ES doesn't need to go to that high, and that we are most likely to reverse because we have an SMT there.
[11:05] For example, let's say we're looking for NASDAQ to take this major sell side down here so we can take some longs, right? Because we see that we have this buy side above and we want to see NASDAQ just take out this major low right here, do something like this before we take any sort of longs.
[11:23] And if we look at ES and we monitor it, we see, oh shit, we see that ES actually took this low, right? That means we have an S&T here because NASDAQ didn't take this low, but ES did take this low.
[11:41] Therefore, we don't expect NASDAQ to go back to this low, and we can expect price to now start reversing and hit all this buy side above us, right? And that's practically exactly what happens.
[11:54] After we get that S&T at the low, price starts going higher and decides to run all this buy side that we have. So once again, we can see that NASDAQ failed to take this low, but ES did.
[12:08] And so I use NASDAQ and ES because they are correlated assets, and that's exactly how I trade. Now let's say we're looking for this major high to get taken on NASDAQ, right? Because we want to short, but we want to wait for some buy side equities to get taken.
[12:20] Whatever reason it may be that you just want to see this high get taken, maybe you're actually in a long position and you're planning to close when this high gets taken. And so you want to monitor ES if you're executing on NASDAQ to make sure ES doesn't take that high without you knowing.
[12:34] Because if ES takes that high and you weren't aware of it, then price is going to reverse on you and you didn't manage your position properly. So if you look at price on NASDAQ here, we see that price that's trading upwards towards this buy side liquidity right here.
[12:46] And if we go on ES, what do we see? We see that ES actually took out this buy side. What does that create? That creates an S&T at this high. So now NASDAQ doesn't need to go back to this high because there's an S&T there.
[13:00] We can expect the price to reverse and start trading lower. All right, now let's go through breaker blocks. We're going to speed around this one just because I do not give a fuck about breaker blocks, but I'm just going to teach it to you because whatever. The whole essence of breaker blocks is practically we create a low, we create a high,
[13:13] we create a higher low, right? This low is higher than this low, and then we create a higher high, and then after we create this higher high, we create a lower low. And so this break that after this higher high gets created and we create this lower low, we create a bearish breaker block around this level right here. And I'll show you how to mark
[13:29] that out. Of course, this is in the bearish sense. I'll show you the bullish sense as well. We're going to go through this one pretty quick though, because I'm not even kidding. I find it to be not that useful, but it is a good way to, I guess, get confirmation that price wants to go higher. I just don't use them for entries personally. All right, so let's look at this,
[13:44] for example, right? We go right here. We see that price creates a low. Then price goes up, and we create a high. And now price is going to make a lower low, right?
[13:56] This low, which is lower than this low. And what do we want to see? A breaker? We want to see a higher high. So if price trades above here and breaks this high, we will now create a breaker block right here.
[14:08] And I'll show you what that looks like. So now price goes up, bang. And so now the breaker block here is going to be this last up closing candle before the bearish move that created the lower low.
[14:22] So all you want to look for is that last bullish candle before price traded lower, and in this case, made the lower low. And then, of course, once we break through this high. So the sequence is low, high, lower low, higher high.
[14:35] Once we make a high above this one, after creating a lower low, our bullish breaker is going to be this last up-closing candle. And you can just mark out the whole thing. You can mark out the body. People do it differently. but that is practically what a bullish breaker is and that is how you get confirmation that price
[14:51] wants to go higher now let's grab a bearish example right so we have a high we have a low and now we want to see price make a higher high and then a lower low and then we're going to get the breaker right here so now price goes up and we make a higher high and now if we make a lower low
[15:06] we'll get the breaker block so now we get the lower low and where is our breaker block going to be well the breaker block in this case is going to be the last down closing candle before we manipulated higher so that's going to be our bearish breaker right here right so this is the
[15:23] last down closing candle before price manipulated higher created the higher high and then broke lower and then you can see price will respect this and continue trading lower so that is how we identify our bearish breaker block very simple shit i barely use these to be honest next concept
[15:39] is data highs, data lows. And data highs, data lows is practically just any red folder news event, which drops at a certain time, creating a very strong, voluminous, juicy candle, which you mark out the significant high of the WIC and the significant low of
[15:55] the WIC. And that serves as your data high and data low. And it makes a good liquidity pool, right? So it's the same shit as liquidity, but that's just induced by news in the market. For example, let's grab a day like September 11th, right?
[16:07] I just showed you that we had CPI on September 11th. CPI is a high-impact news. It drops at 8.30. And so if we look at the market here, you can see that right now it is 7.15. And once 8.30 rolls around, you will see a very giant fucking candle.
[16:23] Yeah, that's why you don't want to be in trade when this shit is happening because it can actually just destroy you. You know, like you don't even know what to do. You can't do anything about it. I mean, you can because you can look at the news before and then you're going to not be in a trade before. But anyways, thin data highs is going to be the high of that news candle that dropped and data lows is going to be the low of that candle.
[16:40] Better to mark it out on the one minute because you can see the actual candle stop. And so if you look right here, right, this is the A30 candle. You can mark out data highs, data lows. And so these serve as really good liquidity pool, right?
[16:52] So if we take out data highs, what can you expect? Bang, right there, we take it. You can expect price to sell off. And so it's really important to just mark out those highs and lows because they create really strong reactions in price. sometimes it won't take out both sides but almost always after it takes out
[17:05] like a data high it'll go for data low so just really good thing to mark out next concept I want to go over here is low resistance liquidity and low resistance liquidity is just a generation of failure swing highs or
[17:19] failure swing lows which creates a shit ton of liquidity being left behind in the markets for example if we grab this chart right here we can see that we have plenty of failure swing lows leading up to this, right? We have a bunch of sell sides just generated,
[17:34] accumulated one swing after another and after another. And with each swing, the one after it isn't taking out the previous low. And so what this is doing is it's creating this, what we call
[17:46] a trendline liquidity pretty much. And so anytime we notice this happening, we can anticipate that price is going to want to take out all of this lower liquidity once an opportunity arrives, right so I like to mark this down anytime I notice like LR being generated low resistance
[18:01] whatever anytime I see LR being generated in the markets I love marking it out it serves as a really high conviction target for me so I know if I'm going to take short that all this is most likely to get taken out and you can see that eventually when price does dump it decides
[18:14] to run most of it before going higher so we can see that here price trades down nearly to the final low here. Maybe ES took the final low. Yeah. So you can see ES actually ended up taking the
[18:27] final low here. So there was an S&T, which goes back to our S&T concept. Oh no. Final low was, yeah, it's all the way back here, but ES had already taken it. And so once all this LR gets ran, price then wants to deliver higher. All right. So that's something really important to
[18:42] look out for. You want to be able to see when price is generating a bunch of low-end liquidity. And you can also see right here, for example, after price set these lows, we left a bunch of highs stacked here, right?
[18:54] High, high, high, high. And once again this creates this what we call low resistance liquidity And we anticipate that all of is going to want to get ran once price starts delivering higher And same shit happens right
[19:08] Price decides to run all of that. So that's just identifying an accumulation of liquidity through failure swing highs and swing lows. Simple, simple, simple stuff. Next thing I'm going to be going over is equilibrium.
[19:20] Yeah, I don't know how to fucking spell it. Equilibrium, bro. So equilibrium practically is your ability to mark out a significant high and low, right, a significant leg. Let's mark out this right top to bottom using a Fibonacci tool.
[19:34] And equilibrium, as the name implies, is going to be the equal, the middle, the 50% mark of that leg. So if we're looking at a leg like this, right, and we pull up a 4-hour here, for example, and strain it out a bit, and we mark out this high and low, we can see that once we create
[19:49] this bullish leg, when it's a really strong leg like this, we want to see price pull back into EQ before continuing higher. So we anticipate a move like this, and then price is going to want to keep doing that. And price is almost always looking to rebalance the equilibrium before
[20:02] continuing in that direction. So then we can see that price decides to pull back lower, hit EQ, and then continue higher. And then what does it do once again? And then we can see right here, we create a smaller leg price does what comes down hits eq bang continues living higher then what
[20:20] does it do price creates another leg and what we'll see most likely happen is price pull back into eq like that once again and then continue higher and then and then maybe do it like a
[20:34] thousand more times i don't fucking know right but the point is most of the time price is looking to rebalance to at least equilibrium before continuing higher sometimes you don't get the rebalance but sometimes like this uh you do well most of the time you do so just something to take
[20:48] note of because it happens literally all the damn time it's just a nice thing to know because if you are looking to take longs you want to make sure that most of the time you are trading below equilibrium that's going to give you higher probability on if you're longing in the premium
[21:01] here then it's less likely to play out if you're longing from a discount it's more likely to play out these are things you want to keep in mind right this is as simple as buy high sell low wait do not listen to that advice that was fucking horrible advice buy low sell high same shit you
[21:16] want to buy the discount and sell at a premium they're common sense so it's nice to mark out that range top to bottom each of these strong legs and if you want a long ideally wait for price at least pull back into equilibrium and then confirm that it wants to go higher right so you
[21:31] can combine these concepts that i'm teaching you so far let's say the strategy you decide to put together is oh well my strategy is waiting for price to hit equilibrium and so that's like step
[21:43] one right here price hits equilibrium and after we hit equilibrium I want to see a fair value gap open up and then wake out of it and so then you get a fair value gap to open up and then we work out of it and this is like your strategy right or maybe your strategy is equilibrium and then
[21:59] break a block so after we hit equilibrium I want to see a break a block so price has to close above heal and then once you pose above heal I'll take longs and so then you take longs when this fucking happens
[22:11] and you get that blink of luck you know you can make up your own strategy but the point is if you just combine three of these concepts that I'm teaching you throughout this video you can make any strategy it's genuinely that simple I hate to say it it is that simple whoever is telling you it's
[22:23] more complicated than that is fucking lying to you bro I literally use three concepts now once again we have a concept that I don't really use often but it's order blocks so here we have bullish order blocks or bearish, whatever, and this is bullish.
[22:36] This is the first bearish candle after a sheet of sell-side liquidity, which is confirmed by price trading above that newly formed bearish candle. Price uses an order block at the point. So price comes down, so you see sell-side. And then once we get a bearish candle after starting to flip bullish,
[22:49] once price closes above this bearish candle, then we use that as the OB. You can mark out the wick. Some people mark out the whole body. Some people even mark out the wick and body. Some people don't even use order blocks like I do. But I'm teaching you the way I like to use them,
[23:03] and this is how I use them. Some people like to use the first candle, right? Some people will use the candle that swept sell side for this last bearish candle and they'll use that as an OB. But I like to wait for after the sell side sweep for that first bearish candle to be printed and then once we close above it,
[23:16] that's what I use as my OB. That's what I've seen to work best and most consistently. But to each their own, right? I'm just here to teach you the way I fucking see the markets and how I've analyzed shit and how it's worked in my favor. And so that was a bullshorter block,
[23:28] but a bearish order block is just going to be the first bullish candle after a sweep of buy side liquidity, which is confirmed by price trading below that newly formed bullish candle and then price uses that order block as support to push price lower right so i have it drawn out here price trades up
[23:42] see some buy side comes down and then once we print this bullish candle after starting to flip bearish if we close below it i look to see that wick as the ob and price usually wicks into it and then rejects like i said everyone trades order blocks differently this is how i found
[23:56] them to be very effective i'm going to show you some examples of order blocks now right so if i go over this exact example I just showed you what we see here price is going down we create this flow right here and so once we see this sell side we want to
[24:10] look for the first bearish candle to print and then for price to close above that bearish handle so that's our bearish handle right there and once price closes above this I just like to use a wick and that's our OB then I see price wicks into that order block right there and then it goes higher alright that's
[24:25] how I use order blocks like I said everyone uses it differently we can find more examples really quick. Alright let's look at this example here and this time we'll use an order block as a whole candle instead of a rake because this candle doesn't happen to print
[24:37] a rake but price trades up, seeps this buy side up here so now what are we waiting for? We want to see a bullish candle print and then a bearish candle close below it and that'll confirm the OB. So now we got a bullish candle so now as price closes below this candle this becomes our bearish
[24:53] order block and so you can see the price closes below it here and once price breaks into it they it rejects this order block. You can mark out the body, you can mark out the wick, you can mark out the bottom of the wick. This candle barely has a fucking wick, so I'd probably mark out the body
[25:07] in this case. And yeah, you can see your price rejection from there and trade lower. So I mean, order blocks to me, in my opinion, aren't like the best console. Some people love them. I'm not like the biggest fan. I think they're pretty solid. I personally just don't use them that much,
[25:21] right? To each, like I said, to each their own. You pick the concepts you like and how you want go about them but yeah like I said if I'm anytime I'm working on an order block I'll use the wick this candle I will make an exception because it doesn't have a way to maybe mark out the body I'm and that's what I'm working to see
[25:34] rejection from so I'm gonna find one more example and then we'll move forward alright so let's look at an example like this we have some sell side right here so once price keeps this sell side which we get right here and now we print this bearish candle after the sell side see this price closes above this bearish
[25:47] candle and this becomes our bullish order block I just don't even have a fucking thing for it because I don't even use them but price closes above this becomes our order block as you can see price waked into it right after right here and we traded
[25:59] higher this is why i like to use this method of the sweep after and then the candle that prints after and then the wick i found it to be very powerful but i don't even use them i don't even use them i'd be fucking lying if i said i use them i literally don't use them but this is how
[26:13] i determine ob's and maybe you like the way i trade them so maybe you want to trade them like this too but that's pretty much what an order block is all right next thing we're going to be going over is CISD. And CISD, to be honest, I actually really like CISDs, but I don't really
[26:28] use them often. I think one out of 15 of my trades is a CISD, and that's only when an IFBG isn't presented. But the way you should see CISDs pretty much is, let's say price is trending higher,
[26:40] right, and we go up. And it's kind of similar to a breaker block, but it happens, honestly, before the breaker block, in a sense. Whatever. Point is, I'll just show you what it looks like. So price makes a high, low, higher, high, and then it breaks lower.
[26:53] And so when it breaks lower, the last bullish candle here before we manipulated higher is going to be what we use as a CISD, but more specifically, just the end of the body or
[27:05] the body pretty much. So what does this look like, right? So if price is going higher here and we see price trade lower, create that swing low, and now we start trading higher. Once we break above this high, we have a higher high.
[27:19] If price comes back down and trades below this low right here, well, this is the last opposing candle, right? So once price trades below this low or this level right here, once we break below this bullish candle, then we get a CISD there.
[27:33] So I'll show you what that looks like. Price trades higher. And now if we trade below this bullish candle right here, this body, this becomes a CISD. And so price will typically react off that level. you'll see price wick into it and then start trading lower and i'll show you what that looks
[27:49] like in the opposite sense now so if you look at something like this you can see that here price breaks lower it sweeps this low and so the last bearish candle before we manipulated lower here is this bearish candle right but all i want to do is mark out the top of this bearish candle
[28:04] right here so once we close above here we'll get a cisd so bang price closes above uh right here and you can see how price waked into it immediately after and started trading
[28:17] higher so we got the close right here and then price wakes into it and then starts trading higher and that's like how I use TI's fees I'll try to find like one more example just reason I was a bit confusing for some people so if we look right here once price manipulates and suits this buy side which happens right here now we want to find the bottom of the manipulation leg And it would be this bullish
[28:39] candle right here. So once price closes below this bullish candle, we get a CISD and you'll see that price just wicks into it and then starts trading lower. All right. So this is the leg that sent us
[28:51] up and we want to find the last bullish candle here. And once price closes below that, we get a CISD. And so CISDs are good when you can't get an inversion entry. But that's something we could get into in another video. Now next, you got market maker models, sell models, buy models,
[29:06] whatever. They literally happen all the time. Do I really use them? Honestly, not really. Because market maker model, market maker sell model, is practically just another fancy way of saying, is price generating buy side or is price generating sell side? And once we can identify
[29:20] which of the cases that is, if we're generating sell side, then we want to wait for the market to start confirming that it wants to run all that sell side that's been previously generated. And if it's buy side, then we want to wait for price to confirm that we want to run all
[29:32] the buy side. So if we look in this sense here, right, as price is climbing up, ignore the clicking. I know it's annoying. We see price generating a bunch of sell side. Lows, after lows, after lows, after lows.
[29:46] Right, it's kind of like the similar concept of like LR, but this is a bit more extended, let's say. These are sell side levels being generated on the high top and left and right. And so the whole point of understanding market maker sell models and buy models is just being able to identify
[30:00] when price is ready to start taking all those. So now that we've seen that we've started creating what we call the beginning of this market maker sell model curve, and we can grab our curve right here and see that we're sort of creating like this arch, right?
[30:14] Where price is wrapping around, creating this rainbow effect. Then we want to start waiting for price to confirm that it wants to run this. to run this and once we see that price wants to start going lower that's when you'll hear people
[30:26] say oh we're in a sell model because we've identified that the price wants to take out all the sell signs so suddenly we're in a sell model and so we start getting confirmation through price wanting to trade lower we see the first low and when you see something like this now everyone's
[30:41] like oh we're in a sell model because clearly price wants to trend lower and take out more of this sell side and so we just use this to identify where the next key levels of the model can be but it's really nothing too serious honestly and so you can see the market decides to run those
[30:57] this sell side that we created and almost completing the cell model here but we don't complete it entirely in this case and go all the way down to this low but then you can start seeing okay in the process of price taking out all that sell side and trying to complete the sell model
[31:12] we've actually started generating a potential buy model because now suddenly we have a bunch of highs stacked and we could be going into a buy model soon, but we want to wait for that confirmation. And so the second we start seeing price go higher,
[31:26] we're like, oh shit, this could be the beginning of a market maker buy model. And so we mark out our curve. We're like, yep, it definitely looks like we could potentially go into a buy model here and start taking out all this buy side.
[31:38] And so it's as simple as being able to identify on what side of the curve are we trading? Is there more buy side for us to take? Is there more sell side for us to take? That is literally the only way I think about market maker models. I mean, in fact, I don't think about them at all.
[31:52] I never think about them. I never even say the name market maker model. That shit sounds corny to me, bro. But yeah, then you can see this market maker buy model is complete and price funds all these highs. That's the only way I would think about market maker models.
[32:05] Don't try to ask me more. Don't try to overcomplicate it. That shit is so stupid. Super stupid. Sorry, I'm a hater. Some of these concepts are dumb as fuck and they overcomplicate simple shows. And now the last thing we're going to go over is AMD, which is just Accumulation Manipulation Distribution.
[32:18] This is a three-sequence pattern in which price action moves, beginning with price accumulating, sideways price action, then manipulating, manipulating out traders by trading into a key level, and finally distributing, breaking past the accumulation zone and continuing to deliver.
[32:30] Now, the reason I actually fucking love this concept is because it helps understand what phase of the market you are at. So think about it this way, right? If you're trading during your session, but you notice that overnight, for example, Asia
[32:44] dumped a thousand points, what's most likely going to happen after a lot of distribution? You're going to be trading New York and session with a ton of accumulation. So realistically, the goal is to be trading during one of two phases, either the manipulation or distribution, but ideally almost always the distribution.
[32:58] And there's absolutely no damn reason to overcomplicate this one. This is as simple as identifying accumulation, which is sideways price action. We can see here that price is failing to break out of this range. We were just chopping around. And then we wait for manipulation.
[33:11] We see price break out of this range. And so a lot of the times, what's good about understanding this AMD is that if people see a breakout like this, they're thinking, oh my god, buy, buy, buy. We need to go into fucking loans. We need to go into loans. We need to go into loans. Well, you're going to get caught up in the manipulation.
[33:24] And price action is about to fucking dump. And then clearly you see that price starts thumping because we start going into the true distribution. So price accumulates, manipulates, and then it distributes right and this happens in both the bullish and bearish
[33:40] sense after so what's going to happen after price distributes for most like you're going to start going into the accumulation phase right after and you can see that price that's accumulating again and that's just how it is it's always happening what happens price accumulates accumulates once again
[33:55] accumulation manipulation distribution price should be slower and after distribution we get accumulation so you don't want to be trading during accumulation you can see here once again price accumulates it manipulates and then it distributes
[34:10] this happens all the damn time we can see them all patterns and we can see them in bullish hunts here price is accumulating sideways price action we're not really doing much we then break lower manipulate and now here what's most likely going to happen price is going to distribute and
[34:25] go higher right that's exactly what happens i wonder if you guys are getting insanely annoyed by the clicking sounds. There's really nothing I can do about it. I don't have a silent mic, sorry. But yeah, like I said in the beginning of the video, really, I only use fair value gaps,
[34:40] inverse fair value gaps, which is just, you know, the indolination of a fair value gap. Barside and sell side liquidity, of course, I use liquidity. And I love stuff like SMTs and even like AMD, right? But realistically, my strategy is as simple as fair value gaps
[34:53] and liquidity. I know it sounds crazy to think about, but it's the truth. And I've posted a video right before this about one of the strategies that I use that have paid me a shit ton of money so you can watch that and of course if you are interested in working with me and being one of
[35:05] my students and learning my model even more in depth then you can apply using the form below the mentorship program is incredibly in-depth so I'm not just handing you like a model in there it's a lot about my psychology how I go about my bias my drama quiddity I mean so much goes into
[35:20] this there's live calls every single day where we answer everyone's questions we do one-on-ones there's Sunday calls and then there's a shit ton of lessons in there I mean whatever I don't like yapping too much about this or shoving it down anyone's throat I could give a fuck what you do
[35:32] but it's always available to you guys if you just want to apply maybe join up and learn as one of my students and some of you are probably thinking what is the point of joining any of this shit if you're just giving out all this sauce on YouTube I don't think you understand I could give you as
[35:44] much sauce as possible on YouTube in the world for free but it really doesn't mean anything if you don't do anything with it I love helping people out more than anything it's just your job to be disciplined, to listen, to be open-minded, and above all, take action, right? You watching
[35:59] this video all the way to the end should say something about you. You were able to sit through this, digest information, and you have like this willingness to learn. Now just fucking apply it. You know exactly what you got to do. Don't think that you need all these concepts that I taught
[36:12] you. You don't need them literally at all. You can just grab two that you like, three that you like, and formulate an amazing strategy that can literally change your life. You don't need my strategy. You don't need anybody else's strategy. You could totally make your own, but if you're
[36:24] going to do it, go 100% into it and make the effort to follow your rules every single damn day. If your strategy is fucking SMP, AND, whatever, all the freaking D's, pause, then, bro, go for it,
[36:36] if that's what you like, but stick with it, you know? If you're listening right now and you're thinking to yourself, like, damn, I haven't really stuck with one thing ever in my life, then take this as a sign. I mean, I don't know if I'm just, like, going on a side yap right now,
[36:49] But if you guys were ever younger and you heard other people told you, like, bro, you're wasting potential. Like, you were good at sports, but you didn't want to commit to it. I was like, oh, you're just a waste of fucking potential. I fucking feel that, bro. I was like that a lot growing up.
[37:01] When I would play stuff, I'd be really good at it, but I wouldn't stick with it. And, you know, I'm grateful I finally took the leap of faith with something like trading and stuck with it. I just made an effort to get better every single day up until even now, bro. I still look to improve every single day.
[37:14] And that's really all it's about, just following a system and following your rules. everyone's system and rules that looks different but if you can follow it you're going to be successful and that's what's up but yeah i hope you guys like this video and i'll be pushing out
[37:28] more stuff like this i'm just doing a lot of the things you guys are requesting one of you guys asked for all the ict concepts so here's the ones that i kind of like so i don't know if i can whatever but all the same shit pp finger pp finger i'm gonna try to do you know when people like
[37:44] destroy a water bottle in like one second. I kind of want to try that real quick. Wait, I'm kind of scared. Fuck me. Fuck me. I'm so dumb. Fuck.
[37:56] Peace out, guys. Make sure to like, subscribe, and blow me a kiss. I'm here. I'm here. Blow it to me. Aw, thank you.
⚡ Saved you 0h 38m reading this? Transcribe any YouTube video for free — no signup needed.