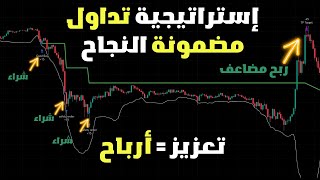

75% Success Trading Strategy Revealed
40sClaims a high success rate strategy for spot trading, sparking curiosity and debate among traders.
▶ Play Clip"The title promises a 'guaranteed' strategy, but the video admits it's not always successful and requires careful capital management."
This video presents a guaranteed spot trading strategy based on Bollinger Bands and Dollar Cost Averaging (DCA). The strategy involves buying when the price touches the lower Bollinger Band (with a 3.5 standard deviation) and accumulating positions as the price drops, targeting a 3% profit. The creator claims a 75-85% success rate on major pairs like BTC/USDT.
A guaranteed trading strategy for spot trading with 75% success on Acer/USDT and over 85% on Bitcoin, based on Bollinger Bands and accumulation.
Uses a standard deviation of 3.5 for Bollinger Bands. The price touching the lower band signals a potential bounce.
Enter when price crosses below the lower Bollinger Band and then crosses back above. Profit target is set at 3%.
Divide capital into multiple orders. First order is a small portion; subsequent orders are placed as price drops to lower average purchase price.
For $1000 capital, first order $100, then nine more $100 orders. Reinforce when price drops by 3% or 5%.
Recommended for large cryptocurrencies like Ethereum. Can be linked to a bot but manual trading is advised.
The strategy relies on DCA and Bollinger Bands to capture small profits without stop-loss, but it requires sufficient capital to withstand drawdowns. Success depends on disciplined position sizing and market conditions.
What is the standard deviation setting for Bollinger Bands in this strategy?
3.5
02:22
What is the profit target percentage in this strategy?
3%
02:38
What does DCA stand for?
Dollar Cost Averaging
03:08
How many reinforcement orders are recommended for a $1000 capital?
Nine orders of $100 each
07:50
What is the entry signal for the first trade?
Price crosses below the lower Bollinger Band and then crosses back above.
03:35
Why is a stop-loss not used in this strategy?
Because the strategy relies on accumulating positions as price drops to lower average purchase price.
07:21
What is the success rate claimed for Bitcoin?
Over 85%
00:17
Guaranteed Strategy Claim
Promises a high success rate but requires careful capital management.
00:02Profit Target at 3%
Small, achievable target reduces risk but may not cover losses in volatile markets.
02:38DCA Implementation
Key to the strategy; allows averaging down without leverage.
03:08Capital Division Rule
Practical advice for risk management: never invest all capital at once.
07:37[00:02] new video. In this video, I want to tell you about a guaranteed trading strategy for spot trading, or instant trading. This means we simply buy and accumulate, then achieve a specific profit percentage that we will determine. As you can see, the strategy has a
[00:17] As you can see, the strategy has a 75% success rate on the Acer currency pair ( USDT) for five minutes. We've started seeing it on Bitcoin with a success rate over 85%. It even works on multiple timeframes with a very high success rate. As you can see, this strategy has
[00:38] on the Bollinger Bands indicator and accumulation. That's it, very simple. I will give you all the details of the strategy so that you can apply it manually very easily. I will also teach you how to set up alerts so you don't have to sit behind the screen waiting for an alert to
[00:54] behind the screen waiting for an alert to enter trades. To learn more, and if you haven't subscribe. Every time I like the video, please subscribe. Like, let's get started together the video, please subscribe. Like, let's get started together
[01:14] one of the largest and most famous cryptocurrency trading platforms in the world. Through this invitation, we're offering free spot or instant trading for all cryptocurrencies. We're also holding a spot or instant trading for all cryptocurrencies. We're also holding a contest this month: anyone who
[01:29] registers on the platform and makes a $100 deposit through the link in the video description will receive $20 in two days at the end of this month. In addition, $5,000 will be distributed among five lucky winners who registered this month. Thanks to PayBit for sponsoring this video. As I
[01:47] mentioned, this strategy is based on the Bollinger Bands indicator. The
[02:08] are close together or moving, indicating a significant change in the bands, which become wider as they move. These bands change with a standard deviation, which we define. We can adjust the standard deviation in the
[02:22] Bollinger Bands settings. We adjust the standard deviation based on the standard deviation in the strategy. Today, I'll be working with a standard deviation of 3.5, meaning the bands touch the ground. The price is like the bowling lines, which have a standard deviation of 3.5, as the supervisors here have shown.
[02:38] We enter a trade and set our profit target at 3% because, as observers note, the 3% because, as observers note, the price's relationship with the lines is such that whenever the price reaches the upper line, there's a bounce downwards, and whenever it falls, there's a bounce upwards. However, this isn't always the case.
[02:53] Notice how the price touches the bowling lines, relaxes, and then continues moving, only to fall again, and bowling lines, relaxes, and then continues moving, only to fall again, and so on. The idea behind this strategy is that we enter our first trade based on the
[03:08] bowling line signal, or when the price touches the lower lines. The price doesn't fall further but strengthens, resulting in a lower average purchase price. This means we'll be using DCI or Dollar Cost Towers. Let me show you exactly how I mean the strategy so you
[03:23] understand 100%. Notice in this first example: the price breaks the lower bowling line. I've now removed all the other bowling lines except the lower one, which has a
[03:35] standard deviation of 3.5, and I've changed its color. There's a white line to make things easier for the eyes. As you can see in the first example, the price crossed the downward flange line and then crossed over,
[03:47] the price crossed the downward flange line and then crossed over, or the price rose or the price rose from below the Waalinger line. This is exactly the candlestick pattern where I enter with a portion of my capital. Now I'll explain the concept of capital in detail. I won't
[04:00] enter with everything I have at once because I need an amount to build up my position in case the price doesn't rise immediately to my profit target, which is Tuesday. This green line you see represents the average purchase price. So, I currently
[04:17] represents the average purchase price. So, I currently bought at this price, which is 16,593, and I want a 3% profit from this area. Let's
[04:33] at this price. To achieve my 3 % profit, the price needs to reach around $17,000 for Bitcoin. So, when I divide my capital, I have an opportunity to build up my position
[04:45] when I divide my capital, I have an opportunity to build up my position further as the price drops. Therefore, the average purchase price will... Let's look at this together. Notice here, at this Notice here, at this price, after the price of Bitcoin dropped by about 3%, I
[04:59] bought again with the same amount I bought with the first time. So the average purchase price, instead of being around 16.5970, became around 1600. So now I need the
[05:13] price to rise from this area. I've already invested a percentage, price drops again. Notice here, when the price dropped again, I increased my position, and
[05:26] the price, or average purchase price, dropped back to this green line. I already invested all my money. So now I need the price to rise 3% from this
[05:40] need the price to rise 3% from this area so that I can take my profit, which is three percent. Just three percent of the total amount. So, let's say I entered the first trade with $100 and increased my position with $ 500 or $1000. I will profit three percent from that. The
[05:55] total amount... Notice here, when the price rose again to about 3%, I made a profit. That's the general idea of the strategy.
[06:08] Let's look at other examples. Notice here, the same thing happened. Here, in this area, there was a downward crossover of the Bollinger Bands, and I bought at this point. Instead of rising, the price went down again. I bought again, and the
[06:20] at this point. Instead of rising, the price went down again. I bought again, and the average purchase price became lower. It went down again, and I bought again. The average purchase price went down again, and so on until it The average purchase price went down again, and so on until it reached this point. After that, I
[06:35] wanted 3% from this area, which is this green line you see in front of you. I this green line you see in front of you. I wanted about 3%, which is here, and that's how I made my profit to reach the total amount I had set. Now, wait a minute, this is the
[06:54] Notice that here, there was a crossover of the Bollinger Bands. The price went below the line and then rose again. Bollinger Bands. The price went below the line and then rose again. Here, I bought. The price didn't go up Here, I bought. The price didn't go up immediately; it went down to the area. Azaz returned, and after
[07:07] immediately; it went down to the area. Azaz returned, and after that, the average purchase price here became... and then, from here in this area, I need 3% to have taken my profit. So, with this strategy, we don't need a stop-loss order as much as we need to
[07:21] stop-loss order as much as we need to always have an amount to reinforce the position whenever the price drops further. That's why I always advise against anyone buying with their entire capital in any currency, because we are always exposed to unexpected price collapses.
[07:37] The idea behind this strategy is that you must first determine how much capital you have, then divide your capital and see how many reinforcement orders you can place. For example, if you have $1000, the
[07:50] first order is $100, then you have nine more orders, each $100, and you decide more orders, each $100, and you decide that whenever the price drops by 3% or 5%, you buy $100, or any percentage you decide. You don't have to stick to the numbers I'm telling you. And with each
[08:04] stick to the numbers I'm telling you. And with each reinforcement, you calculate your average purchase price. You set a reinforcement, you calculate your average purchase price. You set a profit of 2, 3, or 5 percent, whatever price you're happy with. Before I tell you about this indicator I'm working with,
[08:16] indicator I'm working with,
[08:42] Tricoma Bollinger Stability, it's recommended to use it on large cryptocurrencies like Ethereum, which has a high price. However, the strategy works with all cryptocurrencies and has a very high success rate, reaching 100% for some. I'll write the name of this indicator in the comments. Let me just show you the settings I've configured. Notice here in my Mbox that I can link the Tricoma bot I can link the Tricoma bot so that the indicator directly executes trades
[08:55] on the bot without my intervention. However, I don't recommend this. It's better for you to work with this particular strategy manually and learn it manually. Notice
[09:07] that I've specified my base order here: $15 for the first trade, $15 for the reinforcement order, and nine reinforcement orders. The first reinforcement order starts after the reinforcement orders. The first reinforcement order starts after the price drops by 3%. Here, I haven't
[09:22] price drops by 3%. Here, I haven't set a stop-loss plus, but I have set a profit, or take my profit at three percent. These are the settings below, which are like the viewers. Here, I have the the settings below, which are like the viewers. Here, I have the moon. Here, I have
[09:40] can see here in white, at three and a half. Notice how if I set it to four, it expands further, Notice how if I set it to four, it expands further, and notice how I start if I set it to one, for example. I and notice how I start if I set it to one, for example. I found three and a half to be very suitable because
[09:54] often, when the price touches or crosses the three and a half Bollinger Bands, the price will bounce upwards. Here, the crossovers are set to over, not under. This means that whenever the price falls, it should be
[10:09] under. This means that whenever the price falls, it should be below the Bollinger Bands and form a bullish class or cross them upwards, not every time the price falls directly.
[10:48] That's all about this strategy. I hope you liked the video. If you have any questions, write them in the comments below. Thank you for watching, and peace be upon the comments below. Thank you for watching, and peace be upon you.


⚡ Saved you 0h 11m reading this? Transcribe any YouTube video for free — no signup needed.