
Why You're Always Trapped in Trades
60sDirectly addresses a common retail trader frustration, promising a solution that feels like an insider secret.
▶ Play Clip"The title promises a high-accuracy strategy, and the video delivers a specific, actionable method with live examples, though it includes typical trading video fluff and a free PDF pitch."
This video presents a high-accuracy 1-minute trading strategy for binary options, designed to detect institutional liquidity traps using a combination of a tight price envelope and the DeMarker indicator. The strategy aims to catch short-term reversals by identifying overextended price movements, with a strong emphasis on risk management and disciplined execution.
Retail traders often use price envelopes to follow trends, but institutional algorithms use these same bands to hunt stop losses and trap early buyers, causing sudden reversals.
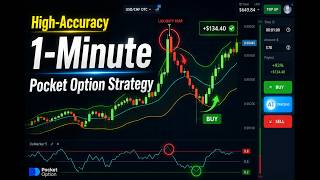
The strategy combines an ultra-tight 0.05% envelope with a fast 5-period DeMarker to isolate moments of price overextension, aiming to catch high-probability 1-minute reversals.
Trading binary options carries real risk and can result in capital loss. The presenter advises starting on a demo account and only going live after becoming comfortable with the strategy.
Use a 15-second chart with a 1-minute expiry. Set envelopes to period 10 with a deviation of 0.05%, and DeMarker to 5 periods with overbought/oversold levels at 0.8 and 0.2.
The strategy works best in stable, slightly ranging markets. Avoid strongly trending markets or when envelopes open wide, as the setup relies on price snapping outside the boundary.
Wait for a single 15-second candle to break and close below the lower envelope, while the DeMarker touches or drops below 0.2. Open a 1-minute buy trade at the close of that candle.
Wait for a single 15-second candle to break and close above the upper envelope, while the DeMarker touches or climbs above 0.8. Open a 1-minute sell trade at the close of that candle.
A red candle breaches the lower envelope, DeMarker drops below 0.2, triggering a buy trade. The market reverses upward, resulting in a clean profit.
A bullish candle breaks above the upper envelope, DeMarker spikes above 0.8, triggering a sell trade. The market reverses downward, resulting in a clean profit.
Even with perfect alignment, losses occur. A buy setup that followed all rules resulted in a loss because the market continued downward. The presenter emphasizes discipline and not forcing reversals.
A red candle breaches the lower envelope, DeMarker drops below 0.2, triggering a buy trade. The market snaps back upward, resulting in a clean profit.
The strategy relies on identifying overextended price movements and institutional traps, with a strong emphasis on discipline and risk management. Success is built on statistical probability over time, not on individual trades.
What are the two indicators used in the strategy?
Envelopes (period 10, deviation 0.05%) and DeMarker (period 5, overbought/oversold at 0.8/0.2).
01:21
What chart timeframe and expiry are recommended?
15-second chart with a 1-minute expiry.
01:06
What are the conditions for a buy setup?
A 15-second candle closes below the lower envelope, and DeMarker touches or drops below 0.2.
02:02
What are the conditions for a sell setup?
A 15-second candle closes above the upper envelope, and DeMarker touches or climbs above 0.8.
02:28
Why does the strategy avoid strongly trending markets?
Because the envelopes open wide, making the setup less reliable.
01:49
What is the purpose of the ultra-tight envelope?
To isolate moments of price overextension and detect institutional liquidity traps.
00:27
How should a trader handle a loss according to the video?
Accept it as part of the business, avoid panic, and stick to the plan.
07:49
Institutional Trap Detection
Explains how retail traders are exploited by institutional algorithms, providing a core insight into market mechanics.
00:14Specific Indicator Settings
Provides exact parameters for the strategy, making it actionable for viewers.
01:21Clear Entry Rules
Defines precise conditions for buy and sell setups, reducing ambiguity.
02:02Handling Losses
Demonstrates that even perfect setups can fail, emphasizing the importance of risk management.
06:27Statistical Edge Over Time
Stresses that success is built on probability, not individual trades, a key principle for traders.
08:19[00:01] enter a trade based on a strong breakout, the market immediately reverses and leaves you in the red? You aren't unlucky. You just fell into an institutional liquidity trap. See, most retail traders use price envelopes to
[00:14] follow trends, but big institutional algorithms use those exact same bands to hunt your stop losses and trap early buyers. In this video, I'm going to show you how to flip the script. We are turning the popular DeMarker indicator
[00:27] into a trap detection tool. By combining an ultra-tight 0.05% envelope with a lightning-fast five period DeMarker, we will isolate the exact seconds where price overextends, allowing us to catch high probability
[00:40] one-minute reversals right as the trap springs. But real quick, before we dive in, trading binary options carries real risk and you can absolutely lose capital. I'm not here promising profits or guaranteeing results. I'm simply
[00:53] that has worked for me in my own testing, and I want you to approach it the exact same way. Start on a demo account, watch how the data behaves, get comfortable with the rhythm, and only
[01:06] then consider going live. With that in mind, let's set up your platform for fast-paced execution using a 15-second chart and a strict one-minute expiry. First, load up your envelopes, set the period to 10, and bring that deviation
[01:21] period to 10, and bring that deviation down to an extremely narrow 0.05%. Next, add the DeMarker indicator, set it to a fast five period, and make sure your overbought and oversold levels are locked at 0.8 and 0.2. Look at how tight
[01:36] aren't trying to ride a trend here. We are waiting for price to violently snap outside this boundary. When a single 15-second candle pushes completely outside these bands while the DeMarker hits an extreme level, it tells us the
[01:49] market has exhausted its temporary momentum. But discipline is everything. You must avoid strongly trending markets or environments where the envelopes open up wide. We want a stable, slightly ranging market where the very first
[02:02] winning ratio. Let's break down the exact execution rules so you can spot these setups flawlessly on your own charts. For a buy setup, you are waiting for a single 15-second candle to break and close
[02:16] line. At that exact same moment, look down at your five-period D marker. It must touch or drop below the 0.2 line. As soon as
[02:28] that specific candle closes, you open your 1-minute buy trade. For a sell setup, the logic completely mirrors this. A single 15-second candle must break and close completely above the upper envelope line, while the D marker
[02:42] simultaneously touches or climbs above the 0.8 line. The moment that candle closes, you immediately open a 1-minute sell trade right on the next candle open. Now, to make this second nature for you while you're trading, I've put
[02:56] together a free PDF guide for this exact strategy. It includes the complete buy and sell checklist along with a quick reference entry card you can keep right The link is right down in the description below, so go grab it real
[03:10] what's coming up next. Because reading rules on a static screen is one thing, but seeing how the market moves in real time is where the real education happens. Let's pull up the live charts right now so I can show you exactly what
[03:23] a false breakout looks like versus a high-probability first breakout setup and how to spot the warning signs to avoid losing trades entirely. Let's look at a live example to see exactly how this liquidity trap plays out in real
[03:35] time. Look closely at that aggressive red candle. It has completely breached and closed outside our lower ultra-tight envelope boundary. five-period D marker indicator. It didn't just touch the lower threshold,
[03:49] it pushed entirely below the oversold level. This confirms that the sharp downward push is a temporary overextension rather than a sustainable trend. The moment that 15-second candle closed, a buy trade was placed
[04:02] immediately with a precise 1-minute expiry, catching the market right at the point where retail sellers are being trapped. Moving into our second phase, you can see the trade in full progress. This is where market psychology becomes
[04:15] fascinating to observe. After our entry, the very next candle immediately prints as a strong bullish candle, rejecting that lower zone completely. Finally, the trade has closed out completely, securing a clean result. The market
[04:28] moved exactly as the structural mechanics predicted, reversing heavily our initial trigger line. Now, let's find another perfect trade setup as per our strategy. Now, let's flip the perspective completely and
[04:42] analyze a textbook sell setup to see exactly how an institutional upper liquidity trap forms in real time. Look closely at this aggressive bullish candle aggressively breaking out and closing completely above our upper
[04:54] ultra-tight envelope boundary. Simultaneously, if you look right down at the five-period D marker indicator, it has spiked directly past the overbought threshold line. This double confirmation tells us that the immediate
[05:08] upward buying pressure is completely exhausted and highly unsustainable. The exact second that 15-second candle locked in its close, a sell trade was executed instantly with a precise 1-minute expiry to catch the exact
[05:22] moment the trap springs on early buyers. Moving right into the second phase, we reaction and how beautifully the geometry plays out. Right after our entry execution, the market instantly
[05:34] reacts to the liquidity pool, printing a massive solid bearish candle that slams price directly back inside the envelope bands. This swift downward reversal is driven by institutional sellers stepping into the market and forcing trapped
[05:48] buyers to liquidate their positions. As the next few candles build out, the DeMarker line also hooks sharply downward, confirming the shift in short-term momentum. With price dropping drastically lower and holding deep in
[06:00] our profit zone, the structural validity of this high probability setup is on full display. Finally, looking at the third phase, the contract has officially expired and closed out with a perfectly clean result. The market followed our
[06:13] structural rules to the absolute letter, rejecting the overextended zone completely and locking in well below our initial trigger line. Now, let's find another perfect trade setup as per our strategy. Now, it is
[06:27] crucial to understand that even when every single indicator aligns perfectly, the market will occasionally do something unexpected. Let's break down a setup that followed our strategy rules exactly, but resulted in a loss, to see
[06:40] how a professional handles real risk. Look closely at this aggressive downward movement. A strong bearish candle slices completely outside our lower ultra-tight envelope boundary. Simultaneously, looking at the five-period DeMarker
[06:54] indicator, it has dropped deep into extreme oversold territory. The technical rules are met flawlessly, signaling an institutional overextension trap. The moment that 15-second candle closed, a BUY trade was executed
[07:08] immediately with a strict 1-minute expiry, expecting a swift upward snapback into the bands. Moving into the second phase, you can see the trade in full progress, and it immediately reveals a completely different market
[07:20] dynamic. Instead of rejecting the lower zone as we usually expect, the institutional momentum breaks through our zone, and the price continues to paint consecutive bearish candles lower. Even though the DeMarker remains highly
[07:33] override the short-term boundary, refusing to snapback inside the envelope. This is exactly why we emphasize an education-first approach. panic, and we don't try to force a reversal by adding multiple positions.
[07:49] according to our original plan. Finally, looking at the third phase, the contract has officially expired below our entry point, resulting in a loss. discipline is what separates professional traders from amateurs.
[08:04] The setup followed our structural rules perfectly, but market dynamics shifted, and that is simply part of the business. One loss means absolutely nothing to our long-term plan because the edge is built on statistical probability over time.
[08:19] Now, let's find another perfect trade setup as per our strategy. Let's jump right into the live charts to analyze a perfect buy execution setup and see how the market geometry behaves in real time. Look closely at this
[08:32] sudden aggressive red candle slicing completely down and closing well outside our lower ultra-tight envelope boundary. Simultaneously, if you look right down at the five-period D marker indicator, it has dipped sharply below the extreme
[08:47] oversold threshold line. This double confirmation tells us that the immediate selling pressure has completely overextended, creating a textbook institutional liquidity trap. The exact second that 15-second candle locked in
[08:59] its close, a buy trade was executed immediately with a precise 1-minute expiry to catch the exact moment the market snaps back. Moving into the beautifully the market responds right after our structural entry point. The
[09:13] very next candle immediately prints as a massive solid bullish candle, rejecting that lower trap zone and driving price straight back inside the envelope lines. This rapid upward push is the direct result of institutional buyers
[09:26] aggressively entering the market, squeezing early retail sellers out of their short positions. As the next few candles build out, the price continues to climb higher and holds firmly above our entry level,
[09:38] validating our disciplined execution while the D marker hooks steadily back toward the center of the panel. Looking at the final phase, the contract has officially expired deep in our profit zone, securing an incredibly clean,
[09:50] successful result. The market followed our mechanical parameters to the absolute letter, reversing sharply off the overextended liquidity zone and closing well above our initial trigger line. This case study is a perfect
[10:03] waiting for the right first breakout scenario will always beat chasing random market movements. Managing risk and trusting verified data over emotion is how you build a consistent edge in this business. If you want to master this
[10:18] high accuracy data-driven approach to reading market geometry, make sure to notifications, and join our trading community so you never miss an upcoming breakdown. Thank you so much for watching. Keep your risk managed, and I
[10:31] watching. Keep your risk managed, and I will see you in the very next video.




⚡ Saved you 0h 10m reading this? Transcribe any YouTube video for free — no signup needed.