
From $500 to €55K/Month Trading
50sHigh earning claim with humble starting point creates curiosity and aspiration.
▶ Play Clip"Title promises a simple strategy for €55k/month; video delivers a clear method but emphasizes it's not easy and requires sacrifice."
A trader shares his 11-year journey from a $500 account to earning tens of thousands monthly, emphasizing simplicity, moderation, and repetition as core pillars. He reveals his daily and hourly chart strategy for identifying market extremes and reversals, and critiques the trading industry's distractions.
Spent 3 years testing strategies, losing money, then became profitable with an audited track record, now earning tens of thousands monthly from a $500 start.
Simplicity (simple, repeatable strategies), moderation (focus on losing little to last long), and repetition (learning from repeated patterns).
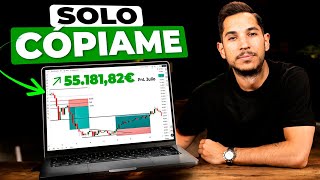
Shows Interactive Brokers statement with €55,352 profit in a month, representing 4.91% time-weighted return.
Criticizes funding companies, brokers, and gurus for profiting at traders' expense through exams, scalping, and smart money concepts.
High win rate due to close take profits, risk-reward ratio of 0.80, and maximum drawdown of 4.33%.
Traders fail because they don't understand what they're doing, misled by methods and products without proper depth.
Uses daily timeframe for direction (oversold/overbought extremes) and hourly for entry patterns, focusing on fractality.
Demonstrates a buy trade on a daily oversold condition, hourly structure change, and entry on 5-minute chart with Fibonacci and moving average.
Success requires adapting trading to your personality, routine, backtesting, personal development, and sacrifice beyond technical skills.
Profitable trading hinges on simplicity, repetition, and personal adaptation, not complex methods. The trader's approach uses daily extremes and hourly fractals, but long-term success demands discipline and sacrifice.
What are the three pillars the trader bases his success on?
Simplicity, moderation, and repetition.
01:53
What was the trader's monthly profit shown on the Interactive Brokers statement?
€55,352.07 profit, representing 4.91% time-weighted return.
04:32
What is the trader's win rate and risk-reward ratio?
Win rate is 56% (excluding break-even trades) and risk-reward ratio is 0.80.
07:53
What is the maximum drawdown the trader experienced in the year shown?
4.33%.
08:23
Why does the trader say most traders fail?
Because they don't understand what they are doing; they are led astray by methods and products without proper depth.
10:31
What two timeframes does the trader use for his strategy?
Daily timeframe for direction (oversold/overbought extremes) and hourly timeframe for entry patterns.
11:29
What does the trader look for on the daily chart to enter a trade?
An extreme (oversold or overbought) with a slowdown in price movement, indicating a potential reversal.
12:12
What concept explains that patterns repeat across all timeframes?
Fractality.
16:42
In the real trade example, what was the entry trigger on the 5-minute chart?
Price breaking above a diagonal trendline or moving average, indicating a structure change to higher highs and lows.
26:42
What does the trader say is the only way to do things right in trading?
Find something that suits you, adapt it to your personality, and follow a routine with backtesting and personal development.
29:32
Three Pillars of Success
Core philosophy that anyone can replicate: simplicity, moderation, repetition.
01:39Monthly Profit Proof
Concrete evidence of €55k monthly profit with 4.91% return, validating strategy.
04:32Industry Critique
Sharp criticism of funding companies, brokers, and gurus exploiting traders.
06:32Why Most Fail
Identifies root cause: lack of understanding due to information overload.
10:31Fractality Concept
Key technical concept that patterns repeat across all timeframes.
16:42[00:02] interested in trading until I was able to make a living from it. I spent 3 years testing dozens of strategies, indicators and new methods, losing huge amounts of money and hours in search of the best
[00:18] trading strategy to be profitable and live off trading. And today I can not only say that I have worked on the trading desk of a private bank and that I have an audited track record with a good annualized return, but I
[00:30] also earn tens of thousands of euros a month. And all this starting with an account of $500. So in today's video I'll show you So in today's video I'll show you how I was able to earn
[00:50] easy strategy do I use to achieve these results? You'll see how the strategy is actually implemented. And I'll make a short reflection at the end so you understand the reality of why so many people make a living from trading,
[01:04] but most fail. Also, remember that below in the first video description you will find all kinds of links of interest such as courses, tutorials, training, trading strategies, all 100% free content so you can
[01:18] continue training as a trader without having to invest your money. So, having to invest your money. So, having said that, let's get to the video. having said that, let's get to the video. [Music]
[01:39] successful in trading. However, I haven't succeeded because I'm smarter than you, because I have more money than you, or because I have any greater advantages than you . I have been successful because from minute one I have treated it as a
[01:53] real profession, because I have made countless sacrifices during these last 11 years, because in moments of frustration I have never thrown in the towel, and because from minute one I have focused trading on three
[02:07] basic pillars that anyone can replicate. The first of these is simplicity. I have always wanted to operate in a simple, straightforward, and understandable way. I have never let myself be misled by new methods or strategies that constantly
[02:23] emerge from nowhere and complicate what is not complex, which is understanding how the market works and applying basic trading strategies that are repeated over time and are profitable in the long term. The second one is
[02:37] moderation. I started 11 years ago with only $500 and just as my personality is quite reserved, as anyone who knows me knows, I approached the field of trading in the same way; I didn't have much money, so my goal
[02:51] wasn't to earn a lot, but to lose little. And by losing little by little , I was able to last long enough to stop making the mistakes that prevented me from being profitable and start
[03:05] making the right decisions that did allow me to be profitable. And the third one is repetition. I am a person who learns a lot and very quickly by observing others, listening, reading, and watching. So
[03:19] I knew that if I found a method, strategy, or philosophy that was constantly repeated, that I could observe, analyze, and improve day in and day out, I would reach my goals sooner than if I looked for something more
[03:34] complex, less repetitive, and harder to find. Thanks to these three points I just mentioned and my approach to both analysis and strategies, which we'll see a little later in the video, I'm
[03:47] able to generate regular income like the one you're about to see . This is a monthly statement from the broker I've been using for 9 years, Interactive Brokers. Here you can see that it is
[04:03] clearly a broker with my name on it, and you can see that the account type is individual and it is also a margin account. It's an Interactive Brokers broker that I've shown on other occasions. For example, in a video where he
[04:18] lost €10,000 in a matter of hours in a single trade, or also in different trading courses. As you can see, the total losses and gains for the statement period. Remember that it's a
[04:32] monthly statement, not daily or weekly, but it's not annual either. They amount to but it's not annual either. They amount to 55,352.07
[04:45] and it is an account that I currently have set in euros, that is, €55,352.07 profit. At other times I have had to or wanted to teach periods of losses, such as the case in which I taught that loss of $10,000 and in
[05:02] this case I am teaching profits. In this section here you can see that due to interest and issues related to the liquidity of the account, the return is lower, it is
[05:18] The point is that this return represents, as you can see from the time-weighted rate of return, 4.91%. In other words, these €55,181.82 represent 4.91%
[05:34] of my account. And this concept is very important because, as I say, it indicates the time-weighted rate of return and is the method used by managers to measure the pure profitability of the portfolio, that is, isolating the impact
[05:50] that income or capital withdrawals can have. I have earned € capital withdrawals can have. I have earned € 55,181.82 through trading, 55,181.82 through trading, and this represents 4.91% of my
[06:03] account. And obviously this is not always the case. As you can see, there are months in which I earn considerably less, and there are months in which I not only earn less, but I obviously lose money. It's obvious, you can't always win. And do
[06:19] you want to know what the best part is, or at least what fills me with the most pride? I started 11 years ago with $500 in my account and I'm achieving all this without having to follow the abusive rules of a
[06:32] funding company. Because yes, indeed, years ago to make a living from trading we didn't need funding companies, we didn't have to operate scalping, nor did we have to follow smart money concepts. Ultimately,
[06:45] we didn't need to follow the rules that are currently imposed by all the people and entities that are part of the trading sector and that constantly make money Well, everyone except you, of course, because they make money at your expense.
[06:58] Funding companies make money when you buy exams, attracted by the huge amounts of money you can handle without having earned it. Brokers make money when you scalp, attracted by the apparent
[07:11] ease with which money can be made trading in the short term. And the new gurus make money when you buy smart money and ICT training courses, attracted by the false feeling that it's the best way to trade there is.
[07:24] And now I will discuss the problem that, in my opinion, causes most people in the trading world to not be profitable, and then I will talk about strategies, methods of analysis, and as I have mentioned and promised, I will end with a
[07:37] reflection. But first, I want to show you some of the statistics from my trading journal. This is the site where I format Excel; I'm old school. I record all the trades I execute, including
[07:53] initial capital, current capital, win rate, and win rate excluding break events. As you can see, I have a fairly high win rate. This is fairly high win rate. This is simply because I like to move quickly to
[08:07] simply because I like to move quickly to very close take profit zones. I am able to execute entries very precisely, adjust the stop loss or interests me and what the strategy dictates, and still get a
[08:23] risk-reward ratio of even 0.80, which means I can execute that position simply because of the win rate I have. Here, as I say, you can also see the maximum drawdown I have had during this year of 4.33%, which is about
[08:40] during this year of 4.33%, which is about This is also the reality of trading. This is what we have to endure, and what a person who wants to remain in this world has to be able to
[08:54] withstand, each to a greater or lesser extent, depending on their capital, their strategy, their win rate, etc., etc., in order to last. In other words, in order for me to be able to bring a statement of a month in which I earn an amount x of
[09:08] money, I have to accept that there will be times when I will lose an amount and that I will not be happy about it . Therefore, in this case I am showing you this simply so that you can see and be aware of what
[09:22] this profession represents and what it means . There are great moments when you can reap great benefits, but the greater the potential benefit, the greater the potential loss. And if you're there for the
[09:34] good times, you also have to be able to be there for the bad times. Having said that, and very quickly, trading is not programming, it is not painting, it is not regardless of whether they are more or less difficult, I won't get into that, have
[09:49] nothing to do with trading. If you want to be a good programmer, study a lot of programming. If you want to be a good painter, study a lot about painting. And if you want to be a really good photographer, study photography a lot.
[10:02] However, if you want to be a good trader, you don't have to study only trading. To begin, what is trading? No, trading is theory, it's also strategy, it's also analysis, it's also risk management. But
[10:16] trading is also routine, it's also habits, it's also emotions, it 's also reflection. In short, trading has many aspects that can explain why a person may not be profitable. However, given my
[10:31] regardless of not being the best trader in the world, nor do I pretend to be, that experience is not insignificant. I dare to offer a specific and general reason why so many people fail, and that is that they do not understand what they
[10:46] are doing. In other words, they are led astray by methods, promises, people, courses, all kinds of elements that sell products, and they are never able to understand what they are doing. Basically because they are
[11:02] also not able to properly delve into any of the products they are acquiring. The solution to all this is to give a simple and repetitive approach to what you are doing. And what I'm going to do
[11:15] next is show you, through two simple timeframes, how I approach trading, what I do, what I do n't do, and the reasons why I'm able to achieve the returns I 'm getting.
[11:29] Remember, I'm not smarter than you, nor have I had more money than you, I've simply found something that is repetitive, that is simple, that suits me and I've been doing it for 8 trading is based on starting from two basic timeframes. A
[11:44] large timeframe in which you will try to find the direction of the next two or three candles through different technical elements and concepts, and a small timeframe in which you will try to find the pattern that
[11:57] you consistently trade to be profitable. What I generally do is use the daily timeframe as a larger timeframe, since the trading style I like the most is day trading and what I do is focus on
[12:12] the extremes of the market. When the daily chart is in this intermediate zone, generally speaking, I don't really care, I'm not interested. I'm interested in finding the daily chart at an extreme, either the
[12:25] at an extreme, either the lower extreme or the upper extreme. Why is this? Basically, because
[12:37] liquidity that we find specific movements. So, what am long time frame. And second, short timeframes. The large daily seasonality. What do I want to see on the daily news? The two extremes. What am I
[12:50] trying to see in those extremes? Point number one, that the price arrives oversold or that the price arrives overbought. That is, it reaches the bottom under accelerated motion or it reaches
[13:03] the top under accelerated motion . Because? Because that will give me an advantage. The market tends to be equitable, it tends to balance itself. When you've gone up three, you usually correct something proportional to three.
[13:19] When you've gone up by two, you usually correct something proportional to two. And regardless of whether this movement can continue in the initial direction or whether this movement from here can continue in the
[13:33] initial direction, if I start to see certain structures both in the daily timeframe and in lower timeframes, which we will talk about now , I can execute entry positions. So, at the moment when
[13:46] I already have an overbought or oversold structure, it doesn't matter to me, we're going to use the overbought condition to look for a short move. What do I want to see in this
[13:58] daily chart? I want to see that in the final part of this graph we start to slow down. The market can move in an accelerated or decelerated way, there's no other way. When we move at an accelerated pace, regardless of whether it is
[14:12] an impulsive movement or a corrective movement, it makes no difference to me. When we move at an accelerated pace, we are moving with consensus, with direction, with clarity, with strength, with unanimity regarding what is
[14:25] happening. Therefore, if I reach a resistance zone, for example, or an upper extreme of the market, call it what you will, and I see that the market is moving at an accelerated pace, what I will think is that there is consensus and
[14:39] unanimity regarding this movement, so I will not be interested at all in looking for a counter-trend movement. However, the moment I detect a slowdown,
[14:53] I detect doubts, I detect uncertainty, I also detect that orders in the opposite direction begin to come in, because if the only things coming in here are purchases or more purchases than sales, the price will continue to move
[15:07] strongly and we will continue to see accelerating candlesticks. However, when sales begin to accelerating candlesticks. However, when sales begin to of purchases, what we start to see is that the price stops rising
[15:22] sharply and begins to slow down until it reaches a point where it starts to reaches a point where it starts to turn. Therefore, simply through a very easy, very simple, very calm daily timeframe, by
[15:36] searching and waiting for the price at two extremes, not 20 zones, not 20 situations, not 20 reasons, just two. And by understanding the basics of supply, demand, liquidity, and how this is reflected in the candlesticks, I am
[15:54] this is reflected in the candlesticks, I am able to understand that the next two or three daily candlesticks are going to go in the opposite direction. Note, this does not come here. This simply means that due to overbuying,
[16:11] means that due to overbuying, due to the extreme market and due to the number of sellers, in this case, who are taking advantage of this same situation, the price is slowing down and the slowdown is the step prior to the reversal and what I
[16:27] want is to be part of this reversal. So, how am I going to be part of this shift? in the following time frame and it is the hourly time frame. Because? Because the market has a very important characteristic, and it is a
[16:42] concept called fractality. Fractality indicates that everything repeats itself across all timeframes, and that just as the market forms moving average crossovers, technical patterns, candlestick patterns, and fire
[16:57] value gaps, any concept you want on a daily chart also forms them on an hourly chart. and they also create a one-minute graph for us. So , when I switch from a timeframe to an hourly chart, what do I
[17:11] see? What I see is that instead of rising straight up towards the resistance zone, the price has risen in
[17:26] impulses and pullbacks. Longer impulses and pullbacks, obviously also longer, but ultimately the market moves
[17:38] through higher highs and higher lows. when there is an upward trend and decreasing highs and lows when there is a downward trend. Well, this structure here is this structure here. And if I want to see the price
[17:54] change from an uptrend to a downtrend, what do I need to look for? that we stopped making increasing maximums and minimums and started making decreasing maximums and minimums. Because this braking structure that we have seen
[18:07] here on the daily chart, many times on the hourly chart it will translate as the following and it is like a structure of, for example, a double top or some kind of reversal or some kind of much more
[18:22] detailed braking. So, at the moment when I see the price turn around I see the price turn around , here we have a first part , here we have a first part which is the daily brake.
[18:35] This is the daily brake. Here it is. Here we have the upward trend. So after the upward trend and the slowdown, what comes next? The
[18:49] downward trend, which is precisely this part here. downward trend. Here we have the same thing: the bullish trend, the brake trend, and the bearish trend. Well, at the extreme end of
[19:06] the entire daily structure, what I'm going to look for is the same thing, but in reverse: a succession of decreasing highs and lows to execute a sell position at the moment when the price surges, pulls back, and
[19:22] continues. Note, this will likely be a continuation that will probably take the price back down to the lower end. No, not at the lower end. No, not at all. It will be a movement that, unless it continues to
[19:37] grow, will simply fall a little, and then what will happen? Well, that will probably drive the price up again. Why not? That depends, doesn't it? But if the
[19:49] price on the one-hour chart is going up, what does this mean on the daily chart? This implies that the price on the daily chart will fall and then rise again. And if
[20:04] and then rise again. And if the one-hour chart is doing this from here, what will this mean for the daily chart? The daily chart is forming a double top, which is literally the same pattern that led me to look for a
[20:17] trend reversal on the one- hour chart. Therefore, we will not be seeing a daily pullback that translates into decreasing highs and lows on an hourly chart, but we will already be seeing decreasing highs and lows
[20:31] on a daily chart that turn into a pullback, for example, on a weekly chart. Because? Because the market is fractal and this is
[20:43] Because the market is fractal and this is simply what I'm looking for: these three basic, simple, straightforward concepts, with the most natural aspects of trading, with the most primitive aspects of technical analysis, which also form the
[20:58] basis of how the market moves. Nothing simpler, nothing easier. Well, all of this is what allows me to generate profits constantly. And now what I'm going to do is show you a real example of a trade structure, step by step, with the
[21:15] entry and exit points so that it's much clearer in a real situation how I execute this market pattern. Okay, let's go with that real trade example, in which you can see step by step how I execute this structure
[21:30] and with an example using charts, with real candlesticks, not lines, how the market behaves. The first thing is to understand what is most basic, and that is finding the
[21:42] extremes of the market. Here at the top we have a clear resistance zone where the price has consistently been rejecting it. But then if we go to a slightly lower area we can see that
[21:57] here too we find another extreme. This is another extreme simply because we have repeatedly rejected this horizontal zone, which allows us to understand that there is liquidity both at the top and the
[22:12] bottom. So what we're going to look for is a daily chart. In this case, the timeframe is a daily chart that is oversold and reaches this lower part
[22:24] or overbought and reaches this upper part. In this case we have an oversold condition that has not yet reached the area we are interested in, so the area we are interested in, so we discard it for now, but quickly,
[22:38] instead of moving back to the upper part, the price attacks this lower area again. So when we arrive and make contact with her, here she is, we'll see how it goes little by little . Notice that as I keep moving
[22:51] forward, forward, forward, it seems that the daily chart starts to slow down. There is a fairly clear difference between
[23:03] certain types of candles. For example, these strong opening candles here, these strong opening candles here, and these candles here in which, because of
[23:15] the area we are in, we can see that more and more buy orders are starting to come in. If more and more sell orders continued to come in , what would happen to this level? that it would break and come to look for
[23:27] a lower zone, which is the last extreme of the entire market, since here we have another quite clear level. Notice that when the price reaches this lower zone, it comes in strong, slows down, and turns around. It arrives fast,
[23:39] slows down and turns, it arrives fast, slows down and turns. It's magic, is it a coincidence? No, it's causality. Causality, simplicity, and repetition. The same thing keeps
[23:52] repeating itself. Well, we already have that end of the market. Point number one. Point number two, we begin to see how we slow down. And point number three, not only are we starting to see how we're slowing down, look, but we're
[24:07] also starting to see how the price is turning. This here is a candlestick pattern in which the first stage of the candlestick tests certain lower levels, but ends up closing in the upper zone of the candlestick above the openings of
[24:23] the third, thus forming a bullish structure. That said, let's go down to the one-hour chart. Because? Because on a one-hour chart, what is it that we want to see? Changes in structures, changes in trends. And in
[24:38] this case we are going to remove this 200 moving average, since it is not useful to us and what we are going to wait for is for the price to form a new corrective movement. Notice that up until now, the structure and this downward movement of the
[24:53] daily chart, how has it been represented in a one-hour chart? through constant impulses and pullbacks, constant decreasing maxima and minima. Therefore, if we understand that we have reached a support zone, an
[25:08] extreme of the market, oversold, that we have slowed down and that we are turning around, what has to happen on an hourly chart? Let's start seeing highs and lows, but on the rise, something that has already happened. So, at this point, very
[25:21] simply, what we do is draw Fibonacci from the lows to the highs and wait for the price to touch both the 0.618 touch both the 0.618 retracement level and the
[25:35] retracement level and the 50 exponential moving average. Here we see that let's extend that Fibonacci structure. There she is, from the beginning to the end of the impulse.
[25:47] Notice that what we have seen is a structure in which the highs are getting smaller and smaller until what has happened is that we until what has happened is that we have broken the last high and for the
[26:01] first time we have stopped making decreasing highs and lows to decreasing highs and lows to make increasing highs and lows. So all we have to do is wait for the price to drop again
[26:13] to form another higher low, and then we can place a buy order and participate in this upward trend. So at the exact moment when upward trend. So at the exact moment when the price on the one-hour chart
[26:28] the price on the one-hour chart reaches this area of the 50 moving average and Fibonacci levels, that is, here what I am going to do is execute the position. How do we execute it? Simply on a 5-minute chart.
[26:42] This is very simple, since through a diagonal or through a moving average, which is what they are for, we can mark that entry point. So the moment the 5- minute chart breaks that structure, there it is
[26:58] , we execute a buy order. Notice that everything has been repeated in all time periods. The market is fractal. The same structure that caught our attention on the daily chart, we have seen on the
[27:12] hourly chart and we are seeing that same structure on the 5- minute chart, since the price has stopped making lower highs and lower lows and is starting to make higher highs and higher lows , so we would simply
[27:26] set the position size. Perfect, there we have it. We would place the buy order, put the stop loss below
[27:38] buy order, put the stop loss below Fibonacci level, and the take profit here at the top. Hey, but it gives you a very low risk-return return. Yes, that's how it is, but that's how I
[27:54] Yes, that's how it is, but that's how I operate. This is how I earn €55,000 a month. Obviously not every month or anything like that , but that's what I do. And that's how I have a 56% success rate. It's
[28:07] not that I say so, it's not that I feel like it , no, it's not just numbers. With a 1.6% risk-return, I'm more than covered, because I simply need to understand how the market moves,
[28:20] how these types of structures are formed, and what the foundations of these types of movements are. And we can quickly see how the price comes to the take profit zone, giving in this case a result of 6,570
[28:36] of 6,570 AUD, which is obviously much less than what I expect to earn for each of the trades. And as I promised at the beginning of the video, I want to share a short reflection to explain why
[28:48] I am not only profitable trading, not only live off trading, but also have months in which I earn €55,000 in a single month. This will be a reflection that goes far beyond the technical, the
[29:03] strategic and what we have seen so far . Over the dozens and dozens of ways to methods, philosophies, even
[29:16] hundreds, and the more money the trading industry generates, the more ways, new methods, and new techniques emerge. However, regardless of the many ways to be profitable, there is only one way to do things right. I
[29:32] understand that nowadays it's difficult to focus on something. I understand that it's very easy to receive advertisements for new methods, new types of gurus, fake people posing as traders, and everything that rots
[29:45] this industry from within. But the reality is that what you have to focus on, beyond whether it's smart money, algorithmic tricks, whether you use indicators or not , whether you trade with leverage, without funding accounts,
[29:59] without stocks, Forex, cryptos, it doesn't matter, you have to find something that suits beginning of the video? Let me tell you about the three specific pillars on which I have based all my trading, everything I have done during these last 11
[30:14] years. And these three pillars are subjective, they are mine, they are elements and subjective, they are mine, they are elements and resources that were part of me. These were resources that were part of me. These were situations or ways of doing things that aligned with what
[30:27] I wanted, that converged with my interests and my way of being, and that have brought me closer and closer goals that I have had from the beginning. If you don't adapt things to yourself, if you don't have a specific routine, if you do n't follow a long-term methodology,
[30:44] if you don't backtest your strategy, if you don't try to correct mistakes, if you don't focus on your personal development, if you do n't take care of your diet, if you don't dedicate hours of your day weekly to learning, if you don't do all this, you won't
[30:59] be profitable. And listen, this isn't about philosophies, it's not about smart money or algorithmic fraud, this is about the business, about what trading is, about the essence of the profession. No matter what you do, if you do what I've
[31:12] told you, you're going to be profitable. However, even if I explain it to you and come to your house and teach you how to trade like I do, literally step by step what I do, if you don't sacrifice as much as I have, or at least half as much, you wo
[31:25] n't be profitable. And I'm not telling you all this because it sounds because when I founded Trading Lab, the training and community where I teach trading from scratch—in my opinion and in
[31:40] the opinion of so many people, the best Spanish-speaking trading academy —I focused precisely on these values, on these pillars, because if what I'm going to teach you suits you, you'll be profitable in 6 months.
[31:54] However, if what I'm going to teach you doesn't suit you, at the very least you'll have a solid foundation in what trading is, which you'll simply have to replicate with a different philosophy and you'll get results. Results like those
[32:08] being obtained by dozens and dozens and hundreds of students. We have, for example, a whole page of video testimonials. We have the transpilot full of positive testimonials. We also have people like
[32:21] Ivan, for example, who after being in Trading Lab for approximately one year already in Trading Lab for approximately one year already manages a capital of 240,000 through different funding accounts and is just 1% away from approving
[32:35] another account of $200,000. We also have profiles like Ismael's, who after 7 months of watching YouTube videos without any order and without seeing tangible results, decided to join Trading Lab and after a year in the academy has
[32:49] already been profitable for 6 consecutive months and generating profits through a $50,000 funding account. And yes, obviously within Trading Lab are each and every one of my strategies, everything I do, there are
[33:03] live streams, there is a huge community, there are face-to-face meetups every day. There's something new: a syllabus, questions and answers, live trading—there's absolutely everything, but that's no longer the most important thing, although it's extremely
[33:17] important. The most important thing is that it provides the foundations that any trader must follow if they want to make a living from trading. So if you'd like to know a little more about this, about Trading Lab, about what we do within
[33:29] academy, about the school, call it what you want. Below in the first pinned comment and the video description, I'll leave you a short link to a 4-minute video where I quickly explain what everything we
[33:45] In addition, those who wish will also find other links of interest, contests, tutorials, training courses, all 100% free content so that they can continue learning in the world of trading without having to invest their money. I'm going
[33:59] liked it, and that it was useful to you, which is the important thing. If share it with your family and friends, and we'll see you in the next video. Bye bye.
[34:12] next video. Bye bye. [Music]
⚡ Saved you 0h 34m reading this? Transcribe any YouTube video for free — no signup needed.