
I Made $3,700 with This Simple Trading Strategy
45sHigh earnings claim in the first seconds grabs attention and promises a money-making secret.
▶ Play Clip"The title promises a live strategy and delivers exactly that—a step-by-step demonstration with real trades and results."
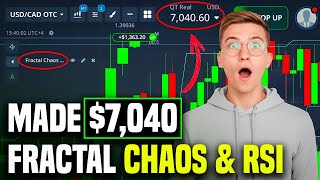
This video presents a live trading strategy for Pocket Option, combining Fractal Chaos Bands and RCI indicators to identify high-probability entry points. The trader demonstrates the setup, execution, and results of several trades, showing a balance growth from $3,333 to $7,040 in a single session.
The trader uses classic candles with a 1-minute timeframe and adds Fractal Chaos Bands (period 3) and RCI (period 10) indicators.
The primary sell signal is when candles cross below the lower Fractal Chaos Band, indicating a potential bearish reversal.
The RCI confirms the signal when the TRO line crosses below the red line, showing increasing selling pressure.
The trader opens a sell trade with a 2-minute expiration for $1,550, resulting in a $1,426 profit.
A buy trade is opened for $1,250 with a 2-minute expiration, yielding a $1,150 profit as the market moves upward.
A bullish impulse leads to a buy trade for $520, which profits as the market accelerates upward.
The final trade is a buy for $710 with a 2-minute expiration, locking in $753 profit.
The session ends with a balance of $7,040, up from $3,333, demonstrating the strategy's effectiveness.
What two indicators are used in this strategy?
Fractal Chaos Bands and RCI (Relative Chaos Index).
00:36
What period is set for the Fractal Chaos Bands?
Set the period to 3.
00:36
What is the primary signal for a sell trade?
When the candles cross below the lower band.
02:05
How does the RCI confirm a sell signal?
The TRO line crosses the red line from top to bottom.
02:36
What expiration time is used for each trade?
2 minutes.
01:49
What was the balance growth in the session?
From $3,333 to $7,040.
07:03
Primary Signal: Price Crosses Below Lower Band
This is the core entry trigger that defines the strategy's logic.
02:05RCI Confirmation: TRO Crosses Below Red Line
This confirmation step filters out false signals and adds confidence.
02:36Session Profit: $3,333 to $7,040
Demonstrates the potential profitability of the strategy in a real session.
07:03Strategy Works in Any Market Condition
Claims universality, making it attractive for traders in various environments.
05:07[00:07] session, using this strategy, I've already made around $3,700. It delivers such clean signals that every entry feels extremely confident. Now, I'll show you step by step how I operate and how you can replicate this
[00:23] operate and how you can replicate this exact logic. Stay until the very end. I saved the best part for last. I'd really appreciate a subscription to the channel and a like on the video. Let's get started. First of all, let's prepare the
[00:36] tools we'll be working with. I use classic candles with a 1 minute time frame. Then go to the indicators tab and add the fractile KS bands and rci. We'll set up fractal KS bands first. Set the period to three. [music]
[00:51] Then go to style, set the background to white, change the upper and lower lines white, change the upper and lower lines to turos, and then click save.
[01:03] to 10. Then go to style. Disable the 70 and 30 levels. Set the 50 line to red with the two. And move the opacity slider to the right. Set the main line to turos with the two. And then click save. The indicators are ready to go. My
[01:20] friend, if you're trading on your phone, just set everything up the same way. And if you've had losses before because of the wrong approach, don't repeat that mistake. In Telegram, I provide structured analysis, daily entry points,
[01:34] and autocoping so you can trade without chaos. [music] Plus, personal support. Sports are limited. Message me if you want to change your results. I start with the first clear signal. Expiration 2 minutes, and I'm opening a sell trade
[01:49] for $1,550. Now I'll explain in detail how the strategy works. In reality, everything here is very simple and visual. Look, the first reference point is the price behavior relative to the fractal chaos
[02:05] bands. At the moment, when the candles cross below the lower band, the chart gives us an important primary signal. This indicates that the previous structure is no longer holding and the market begins shifting downward. Such a
[02:20] crossover often signals a change in direction. The bullish move loses support and a bearish trend starts to form. Next, we look at the RCI to confirm what's happening. The TRO line crosses the red line from top to bottom,
[02:36] strengthening the overall signal. This crossover shows weakening buying pressure and increasing dominance from sellers. When both conditions occur simultaneously, the break of the fractile KSB bands and confirmation from
[02:51] fractile KSB bands and confirmation from RCI, the picture becomes extremely clear. [music] A downward move begins to develop logically, smoothly, and without a necessary noise, making this scenario especially confident to trade. [music]
[03:11] $1,426 in profit and continue monitoring the market. A few minutes later, a new entry opportunity appears. Expiration is 2 minutes and I open a buy trade for $1,250.
[03:27] The market confidently starts moving up and this is immediately reflected in the candles. They become tighter and more decisive, forming a clear and well ststructured upward move. The impulse develops smoothly without sharp
[03:41] pullbacks and the structure looks stable and logical to me making the signal extremely clear. Also, the indicators point upward without any ambiguity fully
[03:54] confirming the current direction. Their alignment strengthens confidence and shows that the move has a solid foundation. And in this situation, expecting profit is completely justified as the market is clearly moving in
[04:09] as the market is clearly moving in direction of the uptrend. [music] $1,150 profit. Moving on to the next situation,
[04:23] the chart forms a clear bullish impulse with a two-minut expiration. I open a with a two-minut expiration. I open a buy trade for $520. After a short pause, the movement noticeably accelerates as it's as if the
[04:37] market gets a second wind. You know, the candles become denser and more expressive with strong bodies, and each new upward move confirms that buyers are clearly in control here. The impulse develop smoothly and steadily without
[04:52] sharp spikes or chaos, making the overall picture especially [music] clean and easy to read. This type of market behavior indicates strong buyer control and shows that the upward direction is forming on a solid foundation rather
[05:07] than randomly. And my friend, here's an important point. I've tested this strategy in many different conditions. It performs really well at any time of the day, at any
[05:20] level of volatility. That's why I consider it universal and reliable whether the market is calm or highly active. Anyway, if you have any sure you message me privately on Telegram and I'll be happy to help you.
[05:45] in profit. This streak continues. For the final trade of the day, a clean signal appears. Timer is 2 minutes. And I open a buy trade for $710.
[05:57] On the chart, a clear upward movement is very easy to see. The direction is obvious at the first glance. The candles form consistently, confidently, pushing the price higher and maintaining a steady growth rhythm without unnecessary
[06:13] fluctuations. The structure looks neat and stable, indicating strong control from buyers. Both indicators fully confirm the upward movement as well, pointing in the same direction and strengthening the overall picture. This
[06:28] alignment of signals adds confidence since the growth is supported from multiple angles and this situation the market looks strong and organized. So expecting profit here is completely logical and well justified
[06:50] locked in $753 in profit. The balance reaches $7,040. Let's sum this session up. An excellent session. My balance grew from $3,333
[07:03] all the way to $7,040. If you have any questions about the method itself, or you want to dive deeper, don't hesitate. Message me on Telegram and I'll be happy to help. Thanks a lot for watching, for
[07:17] subscribing to the channel, and liking the video. See you next time.




⚡ Saved you 0h 07m reading this? Transcribe any YouTube video for free — no signup needed.