[00:01]
दोस्तों अगर आप ऑप्शन ट्रेडिंग करते हो तो आपको पता होगा कि ऑप्शन चेन को रीड करना सारे ऑप्शन ट्रेडर को आना चाहिए। भले ही आप ऑप्शन बाइंग करते हो, भले ही आप ऑप्शन सेलिंग करते हो। तो ऑप्शन चेन क्या होती है ना अगर मैं शॉर्ट में आपको बताऊं कि
[00:14]
ऑप्शन चेन हमारी सेट ऑफ डाटा होती है। मतलब कि इसमें बहुत सारा डाटा हमको मिलता है। और ये रियल टाइम डाटा होता है। हर 15 मिनट में, हर 10 मिनट में यह आपको चेंज तो, इसका फायदा पता क्या होता है? मैं आपको बताऊं। उसका फायदा होता है कि आप सही
[00:29]
तरीके से डिसीजन ले पाते हो। अगर आप बाइंग करते हो तो भी आपके लिए इंपॉर्टेंट है। सेलिंग करते हो तो भी आपके लिए इंपॉर्टेंट है। लेकिन ऑप्शन चेन में एक चीज होती है जो सबसे ज्यादा इंपॉर्टेंट होती है। जैसा कि आपको दिख रहा होगा कि ऑप्शन चेन में
[00:42]
बहुत सारी चीजें हैं यहां पे आपको दिखाई दे रही होंगी बहुत सारी। वॉल्यूम है, ओआई है। ठीक है? फिर आईवी भी आती है। और भी बहुत सारी चीजें आती है। ग्रीक्स वगैरह भी। तो क्या चीज देखना है? क्योंकि सारी चीजें हम एक साथ तो देख नहीं सकते हैं जब
[00:56]
तक कि हमारी ट्रेड छूट जाएगी। तो आज मैं आपको बताऊंगा कि ऑप्शन चेन में आपको जो चीज देखने वाली है वो है हमारी ओपन इंटरेस्ट। क्या है? ओपन इंटरेस्ट जिसको हम ओआई भी कहते हैं। तो ओआई के ऊपर यह डेडिकेटेड वीडियो रहने वाली है। तो, हम यह
[01:09]
समझेंगे आज की डेट में ओआई और ओआई इन चेंज मतलब कि चेंज इन ओआई। यह दो चीजों को हम कवर करने वाले हैं। वीडियो बहुत ही ज़्यादा इंपॉर्टेंट रहेगी और शॉर्ट रहेगी। ज़्यादा लंबी हम रखेंगे नहीं, खींचेंगे नहीं। और फटाफट से बिना किसी देरी के चलो हम वीडियो
[01:23]
फटाफट से बिना किसी देरी के चलो हम वीडियो में एंटर करते हैं। लेना है ऑप्शन चेन। ऑप्शन चेन आप तीन तरीके से खोल सकते हो। पहली तो आपको मिल जाएगी यह एनएससी की वेबसाइट पे जो कि फ्री है एकदम। दूसरी आप क्या कर सकते हो?
[01:38]
सेंसिबल की चूज़ कर सकते हो। सेंसिबल भी एक बहुत अच्छा ऑप्शन चेन प्रोवाइड कराता है। एकदम फ्री ऑफ़ कॉस्ट मैं कोई प्रमोशन नहीं कर रहा हूं। अच्छी चीज़ है इसलिए आपको बता रहा हूं। ठीक है? इसमें आप बहुत सारी चीजें कस्टमाइजेशन कर सकते हो। तीसरा क्या
[01:50]
पे जाके आप ऑप्शन चेन खोल सकते हो। जैसा कि मेरा Zerodha का ब्रोकर है तो आप देख रहे होंगे यहां पर मैंने Zerodha में ऑप्शन चेन खोल ली। अब क्या है ना कि आपका पता। Go में हो सकता है, Zerodha में हो सकता है, धन में हो सकता है। तो आपको जहां
[02:04]
मर्जी आप ऑप्शन चेन खोलो। मैं आपको यहां पर सिर्फ और सिर्फ इसमें समझाऊंगा सेंसिबल में। क्योंकि यहां पर हमको जो चीज़ समझने की है, वह ऑलरेडी यहां पर दी गई है। ओपन इंटरेस्ट एंड ओपन इंटरेस्ट चेंज। ठीक है? तो आप देख रहे होंगे यह एकदम फ्री अकाउंट
[02:17]
किया है। तो आप यहां पर लॉग इन कर सकते हो। नहीं तो फ्री में भी देख सकते हो। कोई दिक्कत वाली बात नहीं है। ठीक है? चलिए तो यहां पर हम समझने वाले हैं ऑप्शन चेन में यहां पर हम समझने वाले हैं ऑप्शन चेन में ओआई एंड ओआई चेंज। देखो ओआई का मतलब क्या
[02:31]
होता है? फुल फॉर्म आप देखोगे तो उसका फुल फॉर्म होता है हमारा ओपन इंटरेस्ट। क्या होता है? ओपन इंटरेस्ट। अब यह ओपन इंटरेस्ट क्या है? अगर इसको आप समझने की कोशिश करो, तो इसका नाम में इसकी मीनिंग छुपी हुई है। ठीक है? दो चीजों से मिलकर
[02:43]
छुपी हुई है। ठीक है? दो चीजों से मिलकर बनी है ओपन एंड इंटरेस्ट। ओपन एंड इंटरेस्ट। ओपन से हमारा तात्पर्य है कि कितनी नंबर ऑफ पोजीशंस
[02:55]
कितनी नंबर ऑफ पोजीशंस ओपन है। ठीक है? नंबर ऑफ पोजीशंस हमारी कितनी ज्यादा ओपन है। तो यह ओपन से आ जाएगा। दूसरा इंटरेस्ट। इंटरेस्ट पता है क्या होता है? इंटरेस्ट है कि हमारा किस स्ट्राइक प्राइस पे मतलब कि कौन सी वाली
[03:08]
स्ट्राइक प्राइस हमारी इंपॉर्टेंट है? कहां पर नंबर ऑफ पोजीशन कौन सी वाली स्ट्राइक प्राइस पे करेंटली ओपन है वो हमारा कहलाता है ओपन इंटरेस्ट एकदम सिंपल लैंग्वेज में जैसे मान के चलो कि अगर कोई स्ट्राइक प्राइस है निफ्टी की 25000 की
[03:22]
कोई स्ट्राइक प्राइस है तो इसमें अगर आप देखोगे कि ओआई यहां पर आपको दिखाई देगा लाख में भी दिखाई दे सकता है। ठीक है? लाख में और कभी-कभी क्या है कि किसी-किसी चीज़ नंबर ऑफ़ कॉन्ट्रैक्ट में आता है। जैसा कि आपको पता है कि निफ़ी का लॉट साइज़ हमारा 65
[03:38]
का होता है। तो, जो सेंसिबल है, उसमें नंबर ऑफ क्वांटिटीज़ में आता है। मतलब कि इसमें लाख में आता है। जैसे मान के चलो कि अगर यहां पर दो कॉन्ट्रैक्ट ओपन है, तो ये आपको 130 ओपन इंटरेस्ट दिखाएगा। ठीक है? तो कंफ्यूज नहीं होना है बिल्कुल भी। आप
[03:52]
बस ये समझो कि क्वांटिटी कितनी ज्यादा है। ठीक है? लैक में है तो समझ लेना कि 65 का उसमें मल्टीप्लाई कर देना या डिवाइड कर देना। अब जैसे मान के चलो यहां पर लिखा है 5.6 लाख का ओपन इंटरेस्ट यहां पर हमारा दिखा रहा है कॉल साइड में। ठीक है? और
[04:07]
यहां पर पुट साइड में इसी पोजीशन पे आपको दिखा रहा होगा 3.2। हम यह सिर्फ हाइपोथेटिकल एग्जांपल लेके आपको समझाने की कोशिश कर रहे हैं। तो, आप देखोगे यहां पे कि जो ओपन इंटरेस्ट है कॉल साइड का यहां पे 5.6 लाख में दिखा रहा है। मतलब कि इतनी
[04:20]
क्वांटिटीज इस स्ट्राइक प्राइस पे पर्टिकुलर स्ट्राइक प्राइस पे इस समय करेंटली ओपन है। मतलब कि करेंटली यहां पर इतनी क्वांटिटीज में ट्रेड चल रही है। क्या चल रही है? ट्रेड चल रही है। अब आप खुद सोचो कि कितना इंपॉर्टेंट डाटा है यह।
[04:35]
अगर हमको यह पता चल जाए कि कौन सी स्ट्राइक प्राइस पे कितनी ज्यादा ट्रेड ओपन है तो उसके बेसिस पे हम बहुत सारी चीजें प्रेडिक्ट कर सकते हैं। बहुत सारी चीजों को मिला के हम अपनी खुद की स्ट्रेटजी बना सकते हैं। तो ये ओपन
[04:47]
इंटरेस्ट ऑप्शन चेन का सबसे इंपॉर्टेंट पार्ट इसीलिए है क्योंकि हमको यह पता चल जाता है कि कितनी पोजीशन हमारी यहां पर ओपन है। ठीक है? वहीं दूसरी तरफ आप पुट साइड देख रहे हो 3.2 लाख। ठीक है? 3.2 लाख
[05:00]
मतलब कि पुट साइड 3.2 लाख क्वांटिटीज़ यहां पर हमारी ओपन है। करेंटली ट्रेड चल रही है। अब आपको पता होगा कि एक कॉन्ट्रैक्ट जो हमारा बनता है एक कॉन्ट्रैक्ट जो बनता है जिसमें 65 क्वांटिटीज होती है। मतलब कि एक लॉट आप समझ लो एक लॉट में हमारी 65
[05:16]
क्वांटिटीज है। मैं हम निफ्टी का एग्जांपल ले रहे हैं। बैंक निफ्टी में यह आपका 30 हो जाएगा। ससेक्स में ये 10 हो जाएगा। आप अपने हिसाब से देख लेना। ठीक है? तो यह लॉट में है। मतलब कि एक लॉट में 65 क्वांटिटीज है। इसको हम कहते हैं एक
[05:30]
कॉन्ट्रैक्ट जब बनता है तो उसमें दोनों चीजें हमारी रहती हैं। ऑप्शन बयर भी होता है उसमें। ठीक है? ऑप्शन बयर भी होता है। प्लस हमारा ऑप्शन सेलर भी होता है। दोनों मिलके हमारा एक कॉन्ट्रैक्ट यहां पर बनाते
[05:44]
हैं। तो जो ओपन इंटरेस्ट है आप कह रहे होंगे कि हमको यह पता चलेगा कितने ज्यादा बयर यहां पर बैठे हैं कि कितने ज्यादा सेलर यहां पर बैठे हैं। तो वो चीज दोनों सेम है। अगर यहां पर 5.6 लाख क्वांटिटीज हैं तो 5.6 लाख क्वांटिटी बायर ने बायर ने
[05:58]
भी खरीदी होगी और सेलर ने ही बेची होगी। तो ओपन इंटरेस्ट जो है मैं आपको सिंपल सा बताने की कोशिश करूंगा कि जो ओपन इंटरेस्ट है जो हमारा ओआई है वो हम देखते हैं अपने सेलर्स के पर्सपेक्टिव से। किसके पर्सपेक्टिव से? सेलर के पर्सपेक्टिव से।
[06:13]
क्योंकि सेलर हमारा एक इंपॉर्टेंट पार्ट होता है। जैसा कि आपको पता होगा कि एक लॉट आप सेल करोगे तो आपको देना पड़ेगा बहुत सारा मार्जिन जो कि आपको करीब 1.5 लाख का पड़ेगा। वहीं दूसरी तरफ एक कॉन्ट्रैक्ट अगर आप बाय करोगे तो वो आपका ज्यादा से
[06:27]
ज्यादा जितना प्रीमियम होगा उसमें आप अपना क्वांटिटी मल्टीप्लाई कर दोगे लॉट की तो वो आ जाएगी जैसे मान के चलो कि ₹100 प्रीमियम चल रहा है तो एक क्वांटिटी एक लॉट बाय करने में आपका ₹6500 लगेगा सिर्फ
[06:40]
और सिर्फ वहीं दूसरी तरफ सेल करने में आपको ₹1.5 लाख लगेगा। वही लॉट जो कि एक बयर ₹6500 में खरीद रहा है वही सेलर ₹1.5 लाख दे रहा है। तो इसका मतलब क्या है कि सेलर क्या है? एक अपर हैंड है उसके पास और हम यह
[06:55]
समझते हैं कि जितने भी सेलर हैं यह हमारे थोड़े मोटे पार्टी होते हैं क्योंकि आप खुद सोचो कि एक लॉट में वह ₹1.5 लाख लगाने को तैयार है और कोई अगर 10 लॉट से कर रहा है तो कम से कम ₹15 लाख वह लगा रहा है। मतलब क्या है? सेलर हमारा बिग मनी वाला
[07:09]
आदमी है। कौन है? बिग मनी वाला। इसके पास बड़ा पैसा है। और यह समझा जाता है कि जो सेलर है वह हमारे मार्केट को मूव कराते हैं। जो कि मोस्टली होते हैं हमारे हैं। जो कि मोस्टली होते हैं हमारे इंस्टीटशंस। कौन होते हैं? इंस्टटशंस। तो
[07:23]
सबसे पहली चीज आपको यह समझ लेना है कि जब भी आप ओपन इंटरेस्ट देखोगे तो आपको सेलर्स के पर्सपेक्टिव से देखना है। जितनी भी क्वांटिटीज हैं जितना ज्यादा ओपन इंटरेस्ट होगा आप यह समझना कि उतने ज्यादा सेलर वहां पर बैठे हुए हैं बेचने के लिए। ठीक
[07:36]
सेलर्स के पर्सेक्टिव से। अब ये मैं इतनी इसके स्क्रीनशॉट वगैरह लेके रख सको अपने नहीं कहां पर वीडियो देख रहे होगे। आप कोई ट्रेन में होगा, कोई बस में होगा, कोई घर
[07:49]
में होगा। कोई रेस्टोरेंट में बैठा होगा। ठीक है? तो क्या करना है आपको? इसका स्क्रीनशॉट लेकर रखना है। बाद में इसके नोट्स आराम से बना लेना। नहीं तो पीडीएफ इसकी बना के सेव कर लेना। तो ओपन इंटरेस्ट हमको देखना है
[08:02]
सेलर्स के पर्सपेक्टिव से। जितना ज्यादा ओपन इंटरेस्ट होगा, ओपन इंटरेस्ट जितना ज्यादा होगा, यह समझ लो कि सेलर उस स्ट्राइक प्राइस में उतने ज्यादा इंटरेस्टेड है। उस स्ट्राइक प्राइस में सेलर उतने ज्यादा इंटरेस्टेड हैं। अब जब
[08:16]
प्राइस में तो यहां पर ना गेम थोड़ी सी चेंज हो जाती है। कैसे चेंज हो जाती है? वो मैं आपको यहां पर बताऊंगा। ठीक है? ये देखो। अब यहां पर आप देखो। सबसे पहली चीज आपको क्या देखना है? ओपन इंटरेस्ट। यहां पे लाख में लिखा है। मतलब कि ये इतनी लाख
[08:30]
क्वांटिटीज़ हैं। अब 65 से इसमें डिवाइड कर दोगे तो ये हमारा नंबर ऑफ़ कॉन्ट्रैक्ट्स आ लगाने नहीं है। इसमें लाख में हो चाहे जिसमें हो। मेन चीज़ हमको क्या देखना है? कौन सी स्ट्राइक प्राइस पे ओपन इंटरेस्ट कितना ज्यादा है। ठीक है? जैसा कि यहां पर
[08:44]
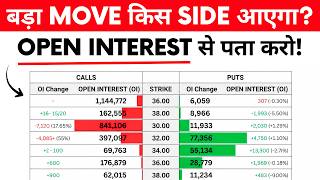
आप देख रहेगे 24,300 की जो स्ट्राइक प्राइस है, इसमें कॉल साइड में मुझे सबसे 130 लाख का। ठीक है? 130 लाख। वहीं दूसरी तरफ
[08:56]
आप देखोगे फिर हमारा 24,500 पर दिख रहा है मेरे को सेकंड हाईएस्ट 128 लाख का यह हो गया कॉल साइड का और आपको पता होगा कि यह जो स्ट्राइक प्राइस है आईटीएम एटीएम ओटीएम
[09:09]
तो आपको पता ही होगा यह हमारी एट द मनी है यह जितनी भी हैं यह हमारी आउट द मनी है और यह हमारी इन द मनी है कॉल के पर्सपेक्टिव से वहीं दूसरी तरफ यह हमारी इन द मनी है सेलर्स के पर्सेक्टिव से मतलब कि पुट पुट वालों के लिए यह आउट द मनी हो जाएगा और एट
[09:24]
द मनी तो दोनों के लिए सेम होता है। समझ में आई? ठीक है? तो यहां पर हमको क्या पता चला कि कॉल साइड जो सेलर हैं, वह इन दो स्ट्राइक प्राइस में बहुत ज्यादा स्ट्राइक प्राइस में बहुत ज्यादा इंटरेस्टेड है। 24,500 और 24,300।
[09:36]
अब आप देख रहे हो प्राइस चल रहा है करेंटली हमारा 24,175। आपको पता ही होगा। उसको हम कहते हैं स्पॉट प्राइस।
[09:48]
प्राइस। अब जो सेलर है हमारा आप देख रहेगे सबसे अब जो सेलर है हमारा आप देख रहेगे सबसे ज्यादा 24,300 पर बैठा है जो कि आप देखोगे ज्यादा 24,300 पर बैठा है जो कि आप देखोगे स्पॉट से अगर माइनस करोगे 24300
[10:00]
ठीक है ये जो कैलकुलेशन है ना ये आपको एकदम फास्ट कर लेनी है सीख लो एक बार फिर आपको बहुत जल्दी पता चल जाएगा धीरे-धीरे सब एक्सपीरियंस हो जाएगा तो यहां पर आप देखोगे सिर्फ और सिर्फ 125 पॉइंट का यहां पे डिफरेंस आ रहा है। मतलब निफ़ी को सिर्फ
[10:12]
और सिर्फ 125 पॉइंट ही ट्रैवल करना है यह वाले स्ट्राइक प्राइस पर पहुंचने के लिए। और यहां पर इतने सारे सेलर यहां पर बैठे हैं इस स्ट्राइक प्राइस को बेचे हुए। ठीक है? जैसा कि मैंने आपको क्या बोला? ओपन इंटरेस्ट हमको सेलर्स के पर्स्पेक्टिव से
[10:24]
देखना है। और सेलर क्या करता है? सेलर सेल करता है। अब जितने भी लोग जो सेल करे बैठे हैं यहां पर 51 की जो प्रीमियम है 23 24,300 पे कॉल सेल करके बैठे हैं। और कॉल आदमी कब सेल करता है? जब उसका व्यू है बियरिश।
[10:41]
ठीक है? बाय साइड का एकदम अपोजिट कर दो। अपन कॉल कब खरीदते हैं? जब हमको लगता है कि निफ्टी ऊपर जाने वाली है तब हम कॉल खरीदते हैं। तो सेलर कॉल को बेच रहा है। तो मतलब कि वह बेचेगा और सेलर बेच रहा है। मतलब कि जब यह प्रीमियम का प्राइस ज़ीरो
[10:54]
होगा या कम होगा। तब सेलर को फायदा होगा। हमको फायदा कब होता है एज अ बयर का? जब यह ₹50 का प्रीमियम हमारा ₹60 हो जाए, 70 हो जाए, 100 हो जाए, तब हमारा फायदा होगा। तो, सेलर का फायदा कब है? जो ₹50 का प्रीमियम हमारा ज्यादा से ज्यादा
[11:07]
जल्दी-जल्दी ज़ीरो हो जाए या फिर कम हो जाए तो सेलर का यहां पे फायदा होगा। तो सेलर का जो व्यू है जो कॉल बेचता है सेलर तो उसका व्यू होता है बुलिश सॉरी बियरिश कि उसका व्यू होता है बुलिश सॉरी बियरिश कि उसका जो वो चाहता है कि मार्केट में मंदी
[11:20]
आए। मार्केट में गिरावट आए। तो आप देख रहे होंगे 125 पॉइंट ही हमारा यह वाली स्ट्राइक प्राइस दूर है। अब जैसे कि धीरे-धीरे जब प्राइस हमारा पहुंचेगा यहां पर। ठीक है? जैसे-जैसे प्राइस यहां पर पहुंचेगा तब आपको पता चलेगा कि भैया यहां
[11:34]
पर यह एक पॉसिबल रेजिस्टेंस की तरह काम करेगा। क्योंकि इसके ऊपर जैसे-जैसे प्राइस जाना स्टार्ट करेगा सेलर को यहां पे लॉस होना स्टार्ट होगा। सेलर लॉस बहुत ही कम लेते हैं। क्या करते हैं? सेलर बहुत ही कम लॉस लेते हैं। ठीक है? अब इतने सारे लोग
[11:49]
यहां पे सेल करके बैठे हैं तो उनको कुछ ना कुछ तो इनसाइट होगी ना। आप खुद सोचो। एट द कुछ तो इनसाइट होगी ना। आप खुद सोचो। एट द मनी में और 24,300 में। यहां पर सिर्फ और सिर्फ अगर राउंड ऑफ करें तो 60 लाख पोजीशन यहां पर लगी है और यहां पर 1 करोड़ 30 लाख
[12:03]
पोजीशन लगी है। मतलब कि जस्ट डबल से भी ज्यादा। तो मतलब कि कुछ ना कुछ तो इंसाइट है ना सेलर के पास। कुछ ना कुछ तो इनसाइट है ना सेलर के पास कि यार यह स्ट्राइक प्राइस पे जब प्राइस जाएगा। हो सकता है कि चार्ट पे आप देखो तो प्राइस एक्शन भी आपको
[12:15]
देखना है। तो प्राइस एक्शन के बेसिस पे आपको इस स्ट्राइक प्राइस पे हो सकता है कि हो सकता है यहां पे एक रेजिस्टेंस दिखाई दे और अगर प्राइस इसके भी ऊपर जाना स्टार्ट कर दे तो आपको फिर ध्यान देना है ओपन इंटरेस्ट चेंज में। ठीक है? अगर यहां
[12:30]
पर माइनस में ओपन इंटरेस्ट बढ़ता जा रहा है। मतलब कि ओपन इंटरेस्ट यहां पर कम होता जा रहा है और यहां पर सेलर भाग रहे हैं तो इसका मतलब क्या है? कि यह वाला जो स्ट्राइक प्राइस है जो कि एक रेजिस्टेंस की तरह काम कर रहा था। अब यहां पर इसका
[12:42]
ब्रेकआउट हो चुका है। अब जो नेक्स्ट रेज़िस्टेंस है वह 24,500 बनेगा। ठीक है? स्टार्ट करना है और यहां पर ओपन इंटरेस्ट जो चेंज है उस पर ध्यान देना है। ठीक है? दो चीजें हो सकती हैं यहां पर। देखो मैं आपको बता दूं आप ट्रेड करने आए मार्केट
[12:58]
में। ठीक है? अभी तो मार्केट बंद चल रही है। सोचो कि कल इसी पॉइंट पे मार्केट हमारी ओपन हुई और ये ये सेम डाटा हमको देखने को मिला। तो मैं आपको सिंपल सा एक ओवरव्यू बता देता हूं कि क्या चीज आप कर सकते हो। प्राइस हमारा बढ़ना स्टार्ट
[13:12]
किया। इस वाली स्ट्राइक प्राइस पर जाना स्टार्ट किया जो कि 125 पॉइंट है और यहां पर इसका ओपन इंटरेस्ट कम होने लगा और यहां पर ओपन इंटरेस्ट चेंज में भी यह माइनस में जाने लगा मतलब कि सेलर यहां से भाग रहा है और दूसरी तरफ 24500 का जो ओपन इंटरेस्ट है
[13:25]
और दूसरी तरफ 24500 का जो ओपन इंटरेस्ट है यह ₹128000 से बढ़ के ₹1.5 लाख 2 लाख और ज्यादा हो रहा है। ठीक है? तो यहां पर ओपन इंटरेस्ट चेंज भी पॉजिटिव में और ज्यादा बढ़ता जा रहा है। तो यह समझ लेना कि पॉसिबबली यह वाला जो पॉइंट है, यह हमारा
[13:38]
नेक्स्ट रेजिस्टेंस बनेगा। मतलब कि प्राइस अब यहां तक जाएगा क्योंकि यहां पर अब मिलेगा क्योंकि सेलर ऑलरेडी यहां पर पैनिकिक करके भाग रहे हैं। ठीक है? तो ये से बहुत अच्छी है। उनको पहले ही पता चल जाएगा कि भैया ये स्ट्राइक प्राइस का
[13:53]
हैं। हम चार्ट पे आपको इसको प्लॉट करके दिखाते हैं। ठीक है? तब आपको बहुत अच्छे से यहां पे क्लियर हो जाएगा। यहां पर मैं लॉग इन कर लेता हूं। लॉग इन कर लेता हूं। यह हम चार्ट ओपन करते हैं। ठीक है?
[14:07]
सिर्फ और सिर्फ आपको समझाने के लिए बता रहा हूं मैं। कोई रिकमेंडेशन वगैरह कुछ नहीं है। यहां पर गए हमने 5 मिनट का टाइम फ्रेम यहां पर लगा लिया। अब जो हमारी स्ट्राइक प्राइस थी जिसप ओपन इंटरेस्ट हमारा बहुत ज्यादा था जो कि है 24,300।
[14:20]
ठीक है? तो 24,300 की स्ट्राइक प्राइस है। हम यहां पर इसको एक हॉरिजॉन्टल लाइन खींच हम यहां पर इसको एक हॉरिजॉन्टल लाइन खींच देंगे। 24,300 कहां है भाई? 24,300 यह है हमारा एक 24,300 का। देखो यहां पर जब हम एक हॉरिजॉन्टल लाइन खींचेंगे 1 सेकंड।
[14:42]
चलो यहां पर ऐसे खींच देते हैं। ठीक है? ये देखो ये हॉरिजॉन्टल लाइन हमने खींच दी। ये देखो ये हॉरिजॉन्टल लाइन हमने खींच दी। तब आप देख रहेगे कि ये हमारा यहां से सेलर्स हमारे एक्टिवेट हुए थे इस पॉइंट से। ठीक है? तो ये दोबारा हमारा एक
[14:57]
रेजिस्टेंस की तरह काम कर सकता है। ठीक है? सिर्फ और सिर्फ 125 पॉइंट यहां पर दूरी है। इसमें ज्यादा दूरी नहीं है। सिर्फ और सिर्फ 125 पॉइंट दूरी है। हो सकता है कि कल की डेट में गैप अप हो जाए। कुछ भी हो जाए। ठीक है? तो ये वाला पॉइंट
[15:11]
हमारा इंपॉर्टेंट पॉइंट रहेगा। यहां पर प्राइस का रिएक्शन इंपॉर्टेंट है। ठीक है? पर ऑप्शन चेन में आप ओपन इंटरेस्ट को भी देखते जाओगे। ठीक है? प्राइस एक्शन और ओपन इंटरेस्ट और हमारा ऑप्शन चेन ये साइड बाय
[15:24]
साइड हमारा चलता है। ठीक है? समझ में आई? अब एक काम करते हैं। पुट साइड भी हम देख लेते हैं भाई। पुट साइड कौन सा ज्यादा है? तो पुट साइड अगर मैं नजर डालूं और ओपन देखना है। पता चला कि आप यहां का देखने लगो बहुत पुराना बहुत दूर का। अब जैसे
[15:38]
25,000 का देखने लगो तो 25,000 तो भाई 800 पॉइंट दूर है। आपको इंट्राडे करना है। सेलिंग करना है। तो इतना ज्यादा दूर का हमको देखना नहीं है। 400 500 पॉइंट के ज्यादा स्ट्राइक प्राइस भी हमको देखनी नहीं है। तो, यह हमारा पुट साइड का ओपन
[15:53]
इंटरेस्ट है। पुट साइड का ओपन इंटरेस्ट तो आप देख रहे होंगे एकदम कम ही है। मतलब कि पुट साइड इतना ज्यादा लोग सेल कर नहीं रहे हैं। फिर भी आप देखोगे तो सबसे ज्यादा मेरे को दिखाई दे रहा है। सबसे पहले तो 24,200 पर दिखाई दे रहा है। ठीक है? जो कि
[16:06]
70 लाख का है। इसके बाद फिर मेरे को और कहीं नहीं दिखाई नहीं दे रहा। ठीक है? सिर्फ 70 लाख का 24,200 का। तो यहां पर मैं क्या चार्ट पे 24,200 मार्क करूंगा। ठीक है? 24,200 24,200 ही है ना?
[16:21]
24,200 ही है ना? यस 24,200 ही है। तो यहां पर मैं 24,200 मार्क करूंगा। एक हॉरिजॉन्टल लाइन 24,200 के पास ले जाऊंगा। तो आप देख रहे होंगे यह हमारा एक रेजिस्टेंस की तरह यहां पर काम कर रहा है।
[16:36]
ठीक है? यह भी एक रेजिस्टेंस की तरह काम कर रहा है। लेकिन पुट आदमी कब बेचता है? थोड़ा सा दिमाग लगाओ। पुट आदमी कब बेचता है? जब उसका व्यू है बुलिश। व्यू है है? जब उसका व्यू है बुलिश। व्यू है बुलिश। ठीक है? तो पुट आदमी व्यू बुलिश
[16:52]
है। तो जैसे-जैसे प्राइस ऊपर जाएगा इनको और ज्यादा फायदा होगा क्योंकि यह और इन द मनी आता जाएगा। ठीक है? और इन द मनी आता जाएगा। समझ में आई? ठीक है? चलिए तो समझ में आया किस तरीके से आपको काम करना है। प्राइस एक्शन और ओपन इंटरेस्ट और ऑप्शन
[17:07]
चेन ये दोनों चीजों का जब आप मिलाओगे ना तो आपको पता चल जाएगा कि इस लेवल का ब्रेकआउट हो सकता है कि नहीं हो सकता है। इस लेवल का हो सकता है कि नहीं हो सकता। ये सारी चीजें आपको डाटा आपको पहले ही बता देगा। ठीक है? अब बहुत सारे लोग ऑप्शन छीन
[17:20]
के डाटा को इतना ज्यादा सीरियस लेते नहीं है। लेकिन मैं आपसे यही कहूंगा कि प्लीज इस पे भी थोड़ी बहुत नजर डाल लिया करो। ठीक है? पता है सारे लोग प्राइस एक्शन को सपोर्ट एंड रेजिस्टेंस, सप्लाई एंड डिमांड
[17:32]
और स्मार्ट मनी कांसेप्ट। ठीक है? गैप वगैरह भी ट्रेड कर रहे हैं लोग। तो प्लीज यार इस पे भी एक नजर मार लो। डबल कंफर्मेशन के लिए है। ठीक है? कोई सी भी एक चीज़ पे रिलाई नहीं करना है। प्राइस एक्शन को पता है आपको कितना धोखा देता है
[17:44]
प्राइस एक्शन? फेक ब्रेकआउट देगा, ट्रैप करेगा लोगों को। लेकिन ऑप्शन चेन में जो डाटा है ये रियल डेटा है। यहां पर रियल में लोग यहां पर बैठे हुए हैं। रियल में हैं, हटा रहे हैं, बिल्ड अप कर रहे हैं। ये सारी चीजें आपको यहां पे पता चलेगी।
[17:58]
डेप्थ में हमने समझा नहीं। ज्यादा डेप्थ में देखना है तो ऑप्शन चेन के ऊपर बहुत बड़ी मास्टर क्लास यहां पर हमारी डली हुई है। तो उसको आप चेक आउट कर सकते हो। तो होगी। वीडियो पसंद आई हो तो वीडियो को लाइक करें। नए हो तो चैनल को सब्सक्राइब
[18:12]
करें और ऐसे ही अमेजिंग वीडियो देखने के लिए हमारे चैनल पे बने रहें। मिलते हैं आपसे अगली वीडियो में तब तक के लिए जय हिंद जय