
Stop Adding More Indicators!
45sChallenges common trader behavior of piling on indicators, creating controversy and engagement.
▶ Play Clip"Title accurately promises a combination strategy; video delivers a clear, actionable method."
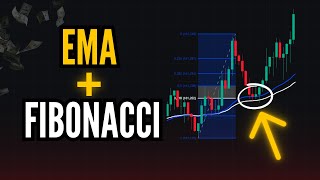
This video teaches traders how to combine Fibonacci retracements with moving averages for high-probability trades. The strategy relies on a moving average crossover to signal a structural change, then uses Fibonacci to pinpoint entry zones where both tools align.
Configure two exponential moving averages: a fast 35-period EMA (blue) and a slow 55-period EMA (white).
Look for a trend (up or down). When moving averages cross above or below the chart, it signals a structural change.
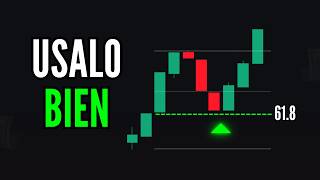
After the crossover, mark Fibonacci retracement on the impulse of the structural change. The 61.8% or 50% levels are key.
If the Fibonacci retracement coincides with the 35 or 55 EMA, you have double confirmation for a trade.
The chart must touch the interest point with a volume candle showing intention, not just a random touch.
If previous movements have retracements, mark Fibonacci only on the last impulse after the crossover.
Never trade at the crossover itself; wait for a pullback to the Fibonacci/EMA confluence.
Combining moving averages with Fibonacci creates a powerful entry model for any market and timeframe. Always wait for a pullback to the confluence zone and confirm with a volume candle.
What are the two moving average periods recommended for this strategy?
35-period EMA (fast) and 55-period EMA (slow).
01:07
What does a moving average crossover above the chart indicate?
A structural change from an uptrend to a downtrend.
02:03
Which Fibonacci levels are considered the 'Golden Zone'?
50% and 61.8% retracement levels.
04:17
When should you NOT enter a trade according to this strategy?
At the moving average crossover itself; you must wait for a pullback.
13:45
What type of candle confirms the price will respect the Fibonacci/EMA confluence?
A volume candle that extends to touch the line with intention.
06:24
How do you decide where to mark Fibonacci when previous movements have retracements?
Mark Fibonacci only on the last impulse after the moving average crossover.
08:27
What expiry time is suggested for binary options trades using this strategy?
5 to 7 minutes.
06:11
Double Confirmation Entry
Combining two independent tools (EMA and Fibonacci) increases trade reliability.
04:33Volume Candle Requirement
Emphasizes price action confirmation beyond indicator alignment.
06:24Trade on Pullback, Not Crossover
Corrects a common mistake that leads to poor entries.
13:45Fibonacci Marking Rules
Provides a clear rule for when to mark Fibonacci on the last impulse only.
08:27[00:01] trading strategies, Fibonacci and moving averages are undoubtedly two strategies that all traders should know, as they will lead them to achieve results in the this video, I'm going to teach you how to use both strategies simultaneously and
[00:15] how you can complement one with the other to have perfect trades. So do video. In other videos, I've explained the two video, I'm going to teach you how one strategy complements the other. So
[00:30] first mistakes made in trading is that as we progress in our process, we learn different strategies and use different tools. Many traders make the mistake of
[00:43] starting to apply different indicators or different strategies in addition to the strategies they already had. That is, they start indicators thinking that this will give them
[00:55] better trades or better results, but it's practically the opposite. So, to be able to use these two strategies together, the first thing you need to do is configure your moving averages. This is a strategy I've already
[01:07] explained, but the truth is, it's quite simple. You're going to configure two moving averages. The first moving average... The exponential moving average will be a 35-period moving average in blue. Here we have it, a 35-period moving average in blue,
[01:23] and this will be our fast moving average. The second moving average should be an EMA (Exponential Moving Average), also 55 periods, but in white. This will be our slow moving average. These two strategies, both
[01:37] moving averages and Fibonacci, complement each other quite well in structural changes. Normally, when we see that our chart is changing from one place to another, we always have this doubt of how we can really confirm that the
[01:51] chart is going to change or how we can confirm that with this tool we have a good trade. Remember that when the moving averages are below your chart, it means that your chart is moving upwards.
[02:03] So what we are going to look for is very simple, and it is the entry model for a structural change. We need to have an upward trend or a downward trend. In this case, our moving averages are moving
[02:16] along the bottom of our chart, but once they cross above the chart, once the moving average crosses above, we are going to complement this structural change with Fibonacci so that the point The entry point of the
[02:29] moving average and Fibonacci crossover is the exact point and perfect confirmation for our trades. Something you need to know is that, in general, it doesn't matter which strategy you use, because when you use tools
[02:43] based on price action, they will all lead you to the same place, but in different ways. Imagine you are solving a math problem; you can have different processes to solve it, but they will all lead you to the
[02:55] same result, just with different methods. The same thing happens in TR (Trading Rate). If you want to use the moving average strategy or Fibonacci, the structure or change in structure on your chart should be the same;
[03:08] only the confirmation will change. But in this case, what we need is for the moving average to cross our chart. That is the first indicator, since it is also an indicator of a change in structure. That's what
[03:22] moving averages are for. Once our moving averages are positioned above our chart, this indicates a change in structure, and that's where we will complement it with Fibonacci. First, we
[03:35] have to wait for the crossover to occur. Pay close attention here. Once you have the moving average crossover, what does upward movement has ended, and now you're starting to see a change in
[03:49] structure. In this case, the upward movement has just ended, and now we have a downward movement. So, what we're going to do to use this entry model is to mark our Fibonacci retracement at the impulse of the structural change. That is,
[04:02] impulse of the structural change. That is, structural change, we're going to mark our Fibonacci retracement. Okay? And remember that in Fibonacci, the most important value is always the
[04:17] 61.8% or 50% level. So, the confirmation is very simple: if the Fibonacci retracement coincides with the 50-period or 35-period moving average, then we practically have double confirmation, which will
[04:33] lead us to a perfect trade. So, pay close attention. This is how we're going to use one tool with another. Once the moving average crossover occurs, we're going to mark our Fibonacci retracement at the point where the
[04:48] see here, quite simply, the moving average coincides with the line of the... Fibonacci Golden Zone here. This is the perfect point since one strategy coincides with another, and the moving average is moving below the
[05:04] Fibonacci Golden Zone line. This means it's quite simple. This is the point where our two strategies complement each other, and you'll be able to place attention. Remember that if you want to start in the world of trading, in the
[05:17] description of this video you have the links to the brokers I use binary options. So if you want to start trading, be sure to click the part of my private trading academy, we now have a new
[05:31] also have all the details for my private academy in the video description. So let's continue. Okay, traders, we already have our moving average crossover and our Fibonacci level marked here. Now it's as easy as waiting for the
[05:44] chart to reach this point. You'll use this same entry model in forex, futures, cryptocurrencies, and binary options. Only the confirmation or timing of the trade will change, obviously in the case of
[05:56] forex. Well, you're going to Looking for a trade on the next impulse, any other market, once the chart retraces to reach our point of interest, that's where we'll place a trade. If it's
[06:11] binary options, a 5 or 7-minute trade. In forex, you'd let the chart extend through the entire impulse. So, this is what we need to confirm one strategy with another: simply for the
[06:24] chart to touch this line. How should it do so? Because that's also very important. Normally, you need the chart to reach a volume candle that extends to touch your line with good intention. This tells you
[06:36] that the chart will actually respect the point of interest. It's not the same as a chart just randomly reaching a line, somewhere between reaching and not reaching it. That causes a lot of doubt in a movement, and it might simply be part
[06:50] of a larger impulse. But when the movement arrives with intention and the candle give us a perfect trade. So, traders, let's see what happens with this movement. We see that our chart develops,
[07:04] and look closely at a candle. It extends to touch our point of interest, which is exactly touching the Fibonacci line and the moving average crossover. So this is the exact point where we should have traded
[07:19] because what happens once the chart respects both strategies is that it starts to give you a move with greater depth. That's the advantage of using 12 charting tools at the same time; it will lead you
[07:32] to have perfect trades. So let's look at another example, traders. We're looking at the euro and the NZD, and we're going to do exactly the same thing. We see that the moving average is above the chart. So, to
[07:45] we need the moving averages to cross below our chart to mark our Fibonacci retracement. Otherwise, we can't combine one strategy with another. Remember that we're
[08:01] point at which the chart changes structure is where we'll confirm one strategy with another. So, pay attention to what's happening, traders. Our moving averages are starting to develop, but look very closely; they
[08:14] cross below our chart. This is our first indication that we're going to start seeing a structural change. Now what do we need? Well, we're going to mark our Fibonacci level across the entire length of the impulse that just
[08:27] Fibonacci level from the beginning because each of the movements has its retracement. It's very easy. Look, if the movement where the moving average crossover occurs has small retracements, then you're going to mark the Fibonacci level across the
[08:42] entire length of the movement, okay? Because then it's a complete movement, it would be the whole length. But what happens if the previous movements are having their retracements? Then you're only going to
[08:54] mark it on the last movement after the crossover. This will depend on how the movement unfolds before the moving average crossover. As in this case, each of the movements has its retracement, so we're only going to
[09:07] mark it on the last impulse. This is how you can most effectively confirm one strategy with another. So, let's see, traders, the moving average crossover has just occurred, and we mark our Fibonacci level from the beginning
[09:21] to the end of the movement, and what can we see here? Exactly the same as a little while ago: our moving average is going to cross exactly with our Golden Zone Fibonacci line. Now, what do we need to wait for? So that our
[09:34] chart reaches a point where we can confirm one strategy with another, and that's what helps us have double confirmation that the chart will effectively undergo a structural change. Remember that normally in trading we must
[09:48] operate based on entry models. So I was telling my structural change entry model is an entry model that all traders should have in their repertoire since
[10:00] all charts change from one movement to another, and in this way, if you like both strategies or both tools, you can complement them quite see what happens, traders. There's our chart. Look there, pay attention. The
[10:15] chart here reaches exactly touching the 35-period moving average, the fast average, reaching the Fibonacci Golden Zone, and that's where we have the confirmation. For our operations, remember again, in the case of
[10:29] forex, you're going to look for the entire extension of the impulse, the same for stocks and cryptocurrencies, and in the case of binary options, you would look for a trade of approximately 5 or 7 minutes, which is how far the chart can go during the entire
[10:42] impulse. This will depend on the timeframe you're using. You'll find that these types of entry models or strategies work for any timeframe, any broker, and any asset,
[10:54] since these tools are chart-based. That is, whether you're looking at the euro or gold, these tools rely on charts. daily timeframe, it will be exactly the same, only the
[11:08] chart will take longer to give you confirmation. If you use a one-minute timeframe, you'll likely get confirmation much faster. So what happens, traders? The chart reaches our
[11:20] Fibonacci Golden Zone and, magically, it respects the extension of our impulse. In this way, we're confirming both Fibonacci and the moving average crossover, which, as I 've mentioned on my channel for
[11:33] almost six or seven years, are probably the two easiest and most effective strategies for any trader in any market. Obviously, you shouldn't neglect the structure of your charts, as this will
[11:47] give greater confidence to the trades you're making. But if you can complement these two tools, then you have a strategy here that is... It's a real money-making machine, so let's look at
[11:59] one last example, traders. Look here, we have the euro and the yen. The moving averages are below. Perfect, we have a chart trending upwards. What happens when the moving average
[12:11] Well, this indicates that we have a sideways market or a range. That's why, during my first years in trading, I always had both moving averages set up. But something always happens: many traders,
[12:26] when they learn a new strategy, completely forget about the charts and only pay attention to their graphical tools. So don't make that mistake. Use these tools to support your analysis and
[12:39] your trading. So pay close attention: to use the combination of strategies, you first need the chart to show a moving average crossover. If it doesn't, then you can't trade it yet. Look very closely there; the
[12:52] chart hasn't crossed yet. Here it starts to show the moving average crossover. Perfect, there it has, the moving average crossover, and obviously, it's clear that the chart here will start to show a change in structure towards the
[13:05] downside. Quite simple. But how will you know when? When an impulse ends, it's easy. It's not about trying to predict the price. How can I know when an impulse has ended? Easy. Wait for it to end. It's that simple.
[13:18] Because sometimes people tell me, "Hey, I don't know when a move is going to end." Well, you don't have to know. Wait for it to end, and that's it. So, let's see, traders, we haven't marked our Fibonacci yet. Our chart keeps
[13:31] moving, it keeps moving, it gives us a move that I don't know if there was a pay attention: when we see that the chart starts to give us a move with greater depth, then we mark our
[13:45] perfect Fibonacci. And here, where the moving average crossover occurred, that's not where we trade. We never trade at the crossover because the crossover occurs at the lowest point of an impulse. You trade when the crossover happens
[13:57] and the chart goes back, that is, the chart shows you the moving average crossover. You need a pullback, and that's where you're going to trade. Because if you trade at the moving average crossover, you would be making a serious mistake, since that is...
[14:10] The highest point of an impulse. So always wait for the pullback, that's what we're looking for, and obviously after the crossover, we're going to confirm with Fibonacci. And that way, you'd be combining one strategy with another in the Fibonacci Golden Zone
[14:23] along with the moving average crossover. So, pay attention, traders. Here we mark our line in the perfect Fibonacci Golden Zone, and now we're simply going to wait there. The moving average crosses with the Fibonacci Golden Zone,
[14:37] confirmation. And notice how the chart starts to reject exactly the price where we have the Fibonacci and the moving average crossover. This allows you to know how far the chart will retrace and how you'll
[14:52] have a structural change, reinforced by the moving averages and Fibonacci. So, it's quite simple, traders, to combine one strategy with another. Here we go lastly. First, you need a trend or some kind of structure
[15:07] that's already confirmed. Easy. Once the moving averages make the structural change, that's when you're going to mark your Fibonacci on the movement of the structural change. Perfect. And if the moving average coincides with the zone of the... The
[15:22] Fibonacci golden zone means that the moving average coincides with the Fibonacci golden zone. At that moment, you simply wait for the chart to retrace. This will result in
[15:35] a completely perfect trade using the two best strategies for winning in trading. So I hope you enjoyed this our channel, leave a like on the video, and
[15:48] watch with the best trading course. Click here, and we'll see you trading course. Click here, and we'll see you next time, traders!
⚡ Saved you 0h 15m reading this? Transcribe any YouTube video for free — no signup needed.