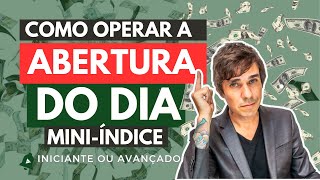

Trading from Denmark: The First Bar Strategy
46sIntriguing setting and promise of a universal profitable strategy captivates viewers.
▶ Play Clip"The title promises a guide to trading the mini-index opening, and the video delivers exactly that with a live example, though it includes a sponsor segment and some filler."
In this video, Viana demonstrates his approach to trading the opening of the Brazilian mini-index (WIN) from Denmark, emphasizing that the strategy works regardless of location. He walks through his pre-market preparation, the use of an auction candle, and how he identifies high-probability entries with confidence, sharing a live example that yields 300 points in about 20 minutes.
Viana explains that he is in Aarhus, Denmark, and that the market opens at 9 AM local time (1 PM in Denmark). He emphasizes that the strategy of trading the first bar of the day is profitable regardless of the trader's location.
Beyond the standard opening trade, Viana looks at institutional players (Morgan Stanley, Bradesco, JP Morgan) to confirm the direction. He notes that when these players are on the same side, it increases his confidence in the entry.
Before the first bar appears, Viana draws a virtual candle based on the opening auction at 8:55. He marks its high and low, and observes that it often opens at the close of the previous candle.
When the virtual candle is followed by a nearly identical bar (a marubozu with almost no wicks), Viana interprets this as a strong signal that the market will continue in that direction, making him more confident in entering on the first bar.
Viana checks the order flow from major banks: Morgan Stanley, Bradesco (Agora), and JP Morgan are buying, while XP is selling (providing liquidity). This alignment supports his long entry on the first bar.
After a rejection from the first candle, Viana goes short but exits at break-even. He notes that in recent days, such rejections have given gains, but you must act quickly.
Viana re-enters long after the market shows a pullback, using the low of the previous bar as a trigger. He mentions the 'ignored bar' lesson from his candlestick course, which justifies this re-entry.
The second trade pays off with 300 points, hitting his usual goal. He concludes that 20 minutes of trading is sufficient, and reiterates that location doesn't matter for trading success.
Viana's method centers on trading the first bar of the day with a pre-drawn auction candle, using institutional order flow and candlestick patterns for confirmation. The video demonstrates a practical, location-independent approach that yields consistent small profits in a short time.
What is the first step in Viana's opening trade strategy?
Draw a virtual candle based on the opening auction at 8:55, marking its high and low.
02:03
What does a marubozu candle indicate in this context?
It indicates strong continuation in the direction of the candle, as it has almost no wicks.
02:44
Which institutional players does Viana monitor for confirmation?
Morgan Stanley, Bradesco (Agora), JP Morgan, and XP.
03:10
What is the 'ignored bar' concept?
A candlestick pattern where a bar that fails to break the previous bar's high/low is ignored, and the trader re-enters in the direction of the trend.
06:48
What is Viana's typical profit target?
300 points.
07:02
Location Independence
Demonstrates that the strategy works from anywhere, debunking the myth that you must be in the market's country.
00:03Marubozu as a Signal
Provides a clear, visual confirmation for entry, making the strategy actionable for viewers.
02:44Institutional Flow
Shows how to use order flow from major banks to increase confidence, a professional-level insight.
03:10Ignored Bar Re-entry
Introduces a specific candlestick pattern that justifies re-entering after a pullback, adding depth to the strategy.
06:48[00:03] in Denmark, in the city of Orros, and I'm going to show you how I operate from here. The market opens at 9 AM, which here happens at 1 PM. No matter where in the world you are, you'll trade the
[00:17] first bar of the day and it will be profitable. And today I'm not just going to show you how to trade the market opening, which I show in almost every video on the channel. I'm going to show you extra things, which players I usually look at to have more
[00:31] confidence in the entry I'm making. In other words, I'm going to show you something more directly from here on the other side of the hemisphere. It's freezing cold, so I can show you this setup for today, guys. I don't need more
[00:48] than this. One screen for those who say, "Oh, you need a lot of screens," just this. I manage my life even from my cell phone. Look at that beautiful church over there, guys! Look at that view! It's freezing cold, but it's warm inside the room,
[01:02] but it's warm inside the room, and it's an opportunity for me to and it's an opportunity for me to use my Nomos shirt. Open your account at Nomos.com. Open your account at Nomos brokerage XP.
[01:18] The link is in the description. Okay, let's go to the video, roll the
[01:32] welcome! I'm Viana, it's a great pleasure to have you here on my channel. So, go ahead and leave a like, subscribe to the channel, activate the bell, become a channel member (there's a button there for you to become a member), and follow me on other networks
[01:47] for other tips and content. Guys, let's go straight to the chart. Well, I'm here with the 5-minute Dom index chart. As you can see, there's a bar drawn here, which I draw at the opening auction.
[02:03] So, before the first bar appears, we usually draw it by hand because only this little bar appears, you see this little bar here that's at this moment here, before the first clock of the
[02:17] day appears, at 8:55, this same bar appears here, but the first clock hasn't appeared yet, right? It only appears after 9 am, and then I kind of trace it. It appeared here, I trace its minimum here, as it went down a little,
[02:32] I mark that it goes down a little, it ended up here, right? it ended up here, right? This bar keeps moving here and it usually opens. It opens at the close. So there was this green candle here already pushing
[02:44] this green candle here already pushing upwards, the second candle also going observed: when the virtual candle, which is this candle I draw before the opening, during the auction, it's followed by another bar that's
[02:58] followed by another bar that's practically identical to it, a marubo bar, practically just the body. It only had this little bit of wick here, right? This one only had this little bit of wick. I already know that this market won't want to go back to the
[03:10] adjustment, it will want to continue rising. So it makes me more confident in entering in the same direction here, right? On the first bar, for example, and I see that some players, such as Morgan Stanley, Agora (which is
[03:27] Morgan Stanley, Agora (which is Bradesco), JP Morgan, and they are on the same side, they are buying, and XP is selling, right? XP provides liquidity to the market here in the mini-index, right? So I'm more confident in entering on the first bar. Then there
[03:42] confident in entering on the first bar. Then there was this rejection here, I ended up going short here, but I exited at break-even, I exited at break-even, and this rejection is when it exits the first
[03:56] candle and returns. It has given gains in recent days, but you have to pay quickly. Since it hit break-even, I already changed the... Here's my hand here, ready to buy, and I paid. I got those 300 points, and now I'm going to show you
[04:11] how and when I entered these trades. Okay, as you can see, trades. Okay, as you can see, draw the auction. So this little line here, where it opened at 8:55, and if it
[04:29] opens now, I simply draw it here, which is the end of the candle. The candle will have this size here. I teach this in the auction course; the link is in the video description. Look here, the bar.
[04:44] I draw it like this: two clicks, right? I put it in green here, I draw it by hand. It was the auction candle. Usually, this bar closes where the market opens, right?
[05:00] So it went from down there to the market opening, and here it's calling me to buy, quite substantial, this 470
[05:14] points. Let's enter for about 10 seconds here, at least 6 seconds. Everything indicates that it at least 6 seconds. Everything indicates that it will pay very quickly, right? The first bar of the auction already went all the way up, the second calling, right? And
[05:29] remember, the market fell a lot these days. These days the corrections are faster, right? Every time the market is correcting, you have to be faster, that's why some people like to trade against the trend, because when it comes back, it comes back
[05:41] faster than following the trend. Usually here, look, it even seems like a very short distance, right? 150 points, that's why I always say that you
[05:53] 're trading a car at 150 miles per hour, you brake, it continues a little forward. Look, the market woke up at 200 miles per hour, it pays the first bar. Now just wait, if it continues going up,
[06:07] I'll go with it, I'll keep trying to find the top here, I won't follow the day's trend which is upward, it's wanting to close up there, I 'll enter, okay, let's go,
[06:19] 'll enter, okay, let's go, I believe it already pays here, right? Exit at break-even, unfortunately, if it gives a little shake, if it doesn't fall completely now and comes back, I can try to
[06:35] enter again, because now if it's going to fall, it will go all the way down. If at least the low of the previous bar, I buy buy again. Well, this bar didn't have the strength to
[06:48] beat the previous bar, so I bought. Okay, so I'm already protected here, right? The lesson on ignored bars in candlestick trading. If you're into candlestick trading, go to the ignored bar lesson and you 'll understand why I bought
[07:02] again, and it paid off, 300 points in my pocket, hit my usual goal, right? 20 minutes of trading here, we don't need more than that, and I'll leave it at that. Danish folks,
[07:17] today, Monday, there's a show here, Monday, Tuesday, Wednesday, and Thursday, imagine, Monday, all the tickets sold out! So, folks, let's do a show for those people who want to hear some good music, and that's it. It doesn't matter
[07:31] where you are. Many people ask me, "Viana, I live abroad, can I trade?" "Can I trade from wherever you want?" "The important thing is to put money in your pocket." See you in the next video. I want to learn how to trade dry charts without
[07:44] indicators, looking only at candlesticks, the famous Price Action, with videos teaching step-by-step all the rules of the method and essential tips to of the method and essential tips to win in Day trading. The "Operating Candles" course is
[07:59] on the Hotmart platform. The link to access all the material can be found in the description of this video. See you inside Hotmart!
⚡ Saved you 0h 08m reading this? Transcribe any YouTube video for free — no signup needed.