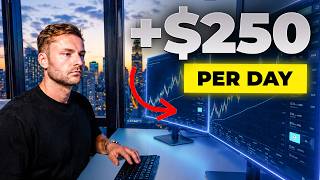

From $3 to $10,000 in 2 Hours?
45sThe extreme range of earnings creates curiosity and shock, hooking viewers to learn the secret.
▶ Play Clip"The title promises a strategy to scale to $250/day in 1-2 hours, and the video delivers a detailed framework, though results vary."
The video presents a complete trading framework designed to help traders scale from small daily profits to $250+ per day by trading only 1-2 hours. It covers the correct mindset, market selection, a repeatable strategy, and account growth methods.
The trader trades about 2 hours per day and can make $3 to $10,000 per session, but it took 9 years to reach this level.
The framework includes: 1) correct approach to trading, 2) picking the right market, 3) a simple repeatable strategy, and 4) realistic account growth path.
The trader emphasizes a 47% win rate and gradual growth over 9 years, contrasting with exaggerated claims of millions per month.
Most beginners focus on profits, which leads to failure. Instead, focus on proxy goals like following rules and measuring performance.
Proxy goals are compartmentalized objectives (e.g., following rules) that collectively lead to profit. Units of R measure risk and reward per trade.
Backtest a strategy over 30 trades to find net R. Then calculate required risk per trade to hit daily goal using formula: risk per trade = daily goal / (monthly R / number of trades).
Stocks: liquid but limited hours and leverage. Futures: near 24/5, good leverage. Forex: 24/5, low capital, but news-sensitive. Crypto: 24/7, high leverage, but restrictions vary.
To risk $500 on a trade, stocks require ~$167k capital, futures ~$1,700, crypto with 100x leverage ~$1,600. Lower capital needs make futures and crypto accessible.
Prop firms provide simulated capital for a fee; passing evaluation gives access to funded accounts. Leverage on exchanges amplifies position size but increases liquidation risk.
Wait for session open (e.g., 9:30 AM). Identify first change of character (e.g., higher low after downtrend) as potential reversal signal.
Look for a fair value gap (three-candle momentum pocket) aligning with 61.8% Fibonacci retracement. Enter at the midpoint of the gap, stop loss outside the gap candle, target 3-4R.
Once price closes above the most recent swing high (in an uptrend), move stop loss to break even, making the trade risk-free.
Use TradingView replay to backtest strategy over many sessions. Determine average R per month. Then calculate risk per trade to hit daily goal. Example: 14R in a week with $250 risk = $3,500.
By focusing on proxy goals, using a repeatable strategy based on fair value gaps and Fibonacci, and properly sizing risk, traders can scale from small accounts to consistent daily profits of $250+ in just 1-2 hours per day.
What is a proxy goal in trading?
A compartmentalized goal that focuses on process (e.g., following rules) rather than the end profit, which naturally leads to profit.
04:48
What does 'units of R' represent?
Units of R measure risk and reward per trade. 1R is the fixed risk amount; profit targets are expressed as multiples of R (e.g., 3R).
05:43
How do you calculate the risk per trade to hit a daily goal?
Risk per trade = daily goal / (monthly R / number of trades per month).
07:17
What is a fair value gap?
A pocket of momentum where three candles leave a gap with no wick overlap between the first candle's high and third candle's low (bullish) or vice versa (bearish).
18:07
What Fibonacci level is used to align with the fair value gap?
The 61.8% Fibonacci retracement level.
18:37
Where is the stop loss placed in this strategy?
Outside the low (for a long) or high (for a short) of the fair value gap producing candle.
19:30
When do you move the stop loss to break even?
When a candle closes above the most recent swing high (in an uptrend) or below the most recent swing low (in a downtrend).
19:47
What is the typical profit target for this strategy?
3 to 4R (three to four times the risk).
19:30
What win rate is needed to be profitable with a 1:4 risk-reward ratio?
20% win rate is break-even; 30% is profitable; 40% is highly profitable.
24:23
How much capital is needed to risk $500 in futures vs stocks?
Futures: ~$1,700; Stocks: ~$167,000 (assuming no leverage).
12:07
Profit-Chasing is a Trap
Explains why focusing on money leads to failure and introduces proxy goals as a solution.
03:11Proxy Goals and Units of R
Core concept that separates process from outcome, enabling consistent performance measurement.
04:48Formula for Risk per Trade
Provides a mathematical method to align risk with daily goals, making scaling systematic.
07:17Fair Value Gap Strategy
A specific, repeatable entry technique combining price action and Fibonacci.
18:07Risk-Free Trades via Break Even
Shows how to eliminate risk early, a key principle for long-term profitability.
19:47[00:00] I trade for about 2 hours a day and can make anywhere from $3 to $10,000 a session. But this wasn't the case 9 years ago when I got started and I was feeling completely lost, completely confused, wasting time. And it took me
[00:12] miracle or wait years and years to master complicated trading concepts just to be able to scale my trading up to 100 to $250 per day. And what's funny is
[00:24] that most traders don't know that as long as you have a repeatable and simple strategy to follow that's designed to scale, you can pretty quickly get from 100 to 50 plus per day. But that's only if you actually know how to do it and
[00:37] this video. So, I'm going to share with you my full strategy and process that I want and how exactly to be able to scale it up to daily goals all designed around
[00:52] trading for 1 to 2 hours per day. So, if you're working or you're in school or you're locked in on trading, ready to go full force. This is going to be a simple Okay, so like I said, what I'm going to be showing you is basically modeled
[01:06] around trading for 1 to two hours per day. and it's how to start trading to be able to scale up to this daily goal. Now, this daily goal isn't set in stone. I'm going to show you how to basically apply this to anything that fits with
[01:18] you can understand basically this game plan. So, first thing that I'm going to be showing you is how to actually approach trading the correct way. application-wise. We're going to fix that. Step two, picking the market that
[01:35] objectives, where you live, etc. We'll go over that. Step three, I'm going to show you my simple, repeatable trading strategy that I follow. And this is the trading career. So, I'm going to be showing you that framework and how to
[01:51] to show you exactly how I grow accounts in a realistic path to follow. This is what I've been able to do this year with this trading model, in this framework.
[02:03] And keep in mind, this is with a 47% win rate. I'm not right all the time. I'm probably not the craziest trader on the internet where they're claiming to make millions of dollars every single month. This is me grinding out after 9 years to
[02:16] be able to grow myself up gradually. And what I want to remind to you guys is own timeline. I'm just going to be showing you my timeline, but make sure you take it one day at a time and focus on yourself and don't focus on what
[02:30] proud of, this was definitely not always the case. In the very beginning of my like this, by the way, where all you're doing is losing. That's part of trading.
[02:43] But this is a very frustrating stage if you're not looking at trading the right when you're learning. But as long as you're on the proper path, it's not a waste of time. But I was literally just wasting time because I was looking at
[02:58] trading the wrong way. Okay. So, what I'm aiming on showing you today is if I started right now from zero, how would I start trading and then be able to get to this daily goal and basically build the framework to set any daily goal that I
[03:11] trading the right way. Because this is how most people do it. And this is why a profitable stage. And that's because you start off chasing in trading focused
[03:26] around profits. Obviously, we're trading to make money, right? But that doesn't mean that you need to only play with that objective. If you want to accomplish anything in life that's complex, chasing the end result is
[03:38] focusing on the wrong things in the early stages. And that's why it's difficult to get to the final destination is because it's not obvious trying to go towards the shiny object. That's going to lead you astray unless
[03:54] have done this to be able to show you how to sort of circumvent all of that. So, this is how most people do it. They find a trading strategy approach online done this. You've opened the trading account and said, "Okay, I want to try
[04:10] to at least make, you know, $1,000 this week." All you're doing is trying to trade whatever general approach you've learned with the dollar amount in mind. What this does to humans is it makes you change your behaviors, which are
[04:22] extremely important to have focused when you're starting off with your trading journey. The behaviors of what you do shouldn't be dictated around your supposed to do, and that's how money is extracted out of people who are not
[04:36] profitable in the markets. So, the way that professional traders actually do goals. So, obviously, our goal is to get to our dollar amount. what a proxy goal
[04:48] is. It's basically a compartmentalized sort of separated goal that as long as you focus on these things that don't directly relate to the end goal. All of them come together and by default end up giving you your desired result. So I'll
[05:01] have fixed rules. Those rules are going to allow us to measure our own performance. So concept comes first. Then we need actual rules within our trades. When X, Y, and Z happens, that's where I'm entering the market. And all
[05:16] much money we can expect to make each time we place a trade within these rules value. So the way we can do this and the way you should start off trading
[05:30] rules and then test implementing these rules over say a month. And what we're looking for is something called units of R. Okay. Okay. And what these units of R
[05:43] are basically allowing us to do is if say we want to enter the market here. Say our rules are saying we need to place an entry here. We'll set a fixed amount of risk for an anticipated amount of profit. Say for this example, we have
[05:55] a 1:3 riskreward ratio. Meaning one unit of risk or negative 1R is what we're putting on the table for the opportunity to make three units of risk back. If we're risking say 100 on this, we would be looking to make 300 over here if
[06:10] right now. All we need to do is treat it like a game and literally look at it as negative -1R if we lose and plus 3R or however many R we make if we're right
[06:22] about our trade idea. What this is going to allow us to do as traders is be able to evaluate our behavior trading this strategy over a certain amount of trades and figure out in a very simple number whether or not we're profitable or not.
[06:35] What this is going to do is then design how much we need to risk per trade or how much money we need to put towards this in order to then hit our dollar amount goal for the day, for the week, for the month. Notice how we haven't
[06:49] even opened an account yet. That's because you don't need to do that until calculation. Say we have our simple rule set. We do something called back test over 30-day period of when we're trying to trade. And I'm going to show you my
[07:04] understand, say we do 30 total trades and we net [music] out 15 R. All we need to do is follow this formula, which may seem slightly complicated, but it's
[07:17] unit of risk needs to be in dollar terms or percent terms of your account. And that's going to be our R. So if we take our goal of 250 a day, but like I said,
[07:29] this can work with any amount. and say our strategy produces 30 trades a month. And say that strategy is able to make overtime positive 15 units of risk over those 30 trades. That's going to mean that of the 30 trades that we take, if
[07:43] our goal is 250, that's giving us a monthly goal of this amount. So all we need to do is take the total we're looking to make based off of our daily goal and figure out what our trading strategy followed very repeatably and
[07:57] amount which is going to show us how much we need to risk in this risk area in order to by default hit this daily goal and hit this amount that we set for
[08:09] ourselves. Okay, which once again can be calculated with this calculation and can be done with $10, $50, $100. I'm going to show you way more examples of actually how to figure this out. And that is going to allow us to pick a
[08:21] monetary goal based around our strategy. Then we're going to open an account and actually start to trade it once we have proof of concept. What this is going to expensive mistakes by opening accounts too soon. But it's also going to set the
[08:37] expectation that all you need to focus on is your trading and being consistent and not focusing on money and letting it be a byproduct of you being a good saying? That right there is like the secret sauce of trading. So now we
[08:51] understand those fundamentals. Let's get into step number two, which is figuring out what market to trade and what instrument to trade. So, there's a few forex, and crypto. With the stock market, it's very liquid. There's a lot
[09:06] of participation. It's very regulated, and it's pretty easy to understand. The really any sort of leverage capability, and you're limited from market open hours, which is from 9:30 Eastern to 4:00. So if you're not able to trade
[09:21] during that period, you really can't trade the stock market. Futures has way better access to capital. It's nearly 245, just as session breaks. Some of the with leverage there. So that's sort of the case. So futures is a really really
[09:37] good option. That's why a lot of people trade futures. Forex has a larger market 245 requires a very small amount of capital to get started. However, it's very news sensitive and it's very hard to find an edge in forex. You need to
[09:49] things is going to affect how currencies move. And it's not very well regulated. Crypto is 24/7. You can start with a low amount of capital. You can trade or you
[10:01] can hold. The only downside is sometimes there are some restrictions depending on that I'm going to share with you a little bit later in this video. So crypto. And I'm going to show you how this can work for both. Okay? Okay, so
[10:16] in order for us to figure out what market is right between futures and crypto, we need to ask ourselves two questions. First, how much capital do we two, how much money do we want to make off of these positions? So, if we look
[10:31] the team. I was able to enter in here, make 6.27R, so 6.27 times the amount I was risking to be able to profit a little over
[10:43] $12,000. Okay. So, to answer question number one of how much money are we going to need to place a trade like this? Say if we're looking to risk $500, for example, on this trade so that if we're right, we're making around $3,000.
[10:56] The way we calculate this as traders is by finding the entry value where we're looking to enter right here, subtracting by the stop-loss value, which is going to give us this value, and then the dollar amount or percent of the account
[11:09] that we're looking to risk. So in this case once again that $500 would be the dollar amount that we want to risk. Okay. So if we have 500 divided by this amount that's going to be 500 divided by $18 in this case which is the difference
[11:23] that we need to enter at this price in order to risk exactly $500 and keep that consistently and for you to be consistent as a trader is to make sure
[11:38] that your unit of risk is predetermined and consistent throughout your strategy. So, if we look at this across the several different markets, again, we have stocks. You're not really able to get any margin or leverage to be able to
[11:51] get access to more capital. So, the 2200 units is going to cost us in order to enter the position, even if we're only risking the $500, $167,000. So even if we're able to get 2x leverage or some margin, it still requires a
[12:07] tremendous amount of upfront capital to be able to start the trading journey to market, this is completely different. Okay, so in the futures market, we're operating something called contracts. Those contracts have certain dollar
[12:22] amounts per point that the market moves. So simply put, in a situation like this, if we wanted to risk $500 and the stop distance is 7.25 25 points and it's $2 per point. That would mean that our stop-loss value, so once again, this
[12:36] value between here would give us $14.5 of risk per contract, which would mean we'd need 34 contracts at this price, which most brokers require $50 worth of
[12:48] margin per operating contract. So, in order to place a trade like this, risking that $500, now we only need about $1,700 worth of capital. Now, we starts to go to draw down. But you can still see this is a dramatically lower
[13:05] amount required in an account. If you want to start, say, at 100, now we can divide this by five and now you only need say $300 in an account. And with crypto, we can take this to an even further level. Once again, we need 2,200
[13:18] position of $167,000. Now, what we can do in crypto is actually be able to use something called leverage. And what this leverage is allowing us to do is effectively divide the amount of actual capital that we
[13:33] need by whatever our leverage amount is, which is given by the exchange that we're trading on. So, for example, if we wanted to place this exact trade with 2,200 units with the $500 risk with 3137 as our profit target, the capital
[13:47] required from that trade would go all the way from the 167,000 at 100x leverage. Now, we only need about $1,600 worth of capital to be able to place position size. So, the fees are going to be increased if you're trying to use and
[14:04] you can use 25x leverage, it gives you a lot more flexibility to be able to place accounts. Hence why once again, I'm focusing primarily today on the futures
[14:19] in crypto market. But now we actually have to understand how to get access to capital in futures and crypto. So there's two main ways to get access to basically get the firm to give you effectively simulated capital and all
[14:35] you're trying to do is play within their trade rules and you're able to use say for example 50k in an account. You pay say between 50 and $100 to be able to have access to it. Use the firm's rules and you get to start off with 50k. Say
[14:50] your profit target is 55 and your draw down is 475. If you hit this draw down value, the only amount of money that you're liable to pay is the fee that you profit target, as long as you're following within those rules, if you're
[15:06] able to pass the evaluation and get into a funded state, any profit that you make, now you're able to request payouts on and you're able to earn that capital trading with the proper large amounts of money. The second option is using an
[15:19] example, we're using that $50 to $100 with 100x leverage can give you access to say between 5 and 10K with no rules. Okay? And the way this works is
[15:31] basically say we have $1,000 in an account and say we use all of that on a trade. If we're using no leverage, the account would have to drop by $1,000 in order to reach zero and for you to be liquidated. If you start to add
[15:44] leverage, say I add 2x leverage, now I'm going from zero being my draw down to 500. So now we've cut that directly in half. Say we're using 4x leverage. Now that means that the price only needs to go down $250 for us to reach that same
[15:58] liquidation level. But obviously if it moves up even this much, we've now enter in here and set our stop-loss value here, if we want to risk, say,
[16:11] $100, I can click into my trading view and click on this long position here, going to require me to get $833 units. So you can see if I'm entering in
[16:23] at 6661 and I need 833 units, that's going to bring my total requirement for the position up to about $55,000 only to risk $100. If I'm able to now
[16:36] say apply 10x leverage, you'll see the value remains the same, but now it's only going to cost me $5600 to enter the position. And if I use 100x leverage, you'll see now the cost of this position is literally only going to cost me $600
[16:51] just more implied risk. Really, what it's allowing us to do is be able to the capital to be able to take advantage of these moves. Okay, so now that we've
[17:05] covered step one of how to approach the market, and step two of how to pick the going to show you the framework that I use to trade every single day for about going to look at a bunch of examples that happened over the past week so you
[17:22] step number one, we're going to be waiting for our session open, whether session that opens at 9:30 a.m. And what I want to do is wait for something
[17:36] I have say a downtrend where I have the highs getting continually lower and the lows getting continually lower and then after a lower low we get a candle that
[17:49] basically what I'm doing is looking to identify the first change of character that happens in this session. In step number two, what I want to do is see value gap. Now, a fair value gap is basically a pocket of momentum where we
[18:07] see a series of three candles where the first candle's high wick in the case of a bullish fair value gap where the market's moving up does not overlap with the low of the third candle's wick and it leaves a space here with no wick.
[18:20] same thing is true in the opposite direction for a bearish fair value gap. pullback into what's called my golden 61.8 ratio and the middle point of that
[18:37] fair value gap. So this is something called a Fibonacci retracement. And basically what this is going to show us is premium and discount zones on a move. And this 61.8 level is a ratio that price for whatever reason typically
[18:50] pulls into before having a continuation in the opposite direction. So, what I want to do is be able to take my fib starting here up to the most recent high point and have a fair value gap align between this 50 level and this 61.8
[19:04] to filter through fair value gaps and find the most important ones. But then what I'm going to do is wait for price to trade into the 50% midpoint of this
[19:17] fair value gap. And that's going to be where I'm looking for my entries. What I'm looking to do with my position is basically set up my stop loss outside of the fair value gap producing candle. So underneath this low would be my stop
[19:30] loss. So this is my negative 1R. And I basically want to target 3 to 4R in the opposite direction. Now I have ways of holding trades a lot more, but I just doing is waiting for a candle to close over this most recent swing up before
[19:47] our entry. What that's going to do is say we get our candle to close above this level. That's going to allow me to then reduce this risk all the way to break even. So now I have zero risk on the table and I'm just allowing my trade
[20:00] to run if it's going in my direction. The reason for that is because if this is a new uptrend that we're trading where we have a low, a high, a low here, shouldn't have price producing any sort of close below this level because that
[20:17] potential downtrend. So, we want to be out of the trade. So, this is a good we're out. And if we're right, we've eliminated risk and allowed ourselves
[20:30] play up to our 1:3 1-4 target. So now let's take a look at how this actually looks set up on a real chart. Okay, so right here we have our 930 open. That is then finally produced a new low out of that uptrend which is now starting a
[20:47] have several fair value gaps forming on this move. And by the way, if you want description and check out tools, okay? And you'll see something called a
[20:59] foundation indicator. This is going to allow you to be able to add this session marker here, as well as be able to turn these fair value gaps on your chart fair value gap. What I'm going to do is take that Fibonacci. So, click on this
[21:13] button on trading view here. Go to my Fibonacci. Click at the beginning of this gap is sitting directly at that 61.8 level. Okay, price moved down a
[21:25] within our position. So I'm looking for the midpoint of that area. And I want to place my stop loss outside of that potential area. Set my profit box to a 1 to4. And you'll see as price breaks back up through this level, that area was
[21:41] sitting at a good discounted zone. Immediately starts to reject down. In to take us out for a full 1 to4. Now, I do have strategies to trail this a lot
[21:56] more, and I'll sort of explain that here in a second. Okay, so let's go to gives us our change of character. If we take our Fibonacci level from there to
[22:08] loss like this and say we wanted to risk $100, that would mean that we need 588 units. So, we can enter in with 588 units. Set our takerit down to 1 to4.
[22:22] Stop loss up over this high. Okay. And you'll see price comes right up, rejects down, makes a close underneath this [music] swing point. That's where we bring our stop-loss to break even. So, now it's a risk-free trade. And now
[22:34] out, okay? But that's why we reduce risk. Okay? So, let's take a look at another example. We have our 930 open. Price is still in a downtrend. Notice how we still didn't get a close or a change of character over this high yet
[22:48] until this point where we have a candle close up over this high level. So once again, we have a change of character. Now we can set up our 61.8 which brings Place my stop loss underneath that candle up to 1:4. Set my stop loss down
[23:05] to this level. Take profit up here. You'll see price trades right into middle of that area. Now we can reduce risk to this break even level and allow from earlier in the month, this is exactly what I did. Entry was a little
[23:22] bit late but in that 61.8 area. I reduce my stop loss into the money as the trade is moving in my direction. Okay? And I was able to hold this position a lot But you can see the opportunity here just by being able to find these moves
[23:39] You'll see just off of one of these trades out of the open, sometimes I'll be able to find three to five of these per session. Just by getting one trade proceed to lose four trades in a row right after that and still be close to
[23:57] break even on my account. Which brings us to step number four, which is how to actually apply this daily to start growing your account. So, the first using, whether it's this one or another one, and actually go onto your trading
[24:11] view, click on this replay feature here, and just play back a bunch of sessions and trade it within your rules. And that's going to give you how much R you can expect to make based off of following the strategy over a month. And
[24:23] all we're trying to do is be able to figure out whether we're on the green we're getting 1 to four, if we're right 20% of the time, we're break even. If we're right 30% of the time, we're profitable. If we're right 40% of the
[24:38] time, we're highly profitable if we're averaging that one to four. Okay? And I just had the single biggest week of my entire trading career last week. So, this is not necessarily normal for me. However, this is an example of what I'm
[24:50] doing. So, I was able to take basically six trades. Over those six trades, I was able to make this amount of R over a week. So that's 14R based off of my 2K risk. So even with just allowing this model to play out over a week with that
[25:03] $250 per trade risk, that's this amount per week. Okay, even this 14R with $100 per risk would have been a $1,400 week. And that's why we have students who are focusing on doing exactly that. You can take Nednar, one of our students right
[25:18] of risk, proper risk management, but you can see he's well on his way to being Okay, this is one of our prop firm traders who trades futures also being
[25:31] able to absolutely smoke it using the prop firm approach, but focusing on these same exact concepts. So, this right here is exactly what you need to able to hit those daily goals or your trading goals in general. Okay, like I
[25:47] Okay, make sure you hit the like button, subscribe to the channel if you want to it right here. Okay, if you want to trade alongside the team and become a will see you all in the next video.
![How To Start Day Trading As A Beginner In 2025 [Full Tutorial]](https://img.youtube.com/vi/xHU5MHuUSKI/mqdefault.jpg)
⚡ Saved you 0h 26m reading this? Transcribe any YouTube video for free — no signup needed.