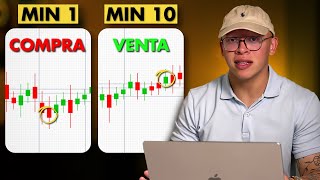

Make Thousands in Minutes Scalping
44sThe promise of quick, easy money from zero experience hooks viewers immediately and drives curiosity.
▶ Play Clip"Delivers a clear beginner scalping strategy with live demo, though some sections are repetitive and the intro drags."
This video provides a comprehensive beginner's guide to Forex scalping trading, explaining the strategy, tools, and platforms needed to start generating short-term profits. The instructor demonstrates a specific scalping method based on three-touch confirmations with fixed 7-pip stop loss and take profit, using the 1-minute timeframe during New York trading hours.
Swing trading (weeks/months), day trading (2-3 hours daily), and scalping (1-30 minutes per trade). Scalping is the fastest, suitable for those with limited time seeking quick income.
Forex means foreign exchange, trading currency pairs. Currencies only have value relative to each other (e.g., EUR/USD). No customers or inventory needed.
Use trend lines, ruler, and Japanese candlesticks. Focus on lower timeframes: 15, 10, 5, 3, and 1 minute. Add these to favorites for easy access.
Green candles = market up, red = down. Trends are determined by direction of candles over time. A downtrend is bearish, uptrend bullish.
A broker connects you to the real market. MetaTrader 5 is used to execute trades. Create a demo account to practice with virtual funds.
1 lot = 1 pip per movement. Set stop loss and take profit manually. Open a buy or sell order, and close by clicking 'Close position'.
Use a 1-minute timeframe. Add a Time Zone indicator set to 7 AM – 12 PM New York time. This is when major institutions are active.
Find a price level touched at least three times. On the third touch, enter a trade in the direction of the touches. Stop loss and take profit are both 7 pips (1:1 risk/reward).
Three touches at the top → buy entry. Price fluctuated slightly negative then reached 7-pip take profit. A 1% risk would yield 1% profit.
In MetaTrader, set stop loss at 1.07245 and take profit at 1.07385. Use Buy Stop order to enter automatically on third touch. Trade closed with $25 profit on $1000 demo account.
Companies like 'The Funded Trader' allow you to pass an exam to trade with their capital (up to $600k) and keep 85% of profits, avoiding risk of personal funds.
The presenter demonstrates a simple, statistically-based scalping strategy that can generate consistent small profits using a 1-minute chart and fixed 7-pip targets. For beginners, using a demo account or funded trading programs is recommended to practice without risking personal capital.
What is the typical duration of a scalping trade?
From 1 minute to 30 minutes.
01:23
What does 'Forex' stand for?
Foreign Exchange (currency trading).
01:49
Which timeframes does the strategy use?
15, 10, 5, 3, and 1 minute. Only the 1-minute is used for entries.
06:20
What is the New York trading window for this strategy?
7:00 AM to 12:00 PM New York time.
13:21
What is the rule for entering a trade?
On the third touch of a price level, enter in the direction of the touches.
15:00
What are the fixed stop loss and take profit values?
7 pips each (1:1 risk-reward).
15:28
What should you do if there are touches on both sides (top and bottom)?
Skip the trade – do not enter.
17:32
What is a broker?
An entity that connects the client to the real market, executing buy/sell orders.
07:52
How can you avoid risking your own capital?
Use a funded trading program (e.g., The Funded Trader) by passing an exam.
28:47
What does 1 lot represent in MetaTrader?
1 pip of movement equals $1 for a standard lot (varies by account).
10:53
Scalping is the fastest trading style
Clearly defines the key difference between scalping and longer-term trading, setting expectations for beginners.
01:23Three-touch entry rule
A concrete, rule-based entry criteria that removes guesswork, making it easy for beginners to follow.
14:19Fixed 7-pip stop and target
Simplifies risk management with a 1:1 ratio, highlighting the importance of consistency over win rate.
15:28Live demo shows strategy in action
Demonstrates that the strategy works in real-time, building credibility and trust with the audience.
27:52Funding companies reduce personal risk
Introduces a practical way for beginners to trade with professional capital, lowering the barrier to entry.
28:47[00:01] or that you have to spend hours in front of a screen to make But I've developed a method that will allow you to make thousands of dollars in just a few minutes trading, and we're going to call that method scalping. I'm going
[00:14] with zero experience. In this video, I'll guide you step by step until you make your first profit. Imagine you know nothing about trading, but you want to learn how to generate income. Then this video is for you. Let's begin. When we're going
[00:27] like any other profession, there are different ways to trade, and we can find three different types that are the most common and that swing trading. These are operations that can take weeks or even months, and
[00:41] lot of patience and who aren't in a hurry to leave their jobs to generate short-term income, or who simply want to dedicate a little time that you have to wait a long time to
[00:55] two months and maybe not see any profit in either of those months. We also have day trading. With day trading, you have to be very active and go through the... Less than 2 to 3 hours in the market every day to generate profits. That's my
[01:08] doing for the last 3 years. But for people who might have a much free time and are looking to generate quick income, suitable. And finally, we have scalping, which is what I'm going to teach you
[01:23] faster method where trades can take from one minute to 30 minutes. trade quickly, so you can know lose. With the strategy I'm going to teach you, you'll be able to have a high
[01:36] success rate and you'll win much more than you lose. But when we talk about trading, remember that you're also going to lose. The goal is to win that concept, since we're going to do forex scalping, we first
[01:49] word forex means foreign exchange in English. It's an abbreviation, and if we translate it into Spanish, it would mean " exchange of currencies." We don't... value. The dollar has no value, nor does the euro. They only
[02:04] have value when compared to each other. If we ask, " How many dollars do I need to get 1?", there's a value, and that value could be 1.10 to get 1, for example. If we want the Japanese peso, we can't
[02:18] a value. It will have a value when we compare it to another currency, and that's what currencies within the market with the goal of projecting their movement, whether they will go up The good thing about investing in forex, unlike many other businesses, is
[02:33] clients. We won't have to talk to anyone, convince anyone, or sell any customer service, we don't have to send anything at all, or deal with anyone. And even unlike other businesses, you won't have to
[02:48] show you that at the end of the video. But there are many advantages to trading teach you how you can apply a scalping strategy. What is short-term forex investing to generate income? The first thing we need to
[03:01] is the platform. You'll be the base platform that will allow you to do the analysis, and I'm going to teach you using for scalping, and first we need to understand
[03:15] apply them. On the left, we're going to see the TradingView tools, and the main one you'll be using is the second option on the left, which is trend lines. This is a small line that you
[03:28] guide you. This line won't do anything on its own, but when it has context behind it, it will help you a lot when executing a good analysis. If you look, TradingView has all these tools, like this
[03:41] ruler that will allow you to measure the amount of movement, like this lot. For example, when I find a good price rejection zone, I place it here or draw something here just to guide me. Because everything
[03:55] in TradingView has tools to guide us, and with these tools we can do A good analysis tool that I use a short positions. If you're expecting the market to go down, you can place a
[04:08] short position. This black area is where you would place your where you would place your
[04:20] this box here, it means your projection is waiting for the market to reach where the white and blue lines meet, and your trade would stop losing where the black and white lines meet. These are basic
[04:32] and simple things about the TR (Trading Trial) method. As we use it, we also see up here in the upper left, which are the timeframes. This is the time it takes for these green and red squares to open and
[04:46] close because these green and red squares are Japanese candlesticks. It's a method of analysis that I'm going to teach you. I analyze with Japanese candlesticks, and to give you an idea of how simple it is, red means
[04:59] the market is going down, and green means the market is going up. Every time you see these green squares, it means the market is rising. The red squares represent the up. The market consists of fluctuations; it doesn't just
[05:12] have one direction, and it doesn't only go down or up. It has to have a direction, and we determine that direction by the trend. If the market here we see is going down, we have a
[05:24] bearish trend. If the market here we see is going up—notice, it's read from left to right—we have a bullish trend. Everything will depend on the direction we are facing within the market. And we
[05:37] determine that by reading these green and red squares that we call Japanese candlesticks. This time here, for example, an H means 1 hour or 2h, which means 2 hours, is the time of each square. If we go to 1h, which would be
[05:52] one hour, it would mean that each of these squares took one hour to open and one hour to close. We have the 11 o'clock square. Notice that when I place the mouse here, in this part down here, it shows me a time; it says
[06:06] 9 a.m., 10 a.m. Of the 11, 12, and 13, but for us to use scalping, I only want you to concentrate on a few tools. Here we're only going to use the 15-minute timeframe
[06:20] the 15-minute timeframe and 10, 5, 3, and 1. Everything below the 15-minute timeframe is the only thing we're going to use. Forget about all these other timeframes here, and if when you go to TradingView they don't all appear,
[06:32] just come here to this little arrow and put a star on these ones I just and put a star on these ones I just mentioned: 15, 10, 5, 3, and 1. Put a that will appear up here. We're also going to be using
[06:46] lines a lot, which would be this trend line. And we're also going to be using Japanese candlesticks a lot, which are these little green and red squares here on the right. You can see where you can add your pairs. Look, I
[06:58] have the Euro/Dollar, and it's not called a currency, it's called a currency pair because there are two. We have the Euro and we have the US Dollar. They are two currencies. Here, for example, we have The dollar and the Canadian dollar are two currencies. Here we have
[07:12] the British pound and the Japanese yen; they are two currencies, always two currencies. Even when we analyze cryptocurrencies, in this case Bitcoin, we have Bitcoin and the dollar because Bitcoin doesn't have a price as such; it only has a value when
[07:26] compared to another currency. If we compare Bitcoin to the euro, it would be a different value; it wouldn't be 64,700 as it is now, for example. Once we understand this platform, which is TradingView, this is where we will
[07:38] be analyzing our first trades. Now we need to know where we are going to invest and where we are going to open those trades. And the next thing we broker is an entity that connects the real market with the client.
[07:52] If you are a client and want to invest $500 in trading, you need to go to a will deposit your money. The broker is responsible for making the decision you the euro/dollar and make a purchase, the broker will make that purchase for you. It is
[08:07] the entity that connects you with the real transaction. And for that, trustworthy broker. At the moment, there isn't one that I recommended it, but you can search for a and see which one is the most trustworthy to deposit your money with. Opening a
[08:22] broker account is simple. You just have to register your email, fill out the information as if it were a bank; they will ask for identification, application details, proof of address, and all that, and that's it. Once you deposit your money, they will give you an
[08:34] account, and that's the account you'll use to invest. Now I'm going to show you how to use the platform that will allow you to send those instructions to the broker so they can execute the buy and sell orders. That
[08:46] MetaTrader tool works as follows: you're going to come here to the right and click on "More." Once you click on "More," you'll click on "MetaQuotes" a broker, you'll look for it here in the list of brokers. If your broker is
[09:01] called 24, you'll search for 24 and enter your account information. Once you enter your account information, it will ask for a login. The email address the broker used to create your account will send you your login credentials. Password and you're all set, you'll be logged in. But if you want to create a
[09:15] to try out all those strategies, come here, click where it says " demo account," enter the balance you want in your account (let's say $1,000, for example), and click "accept and register." Once you accept and register, you'll be in your
[09:30] MetaTrader. MetaTrader has five options. The first option is the list of currency pairs. Notice that at the beginning we have Euro/Euro/USD, which is the comparison between the Euro and the Dollar. Then we have the British pound and the Dollar. And up here on
[09:44] the left, below " quotes," it says "bid" and "ask." "Bit" means the price at which they can place you in the market, and "ask" is the current price. You might want to place an investment at 1.07367, which
[10:00] would be the ask price, where the price is currently. But the broker has commissions and fees that are their profit, and that's where they can place you. So you don't get confused about this, basically, the broker will earn a
[10:13] open a trade for you. And this isn't something that will... It affects a lot, but since it's a every time you open a trade, and they usually earn a few cents. Then we have this option below, which is "Charts," where you can analyze
[10:27] your small chart. I don't recommend it; I recommend analyzing in TradingView because here it's very complicated, it's very small, you don't have enough space to trade. That's why I recommend TradingView more. You'll
[10:39] have the "Trade" option, which is where you'll open trades. To open a trade, you just have to go up to the "More" section and enter the lot size. The lot size is the unit you're willing to risk. One lot is equal to
[10:53] one pip for each pip the market moves. So, if you have a stop loss of 10 pips, you can enter one lot here. You would put the stop loss value, which you find. Let's say if the price reaches 1.07467, you want
[11:08] the trade to close at that value, and that's why you put it here in MetaTrader. And if the price reaches, let's say, 1.07700, you... You want the price to close at that point, and what you're going to do is come here and click "Buy" to
[11:21] place a purchase. Then you'll see that the trade opens. if you click on it, and you'll notice that it's losing one point for every point it moves in the market. Now it's losing $, for example, because that's the point it
[11:36] moved. It has only moved two points, but now it has moved five or six. And as it moves, it's on the positive side because we said the trade was going to go up. If it goes up, then we make money, and if it goes down, then we lose
[11:48] you're projecting that the price will go up. Then, if we want to close the trade, we press and hold it and click "Close position." Then we click here in the yellow part at the bottom that says "Close," and here where it says "
[12:02] of what we have in our account and the profits or losses we you can organize by date to see how much you earned this week, next week, and everything. And finally, we have the settings section, where you'll
[12:17] change your account information. You can change the app's color; there are several configurations to make the app more personalized. This app is very simple, and the only part that might seem a little
[12:29] complicated, but is also very easy, is connecting it to your broker. or account creation email from the broker, they give you the username so you can register it on the platform, which is MetaTrader 5. So, once you
[12:42] the platforms, we can go directly to the strategy you'll market. How will you analyze whether the price will rise or fall? And what do you have to do specifically, and at what specific time, to take these
[12:56] short-term or scalping trades? This strategy I'm going to teach you is simple, and for this, we'll only use a one-minute timeframe. The important thing about this strategy is that you have a specific time frame for your
[13:09] analysis. This time will consist of an interval of approximately 4 to 5 hours where you have the... Opportunity to open a trade. Look at this shadow on my chart, it's a gray shadow. You can
[13:21] indicators section. Just search for " Time Zone" and choose the first one. Once you add that indicator, it will appear here in the upper left. Modify it and set it to 7 AM to 12 PM. This is all
[13:37] New York time, so you'll need to go to the lower right of your chart in TradingView and select New York time. When I say New York. If you're in
[13:50] country that isn't New York, just select New York here. If you're not in the United States, but you're part of the United States but specifically in New remember that the main investment institutions are in
[14:05] New York. That's why we primarily base our strategy on this time. Now, how will this strategy work? It's very simple. You just have to look for matching points at the top or bottom, then look for retracements, and
[14:19] then take entries. And these entries will always, always, always... Risking one to find one will mean one-at-a-time entries because the goal of this strategy is for you to win more than you lose, and for this strategy
[14:32] win more than you lose. What's the first thing you're going to do? You're going to enter the chart at that specific time to study the strategy, and when you find points like this—notice that when I draw a line here, these are
[14:45] points where we see the price reach, hit, hit, hit, and then move back— we need a minimum of three touches, in this case, one touch, two touches, and then a third touch. What we're going to do is, on the third touch,
[15:00] literally on the third touch, without waiting for anything else, we're going to place a buy order in the direction of the touches. If the touches are at the top, we're going to place a
[15:14] buy order precisely on the third touch at the top. Our stop loss will have a fixed value of 7 pips, and our take profit will also have a fixed value of 7 pips. This strategy is based more on statistics; we're simply
[15:28] looking for confirmation at a specific time, on a specific timeframe. Specifically, and statistically speaking, we'll see that each time this happens, we have a higher probability of finding that 7-pip move. How does it work? Step
[15:42] one: we'll find a point where it has touched at least three times. Step two: on the third touch, when it's about to make the third touch, we'll place our trade. If the point is touching from above, it would be a
[15:56] buy trade, and if it's touching from below, it would be a sell trade. And at this point, around 9:00 AM, because that's another important detail, we can only do it between 7:00 AM and 12:00 PM. At
[16:10] this point, once we find several touches, in this case, on the upper side, we would take our buy entry on the third touch, setting a stop loss of 7 pips and a take profit of 7 pips; that is,
[16:23] risking the same amount we're looking to gain. And so you can see how it would work, look, here's another example. On the same day, for example, we'll find several touches. We can see one here, one here, and another here. Here we have
[16:39] touch one, touch two, and touch three. On the third touch, what we're going to do in this case, since it touched by... At the top, we're going to place a buy order. We're going to set a stop loss of 7 pips and a
[16:51] take profit of 7 pips. Notice that it's the first, second, and third touches of the same specific point. It might have been slightly negative, but then we see that it went positive, accumulating those 7 pips. And here we can see that on the same day we had
[17:06] those two trades. If we had risked 1% on each of those trades, we would have had a 2% return for that day. We can see this in scenarios like this. Notice that sometimes the following will happen: we'll have touches
[17:19] above, and sometimes we'll have touches below as well. So when we find touches from both sides, we're not going to make any decision. What we're going to do is... We'll wait because we only want touches on one
[17:32] of the two sides. On days like this, when we have several touches up, up, up, up, and we have touches down, down, down, then we're not going to do anything. These are accumulation days, and the strategy doesn't work well when there are
[17:46] accumulations on both sides. Let's look at previous days, or even review these same entries, so you do n't get confused and see how simple it is. It strategy is validated by statistics, and you'll see that a higher percentage
[18:02] of profit will obviously guarantee a higher percentage of return because the strategy is one-on-one scalping. I'm even sure that if algorithmic trading, they could put this in a bot without any problem. Look at this:
[18:17] bot without any problem. Look at this: touch one, touch two, and on the third touch, other confirmation. The only confirmation is the third touch, that it's within the timeframe, and that we have a stop of 5 pips and a take profit of 7 pips. We see
[18:32] here: touch one, touch two, touch three. Confirmation would be the third touch, a stop of 7 pips, and a take profit of 7 pips. Let's look at previous days to see how it works. We're on the timeframe. For example, let's look at this one-minute example. Today we're going to
[18:48] look for three touches. Remember, there have to be three touches. The touches could even be diagonal sometimes. For example, look here. Here diagonal sometimes. For example, look here. Here we have touch one. It seems there aren't
[19:02] several touches at the same point. Well, here it could be, for example, look here. Well, here it could be, for example, look here. Here we have touch one, touch two, and on the third touch, literally once it touches the third point, it would be a
[19:15] resistance point. You would place a stop loss of approximately 7 pips and a take profit of approximately 7 pips and a take profit of approximately 7 pips. That would be the perfect part. Notice that even though it lasted several minutes, a little
[19:30] longer than desired, this trade lasted approximately 2 hours. It was the trade that lasted the longest. Yes, but it had too many touches. I would have closed it on the attempt, but the strategy works without any problem.
[19:44] the strategy works without any problem. Let's see if we can find another example. place the line, but now diagonally, we can see that we have touch diagonally, we can see that we have touch one, touch two, and a third touch. What do we do?
[19:57] On the third touch, you would place our sell trade, which would be here. We would put our stop loss of 7 pips and our take profit of... 7 pips would also be around here, look, this was a
[20:13] losing trade within the one we're studying, losing trade, winning trade. Although it took a long time, we could find another trade around here, closing the session, closing the trading day, look. Right at the close,
[20:26] we have touch one, touch two, touch three. We could place our buy entry around here on the third touch, which was right at 12 o'clock, a stop loss of 7 pips and a take profit of 7 pips around here, which would be fulfilled a little while
[20:43] later, at 2 pm. Sometimes the trades will be like this. The important thing is to have the rule of the stop loss of 7 pips and the rule of the take profit of 7 pips, the same here, 7 pips, 7 pips, the same here, 7 pips.
[20:57] Some days we're going to have two losing trades and some days we're going to have two losing trades and four winning trades, but when we do regarding all the trades we took during that week and that month,
[21:11] we're going to see that the success rate would be a positive percentage. We can continue evaluating. Let's see what we find with multiple touches. For example, let's see, this day was a little interesting. For example, here we have touch one,
[21:27] touch two, touch TR, and TR. We can place a long trade here at touch number TR, setting a stop loss of 7 pips and a profit of 7 pips. In this case, that would have been a losing trade. Here we see a stop loss of at least 1%. If
[21:43] we had risked 1%, we would have taken it without any problem. Let's see, here for example, we have touch one, touch two, and touch three. We can take a sell trade here at touch TR with a stop loss of 7 pips. And here we see that
[21:59] although we were a little negative in this trade, we ended up going towards the take profit. Many trades will look like this, getting a little close to the take profit because, remember, it 's 7 pips. 7 pips is a small amount; it's not
[22:13] much space for the trade to breathe. So tight, but then we'll see that it will go to the take profit. Other days we'll see them like this. Notice that we have very close touches. We have
[22:28] one touch, two touches, three touches. They are very close touches, and at the top, you can see that although they are not touches at the same level, they are still present. And these days, which are a little confusing in trades like these, we simply don't
[22:43] make any decisions, literally nothing. On other days, we'll see if it falls outside the trading hours, but if the trade comes in while the hours are active, no problem. The take, for example, notice that the day before this one,
[22:56] we had taken one right at 12 o'clock. So, what's 5 minutes after 12 would be fine; I wouldn't take it. Here we have touch one, touch two, touch three. We would put a stop of approximately 7 pips and a
[23:11] approximately 7 pips and a take profit here of 7 pips, which would be around take profit here of 7 pips, which would be around here. Notice that the price takes a long time, even to reach the take profit, around... well, not that long, it's about 2
[23:25] hours. It's not too much. And on days like this, for example, we can have one losing trade, two winning trades, and we'll see that it's a 1% day. The objective of all this is to accumulate and see the result we're going to have, day
[23:38] after day, day after day. And from then on... From that result, we can calculate a probability that the trade or the day will be a positive day, but some days will be negative. The important thing is to add up the entire week
[23:53] because you'll have one negative day, maybe, then three positive ones, and then another negative one. When you add it all up, "Oh wow, I have a 4% positive percentage on my account." And that's how this strategy works. Rule one: we have several touches. Rule two: sell or
[24:07] buy on the third touch. Rule three: stop loss and take profit of 7 pips. And rule four: it has to be at the specific time we're looking at. This whole this strategy works, I'm going to show you a trade I took literally
[24:21] live market. Because now we've seen the study so you can learn the strategy and how I can implement it. Wait for it to happen and do everything step by step towards the point of managing the trade and closing in profit.
[24:34] And here we can see a clear example of what I've been explaining. We have one touch, we have two touches, and we're going to wait for the third touch. Immediately upon the third touch, here I have my stop loss of 7 pips and my take profit of 7.
[24:47] The important thing here is the time of day we're at. The key would be the third confirmation, the third touch, and as soon as it arrives, I'll literally be opening my entry trade. I'm going to show you in my MetTrader how I
[25:00] take the entry once it arrives, how I place the Stop. Notice that the Stop will place the Stop. Notice that the Stop will be at 1.07 245 and the Take Profit will be at 1.07 385. We can even place a Buy Stop order
[25:13] right at that point so that it opens automatically as soon as it arrives, and we don't have to keep worrying about watching the chart all this time. We're going to wait for it to arrive, place a Buy Stop, and buy only up to this point
[25:25] to gain those 7 pips from the strategy. Let's see, look here, friends, it has literally just arrived at the point, but it seems to have dropped very quickly. I'm still going to place my trade, which would be right at this point: 15 lots. Here's
[25:39] the Stop Loss, here's the Take Profit, and I'm going to place a buy order. This is a demo account; I only opened it to test this entry and so that you can live market. And how to apply it? Look at my demo account; we're right at the
[25:53] point. Maybe a little lower because it touched and quickly moved back, but I've already taken the entry. If you look at it here in TradingView (I'm viewing it from my phone), you'll see we have three touches, and on the third touch,
[26:06] I buy with a 7-pip take profit and a 7-pip stop loss. That's literally all I need to finalize the strategy. Now I'm going to wait for it to reach the 7-pip take profit or the 7-pip stop loss;
[26:20] friends, how the strategy is developing. We ideal take profit. But notice, the entry point was 1.07295, and we would be
[26:33] earning approximately 915. We're risking 1000, which would be 1% of this $1000 demo account, and we're waiting for it to reach the take profit. Remember, it would close automatically at 1.07385, which would be the point. The ideal take
[26:48] profit sometimes takes 10 to 20 minutes to arrive. But Here we can see, friends, that the trade has already closed. We see that it reached the take
[27:00] profit. We waited a little while, and if we look at the chart, it was slightly negative. If we extend this to here, notice that it was slightly negative, and the only thing we needed for this trade was to be patient. These types of
[27:13] notice that with this scalping strategy, the price will often fluctuate; it will go negative, it will go positive. But in the end, what we're looking for profit or the stop loss. In this trade, we had a profit of
[27:28] trade, we had a profit of $25, a little over 1%, since we entered on the retracement of the one- minute candle. But everything went perfectly. We waited a little while, we were patient, we stayed within
[27:40] New York trading hours, and we can see on the blue arrow where the trade was taken and on the red arrow where it was exited. It was a successful $425 trade for this account, where we took this
[27:52] test trade. So you can see that the strategy works, now we look at the chart and everything happened exactly as planned. Okay friends, here we can see the trade I was mentioning after I got home a little while later. I'm
[28:04] see it better, and notice that it was a little negative. Then we went straight to positive: 7 pip stop, 7 pip take profit, a one-to-one trade, and you can consistently find several entries in the same way.
[28:18] Look, here was the entry point we 're looking for: touch one, touch two, touch three, entry, fluctuation a little negative and then positive. The number of trades you have, the number of winners and
[28:32] always positive because, since it's a one-to-one strategy, the goal is to an example of how it works; start practicing it. And as I told you, at the end of the video I'm going to show you how you can do this kind of thing without
[28:47] investing your own money. That's what funding companies are for. These are exam, and if you manage to pass it... The exam gives you capital that you can passing the exam, you can keep 85% of the profits. If you ask me
[29:02] 21, where I work. It's a company where you can take the Latin American country without any problem, and once you pass, they can provide you with capital between $5,000 and $600,000. That way, you can invest, scalp, use
[29:17] this strategy, and never risk your own capital. It used to be thought that it took a very long time to make money trading, but every day it's easier. Use strategies and these
[29:29] little you can grow your trading account and even invest capital. And if you want to see how other using the strategies they learned on this channel, I invite you to
[29:42] watch our other channel, "Students of the Sensei." It's a compilation of hundreds of knowledge they've learned, have been able to withdraw money, and some trading. I invite you to the other one. channel and
[29:55] see you in the next video bye bye and kisses m
⚡ Saved you 0h 29m reading this? Transcribe any YouTube video for free — no signup needed.