
Stop Being Scammed by Manipulative Brokers
54sAddresses a common fear and pain point in the trading community, promising a solution and building trust.
▶ Play Clip"The title promises a great strategy, but the content is mostly a broker promotion with a simple pivot technique, padded with live trading fluff."
This video presents a strategy for trading candlestick patterns in binary options, focusing on 'order flow' and leveraging winning streaks. The presenter, with over 10 years of experience, explains how to identify pivots and trade in the direction of the flow, using the Ibnex brokerage platform as a recommendation.
The presenter introduces the topic of profiting from candlestick patterns in binary options and warns against brokers that manipulate charts. He recommends Ibnex, claiming it doesn't profit from user losses and offers high payouts.
The strategy is described as simple yet efficient for trading order flow, allowing for multiple consecutive profitable trades, especially with high-payout brokers.
Two main entry types are explained: pullback (price retraces from a region) and breakout (price breaks through a region). The flow refers to the continuation of movement after a breakout.
A pivot is defined as a high followed by a low, then a higher high (bullish pivot) or a low followed by a high, then a lower low (bearish pivot). Pivots indicate trend continuation or reversal.
The presenter shows an uptrend on IDX, explaining that without a pivot, there's no clear trade setup, but one can trade on continuity after a breakout of a previous high.
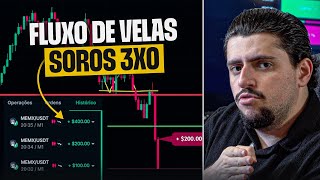
The presenter identifies a bearish pivot on MMX and takes a sell trade on a pullback, expecting the price to continue falling. He uses compound interest with a 100% payout, turning $100 into $200, then risking $200 to make $400.
The presenter wins three consecutive trades, demonstrating the effectiveness of the strategy. He encourages viewers to join his Telegram group and free course for further learning.
The video demonstrates a practical approach to trading binary options using order flow and pivot points, with a focus on leveraging winning streaks. The presenter emphasizes the importance of learning to trade independently rather than relying on signals.
What are the two main types of entry in candlestick flow trading?
Pullback (price retraces from a region) and breakout (price breaks through a region).
02:06
Define a bullish pivot.
A high followed by a low, then a higher high.
04:56
What is the target of a pivot movement?
The propulsion of the front leg kick, meaning the price should move to the previous leg's target.
06:22
Two Entry Types
Clearly distinguishes between pullback and breakout entries, foundational for the strategy.
02:06Pivot Definition
Provides a precise definition of a pivot, essential for identifying trade setups.
04:56Pivot Target
Explains how to project the target of a pivot move, adding practical value.
06:22[00:02] the best pattern is for you to use to profit from candlestick patterns in the options market when day trading. I've been in this market for over 10 years, and you can be sure I can help you stop
[00:16] losing money by making mistakes and stop being scammed. Wait, what do you mean by "stop being fooled"? If you trade with a broker that manipulates charts, that broker will ultimately cause you to always lose
[00:28] . So you should trade with a good brokerage firm. The brokerage I use is one for people who want to make a living from trading, and that's Ibnex. The link is below. The brokerage firm doesn't make money from your loss, and neither
[00:40] will I profit from your loss. Create your account, try it out on the demo, then tell me what you think. I use it and recommend it. I'm here at the BNEX brokerage, which, by the way, is quite unusual, okay ? To be perfectly clear, the payout at this
[00:55] moment is at 100%. This is something out of the ordinary. Let me put here a little setup that I'm going to configure on the chart for myself. I'll adjust the values of my transactions here in a moment. And today, in today's lesson, I'm going to
[01:09] show you a strategy that is very simple, yet efficient for trading order flow. And best of all, you can use it for leverage. It's not always possible, but if you're in a
[01:22] good moment, in a good market cycle, you can look for two, maybe even three profitable trades in a row, putting a lot of money in your pocket, especially if you're with a brokerage that has a high payout, right?
[01:37] Ibnex's payout varies from 90% to 96%, but today the payout on some assets is at 100%, and that's fantastic. And I decided to take advantage of this and okay? Remember, if you want to learn from me, trade live
[01:52] with me, and learn in practice , just join the group linked below in the description, the Telegram group, and also my free course called Binary Class. Let's go then. Well, the first thing you need to understand
[02:06] is what candlestick flow actually is. In the market, we have two main types of look for a transaction. Either we look for a movement, a
[02:19] pullback entry, which is when the price reaches a certain region and then returns. So, for example, here we had a pullback, or you could also call it a reversal, starting from this movement. Think of the price, I'm drawing it here in yellow,
[02:34] okay? Then the price came, touched up there, and then fell. It retraced from that price, from that point, right? But what else is there? There is also the rupture. The rupture would happen if this happened, look. The price came and went beyond
[02:47] the region. So, obviously, we're going to do an analysis to identify where the price tends to retrace and where it will have difficulty breaking through. And if he breaks up with her, what will he probably do next ? The flow of candles. However, the flow does
[03:02] n't only occur after a rupture. There are some strategies, some methodologies that you can use to operate the flow within a movement that is already quite stretched upwards, and you can continue entering long positions, or in a
[03:16] very sharp drop, you can continue entering with short positions and you can indeed get two or three profitable trades in a row, as Oh, it's already gone up a lot, it won't go up any further ." Many times it does continue to
[03:28] rise, okay? So I'm going to show you here on the chart directly, and on top of that, I'm going to trade here so you can see how I'll be doing it, and then whether it's a win or a loss, you'll see it in practice,
[03:42] okay? So look, here we have this movement that's happening now in the MMX asset. And then we were in an upward trend movement. The market made a double top. Then a repetition of red candles here, a
[03:57] repetition of red candles here. But there's a specific pattern you should look for when searching for operations in the flow. What is this? What pattern does this pivot represent? Both high and low. It's very simple. What
[04:13] is a pivot? In order for me to explain what a pivot is, you need to understand what determines a trend. A trend is defined by a peak trend is defined by a peak followed by a trough, which is a correction. And
[04:26] followed by a trough, which is a correction. And then we have a new peak higher than the previous peak, that is, ascending peaks and troughs, one higher than the other. And this indicates an upward trend, at least in the short term, okay? The
[04:40] same thing would happen in a downtrend: bottom, top, bottom lower than the previous bottom, and top here lower than the previous tops, right? And so we have a downward trend, okay? And what is this pivot? When we talk about a
[04:56] pivot, it's when we have a movement from a high to a low, followed by a high that surpasses that previous high, okay? I believe a small low-end pivot just happened here on MMX . Look, the market came, fell,
[05:11] rose, and broke through this region, it went beyond it. So here we will probably see a continuation of the downward trend. Here we could already start looking into some sales operations. Beauty? But first, let's take a
[05:26] look at another asset that also has a good payout, which is IDX. Look , the IDX was in an upward trend. Why? Bottom, top, bottom, top, bottom, top, bottom, top and bottom. It is still within an
[05:42] upward trend movement. So, at this moment, we don't have a pivot reversing this situation, nor even continuing it, because you can also operate on continuity. It doesn't have to be a small upward movement here
[05:55] followed by a downward breakout and reversal. What can you do? You can trade after the breakout of that previous high, which then becomes a bullish pivot within an uptrend, right? You can operate in both ways,
[06:07] okay? However, in this case there is nothing to be done. Let's go back to MMX. In my opinion, the MX still tends to fall precisely because of this important detail is that when we have a pivot, the target of this movement
[06:22] will generally be the propulsion of the front leg kick. So, on the previous leg, the fall was probably the target, meaning it should fall all the way down here, right? And now, look how interesting, the market is coming back. In this case, he's even creating
[06:37] a pullback opportunity, which isn't an entry in favor of the flow, literally not in favor of the very short-term flow, but it's an operation that could be interesting. I'm going to take this trade here, enter with $
[06:51] sold, okay? Because it's a great region for us to make this sale, because it's a pullback, and although it's not a flow operation exactly following the movement of the previous candle, the overall flow of this movement is a
[07:05] downward flow, right? So let's see what the outcome of this trade will be. 7 6 5 the outcome of this trade will be. 7 6 5 4 3 2 Oops! One second. Wow, at the last
[07:17] second he was giving a loss, then he lowered the odds to give a win, then he raised them again and gave a win in the last millisecond . And now we can make another trade precisely in favor of the flow after this correction in the pullback.
[07:32] What am I going to do now? The serums. I invested $, earned my 100, it turned into 200, and now I'm going to invest another 200. So I'm making compound interest, taking advantage of that 100% payout. So, I invested $100, it became $200, and
[07:47] now I'm risking the $200, and if I make a profit, it will become $400. And we're talking about two operations in sequence. Look how the market is following a sharp decline, and if it breaks through this previous support region, it
[08:00] will probably continue to fall. Let's take a look here. Oh, the area just broke through, it's very likely going to continue falling, okay? And perhaps even forcefully, because we had a movement here that looks quite similar to shoulder, head, and
[08:12] shoulder. Actually, it doesn't look quite right, it's kind of ugly, isn't it? But it's a figure that indicates a reversal, okay? So, if I see that it's going to be a win, I'm going to favor of this flow, because we're in a very strong downward movement,
[08:28] we had a reversal pattern, a bearish pivot, a breakout of the support region. Victory is coming here. This is going to be a victory, most likely, right? It has already plummeted. So I'll go ahead and collect the $400 down payment here. Beauty? And now let's
[08:42] see what the result will be, because look, the operation of ' o' is already going to result in a victory, right? There are 10 seconds left, it's practically impossible, who knows, right? The sail will return and bring me defeat. So the first operation was
[08:55] a real struggle, but this one went pretty smoothly, right? There you go, profit in my pocket, 2-0 trading with order flow. And now we await the results of the third operation. 5 4 3 2
[09:08] Stay there, old lady. Stay there. Let's go. Come on, guys, profit in your pocket. Look how beautiful. guys, profit in your pocket. Look how beautiful. Three operations in sequence. Just look. Look here, everyone. 100, 200, and 400. And on top of that, showing you here
[09:24] in practice, practically live, how to trade candlestick patterns in you enjoyed this video. Don't forget to leave a like, comment with any questions you may have and I'll help you, and
[09:38] also follow me on Instagram and join the Telegram group for live trading sessions, where I teach. The intention isn't to give you a little signal; the intention is to teach you so that you don't depend on other people telling you where you
[09:50] should buy or where you should sell, because those who learn don't depend on others. We're in this together, and this is just the beginning. And remember, focus on the process.


⚡ Saved you 0h 10m reading this? Transcribe any YouTube video for free — no signup needed.