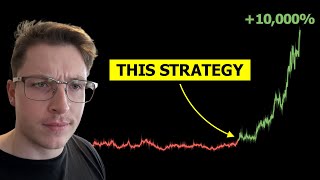

Turn $10K into $1M in 1 Year?
45sThe extreme return claim and personal success story hook viewers with curiosity and promise of wealth.
▶ Play Clip"Title accurately reflects the strategy's potential, but the $1M result is an outlier from aggressive sizing."
This video reveals a strategy that turned $10,000 into $1 million in one year by selling earnings volatility. The creator explains the concept of edge, why selling options before earnings works, and backs it with data from 72,500 earnings events. Key strategies include the short straddle and long calendar spread, with the latter preferred for better risk-reward. The video also covers position sizing using Kelly Criterion and Monte Carlo simulations, and provides a Python script to scan for trades.
An option strategy turned $10,000 into $1 million in one year. The creator has traded it for 9 years, making over $6 million.
Edge is a repeatable statistical advantage with positive expectancy over time. A valid logical reason for the edge is necessary to avoid data mining.
Large institutions hedge uncertainty around earnings, creating price-insensitive demand for options. Speculators further inflate implied volatility, leading to overpriced options.
Selling options ahead of earnings profits from the drop in implied volatility post-earnings and stocks moving less than expected.
Short straddle has high gamma risk. Long calendar spread involves selling a front-month option and buying a back-month option, reducing gamma risk and benefiting from IV crush in the front month.
Data set includes 4,500 stocks from 2007 to today, covering 72,500 earnings events. Predictor variables: term structure slope, 30-day average volume, and IV/RV ratio.
Using filters (term structure slope, volume, IV/RV ratio), the straddle mean return became +9% and calendar +7.3%. Calendar had lower variance and max loss.
Kelly fraction for straddle: 6.5%; for calendar: 60%. Monte Carlo simulation shows full Kelly leads to high drawdowns and bankruptcy risk. Reduced Kelly (10% for calendar) yields sustainable results.
Over 10 years with $10,000 and 10% Kelly, mean ending portfolio is $6 million, CAGR ~90%, max drawdown ~20%, win rate 66%.
A Python script scans earnings events. Example: Amazon trade yielded $9,300 profit on a calendar spread.
Selling earnings volatility is a viable strategy with a strong edge, but position sizing is critical. The long calendar spread offers a better risk-reward balance than the short straddle. Using data-driven filters and conservative Kelly sizing can lead to consistent long-term growth.
What is the core strategy described in the video?
Selling earnings volatility by selling options ahead of earnings to profit from IV crush and stocks moving less than expected.
02:24
What is 'edge' in trading?
A repeatable statistical advantage that gives positive expectancy over time.
00:30
Why does the edge exist for selling earnings volatility?
Institutions hedge uncertainty around earnings, creating price-insensitive demand for options, and speculators further inflate implied volatility, leading to overpriced options.
01:38
What is the difference between a short straddle and a long calendar spread?
A short straddle sells a call and put at the same strike, high gamma risk. A long calendar spread sells a front-month option and buys a back-month option, reducing gamma risk and benefiting from IV crush in the front month.
04:09
What are the three predictor variables used to filter trades?
Term structure slope, 30-day average volume, and IV/RV ratio.
06:38
What is the Kelly fraction for the straddle strategy?
6.5% per trade.
12:14
What is the Kelly fraction for the calendar strategy?
60% per trade (full Kelly).
12:30
What was the mean ending portfolio value after 10 years with $10,000 and 10% Kelly on the calendar strategy?
Around $6 million.
17:02
What is the post-earnings announcement drift effect?
The tendency for stocks to continue moving in the direction of the earnings surprise over time.
09:24
What does a negative term structure slope indicate?
Near-term options are more overpriced than later-term ones; the market expects volatility to drop after earnings.
10:09
Strategy Potential
Claims a strategy turned $10,000 into $1 million in one year, setting up the video's hook.
Definition of Edge
Provides a clear, actionable definition of edge crucial for trading success.
00:30Why Edge Exists
Explains the market inefficiency created by institutional hedging and speculation.
01:38Large Data Set
Analysis based on 72,500 earnings events adds credibility.
06:10Kelly Criterion Application
Demonstrates practical use of Kelly for position sizing, a key risk management tool.
11:59[00:00] what if I told you this option strategy turned $10,000 into $1 million in just 1 year sounds insane right but I've personally traded this strategy for over 9 years and in that time I've made over 6 million across my portfolio with this
[00:12] the data back tests and research behind it showing you exactly why it works and if you stick around until the end I'll even give you the actual code calculator end of this video you'll not only understand this strategy but you'll also
[00:30] strategy itself let's talk about something far more important understanding Edge because without Edge no strategy no matter how well simple terms it's a repeatable statistical advantage that gives you a
[00:47] positive expectancy over time it's not about winning every trade it's about profitability over a large number of Trades but here's where most Traders go something worked a few times in back tests does not mean it's an edge you
[01:05] need a valid logical reason for why the edge exists otherwise you're just Data Mining and eventually the market will correct itself leaving you with nothing arbitraged away by larger players after all institutions have billions of
[01:20] I as an individual Trader still monetize it the answer lies in understanding where large players don't want to take risks the best trade ideas come from not trying to optimize for maximum returns they're simply looking for
[01:38] protection creating inefficiencies we can exploit but here's the key every gambling too many Traders operate on gut feeling or intuition but if you don't
[01:52] have a way to falsify bad ideas then all you're doing is trading on Hope and hope noisy they don't work every time and results can vary in the short term this is where most Traders fail they abandon a good system during a draw down because
[02:07] why research is so important if you don't have the data to support your you're EDG just disappeared later in this video I'll show you the data that answers this exact question so what's the strategy selling earnings volatility
[02:24] that's it that's the strategy it sounds simple but there's a lot of nuance we earnings events which happen four times a year per stock often account for the majority of the volatility of stock will experience in the entire year by selling
[02:39] options ahead of earnings we aim to profit from two key factors first is the rapid drop in implied volatility after earnings are announced the second is stocks moving less than expected our hope is that options tend to overprice
[02:54] profit from the discrepancy now why does this Edge exist exist because people hate uncertainty especially big institutions and funds with tight risk controls and uncertainty in a stock is directly reflected in implied volatility
[03:09] around earnings implied volatility spikes because Traders funds and Retail whether implied volatility is over or underpriced they just want to hedge their positions we call them price insensitive Traders and they create an
[03:24] opportunity for us Beyond hedgers we also have speculators Traders looking to increased demand pushes options prices and implied volatility even higher protection speculators driving up demand for options and the general uncertainty
[03:42] leading to higher implied volatility you get a market imbalance where options are of that trade now obviously this isn't just Theory I'm going to back this up with real data in the next section but first let's talk about the best ways to
[03:56] ways to structure short volatility trades around earnings but I focus on the short straddle is the most common short volatility strategy it involves
[04:09] selling one call and one put of the same strike and same expiration generally moves less than the expected earnings move and when implied volatility collapses post earnings however because we are selling short-term options gamma
[04:23] risk is very high gamma measures how fast Delta changes and near earnings with inflated implied volatility and short time to expiration gamma is IV Crush won't be enough to offset the loss from gamma and we can take a big
[04:38] hit the long calendar spread involves selling a near-term also known as front month option and buying a longer term also known as back month option at the same strike it is usually executed with the shared strike being the at the money
[04:50] will be more expensive in dollar terms than the one in the front typically I volatility while keeping the structure stable now here's where people get
[05:03] confused a calendar is technically long Vega but this is misleading the backmon option has more Vega than the front month making it seem like we want IV to rise but in reality what we want is IV to drop in the front month more than it
[05:15] does in the back month essentially we want our Vega gains in the front contract to offset our Vega loss in the back we are also short gamma because the of the option we bought in the back this means we want the stock to move as
[05:29] as possible since the back month positive gamma will not be able to compensate lowering front month implied volatility raises our profitability but if backmon implied volatility also drops significantly our structure collapses in
[05:44] limiting profits through testing I found that a 30-day difference minimizes this and lower commissions but also has higher tail risk meaning when things go
[05:56] smoother Equity curve but it generally has lower returns that's why in the data time based on thousands of historical earnings events now let's dive into the
[06:10] no cherry picking just raw numbers and Analysis we're working with a data set of 4500 unique stocks spanning from 2007 to today covering a total of
[06:23] 72,500 earnings events now within the data set we track several key metrics Target variables which measure the success of each strategy the key predictor variables are the term structure slopes this measures the
[06:38] difference in implied volatilities between the front month or near-term expirations and further out expirations of 45 days or higher a steeper structure will show that near-term options expect large moves but they expect volatility
[06:53] to fall back to normal levels over time there's also the term structure ratios there's also a 30-day average volume which is our liquidity measure this will finally there is IV RV ratios so comparing implied volatility to realized
[07:11] volatility over the period prior to earnings this is used to see if there's any predictability coming from implied volatility being overpriced in the time strategy performed we analyzed three primary Return base metrics note that
[07:26] all of these positions were open 15 minutes before the close of the trading return jump it is the return of the trade closed 15 minutes into the trading session after earnings we also have straddle return move which is the return
[07:41] if we close the position with 15 minutes before Market close on the day after spread close 15 minutes into the training session after earnings all of commissions and slippage estimates based on bid ass spreads and volume this
[07:58] not just theoretical models let's look at the distribution of returns for the straddle jump strategy when we plot the historical returns for the straddle jump profits but there's a long dangerous left tail where rare but massive losses
[08:15] occur in fact 1% of the time this strategy lost 130% or more and. 1% of the time it lost over 41% there's even one extreme outlier where the straddle lost over 9200 on a single trade we can also notice the near
[08:30] 0% mean return indicating that trading all events blindly will just break even over time this is generally expected and shows that on average the market prices strategy the Calendar's distribution looks far more stable lots of small
[08:44] consistent winners and fewer extreme losses the worst case scenario for the calendar is losing the entire debit paid we also noticed the near 0% mean return here showing me break even if we just blindly traded all events now how did
[08:56] traded wildly around the zero line showing no consistent long-term Edge when traded blindly the calendar spread also showed random fluctuations around Edge there this is why we have predictor variables to see if we can improve this
[09:12] Fact one interesting observation is the move straddle held until near close the next day was a consistent loser confirming the well-documented post earnings announcement drift effect post earnings announcement drift is a
[09:24] announcements slowly over time this means that for example if a stock jumped 5% in the morning after earnings it is more likely to continue to rise the jump and take the opposite position or use shares to ride the predictable
[09:42] trade it let me know in the comments because the jump shows more promise here the post earnings announcement drift effect that happens with earnings so do
[09:55] into desiles which is 10 equal groups based on each predictor variable we slope specifically the nearest expiration to the 45-day expiration the
[10:09] more negative the slope the higher the returns for both the straddle and the overpriced short-term options tend to be this shape of the slope is often referred to as backwardation this means the near-term options are more
[10:23] overpriced in IV terms than later term ones the market expects volatility to drop back to normal levels after the event the 30-day average volume higher the calendar this suggests that more volume or more participants will lead to
[10:38] a higher level of price insensitivity where demand is more likely to outpace supply and finally the iv30 rv30 ratio the higher this ratio the better the normal conditions it was even more likely to be overpriced for earnings
[10:53] with all this analysis we built a simple rule-based model that only trades when above a key threshold and the iv30 rv30 is high enough to indicate implied Vol
[11:05] overpricing this filtered out 88% of events for the straddle and 90% of final results of the model is that the straddle mean return became + 9% up from
[11:17] zero but with a high variance 48% stering deviation and the calendar mean return got up to 7.3% up from zero with a lower variance of a 28% standard deviation the straddle had a Max loss of 8 130% where the calendar had a Max loss
[11:32] of 105% with the extra 5% being due to commissions both strategies were consistently so after analyzing over 72,500 earnings events we now have a
[11:44] enough we still need to test how this strategy would perform in several through a Monte Carlo simulation to show the potential growth draw down win rates
[11:59] into the results of both these models first we'll analyze the Kelly Criterion which determines the optimal fraction of your portfolio to allocate to each trade theoretically Kelly sizing maximizes long-term growth but in practice full
[12:14] uncomfortably high risk of bankruptcy for the straddle the suggested Kelly fraction is 6.5% meaning if you had a $10,000 account it recommends selling a straddle with a maximum of $650 in collected premium for the calendar the
[12:30] $6,000 debit right away using the Kelly fraction as a proxy for the better strategy this suggests that the calendar structure is likely superior but here's 60% is far too high I'll show exactly why this is in a moment but just looking
[12:48] at these numbers the calendar appears to be the safer bet as it recommends a much analyze this further now I don't just rely on back tests I run Monte Carlo
[13:00] simulations to get a better picture of real world variants why because back tests only show one historical path while Monte Carlo runs thousands of a far better idea of what could happen in the future and whether our strategy
[13:15] great way to validate whether our live trading results are within the expected range now let's break down the actual mon Carlo results before we get started you'll find a PDF containing all the key data and figures I'll be discussing that
[13:31] way you can follow along and reference it later as you analyze the strategy for yourself for this study I ran 10,000 simulated p&l paths over a span of 1,000 trading days which is about 4 years and another batch over 252 trading days
[13:44] us a much broader picture of potential outcomes than a single back test ever came out to 6.5% per trade from the simulation we see no bankruptcies and
[13:58] sounds great right not so fast when we examine the draw down histogram we can see a big problem about 35% of all paths experience a Max draw down of over 45%
[14:11] these four years more than a third of Traders would have seen nearly half duration most of them lasted between 200 trading days which means that if you hit
[14:25] a rough patch you could be seen in the red for months before seeing a recovery keep executing the strategy after losing 80% of your Capital even though the average outcome after 4 years is around $2 million some traders in this
[14:40] situation would still have less than $100,000 after the same period This is control risk you won't survive long enough to see the gains now let's shift to the calendar strategy at full Kelly which came out to much higher 60% bet
[14:54] per trade the results 485 bankruptcies out of the 10,000 paths that's about 5% of all accounts going to zero not only that but when we check the draw down 80 to 95% range and the biggest warning sign the distribution of draw Downs is
[15:11] skewed heavily towards 100 meaning that at this bet size you would eventually Kelly has way too much variance however because of this aggressive sizing this strategy was able to turn $10,000 into over $1 million in a few paths in under
[15:28] the catch this size will eventually lead to bankruptcy period I would never trade everything for the shot at massive returns that's your choice let's use
[15:41] variance while not reducing returns by as much for instance half or 50% Kelly reduces variance by 50% but only reduces returns by 25% so let's scale back to
[15:54] means dropping down to around 2% per trade after 4 years the mean portfolio size drops but the Max draw down also drops significantly the largest draw down is now around 37% and the average Max draw down is only 15% which is much
[16:10] more manageable the mean sharp ratio over the 4 years is around 3% which is excellent for the calendar strategy we take the 30% Kelly BET which translates into around 18% per trade the return graph looks really strong but the draw
[16:22] Downs are still too high for My Lying the max is around 76% with the mean around 40% which is too high for me so I reduce it further to around a 10% Kelly which is 6% per trade and this finally brought the draw Downs in line with what
[16:34] I look for in a sustainable strategy at this level the sharp ratio was actually prefer to trade between these two structures both are viable but for me the calendar strategy is better balance of risk and reward I've seen too many
[16:48] resulted in a devastating loss so despite the straddle offering potentially higher returns for my sanity and preservation of capital I trade the C Cal let's now take a long-term view over 10 years starting with $10,000
[17:02] trading the calendar strategy at 10% Kelly the mean ending portfolio value is around $6 million this equates to a compound annual growth rate of around 90% The Max draw down distribution sees a mean Max draw down of around 20% a
[17:15] mean longest draw down of around 6 months the win rate is 66% the expectancy per trade is 265 and the mean sharp ratio is 3 and 1/2 overall this strategy performs extremely well but like I said earlier position sizing is
[17:29] everything no matter how strong an edge is if you size too aggressively you will blow up risk management is the key to longevity and preserving capital is shared a python script that allows you to scan earnings events that fit the
[17:43] criteria we've discussed you'll find a detailed document on how to set it up enter a ticker with an upcoming earnings event and the program calculates all the data if all three conditions are met it Flags the trade as is recommend if only
[17:59] two are met but one of them is the term structure slope it marks it as consider if the term structure slope is not met the trade is automatically labeled AV to you now let's run the script and see what we get looking at Amazon they have
[18:13] earnings tomorrow and the model confirms that this is a green recommended setup I executed the trade I opened a February 7th March 7th call calendar for a
[18:26] $3.33 debit the following morning about 15 minutes into the market open Amazon had moved only 2 1/2% which was well below the expected move priced into the for a nice profit of $9,300 now if you look at the straddle trade which I
[18:42] didn't take you'll see it actually made even more while trading fewer contracts 20 contracts for the straddle versus 100 contracts for the calendar this aligns higher potential returns when things go well but when things go really bad the
[18:57] calendar position takes a hit while the straddle can get absolutely crushed with prefer the calendar structure for this strategy it offers a better balance of risk and reward if you want to run these calculations yourself grab the python
[19:11] earnings events if you made it to the end Please Subscribe like and comment for any video you might want me to cover going forward thank you
⚡ Saved you 0h 19m reading this? Transcribe any YouTube video for free — no signup needed.