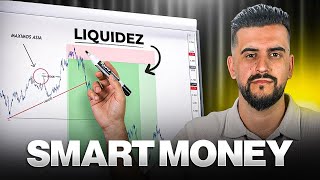

I Withdrew $300K+ Trading – See Proof
45sHigh-value claim with live proof of massive payouts creates immediate curiosity and credibility.
▶ Play Clip"Title promises a profitable trading strategy and the video delivers a detailed, transparent walkthrough with live examples and verified payouts."
In this video, Benjamin reveals his personal trading strategy that has earned him over $300,000 in payouts from funding companies. He emphasizes transparency by showing live withdrawal data and explains the core principles of his approach, which focuses on trading against the crowd during high-volatility sessions.
Benjamin introduces himself as a trader with over 7 years of experience and promises to reveal the secrets of his trading strategy. He emphasizes transparency by showing live withdrawal data from Fund Next, where he has withdrawn over $120,000.
Benjamin states that his total payouts from multiple funding companies exceed $300,000, including $93,000 from Alpha Capital and $48,000 from FTMO. He claims this is rare in the Spanish-speaking trading community.
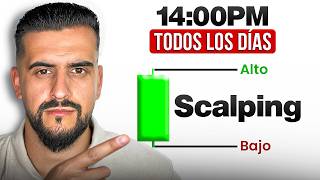
The strategy focuses on high-volatility periods: London Stock Exchange opening (9:00-11:00 Spanish time) and New York Stock Exchange opening (14:00-16:30 Spanish time). These sessions often create the day's high or low.
Benjamin explains two entry models: when price breaks a high, look for sells; when price breaks a low, look for buys. This is opposite to what most traders do, based on the idea that liquidity is trapped above highs and below lows.
The core rule: when price breaks a high, look for sells; when price breaks a low, look for buys. This contrarian approach aims to capture moves after liquidity is taken.
Benjamin analyzes a recent EUR/USD trade on December 16. He marks a one-hour high, waits for macroeconomic news (NFP at 14:30, PMI at 15:45), and then enters a sell after price breaks the high and shows bearish confirmation on a 1-minute chart.
After the news, Benjamin looks for a shift and imbalance on a 1-minute chart. He enters a sell trade at 16:00, targeting a risk-reward ratio of 1:2 or higher, and manages the trade by closing partial positions.
Benjamin concludes by urging viewers to backtest the strategy themselves. He emphasizes that the strategy has worked for him for over 4 years and that the example shown is from the current week.
Benjamin's trading strategy is based on trading against the crowd during high-volatility sessions, focusing on liquidity grabs at highs and lows. He encourages viewers to backtest the approach and verify his claims through transparent withdrawal data.
What are the two high-volatility trading sessions Benjamin uses?
London Stock Exchange opening (9:00-11:00 Spanish time) and New York Stock Exchange opening (14:00-16:30 Spanish time).
04:06
What is the core contrarian rule of Benjamin's strategy?
When price breaks a high, look for sells; when price breaks a low, look for buys.
09:45
Why does Benjamin prioritize technical analysis over macroeconomic news?
Because macroeconomic data is often already priced in, and technical analysis of liquidity zones is more reliable.
19:30
What entry confirmation does Benjamin look for on a lower timeframe?
A shift and imbalance (gap between first and third candles) on a 1-minute chart.
21:22
What risk-reward ratio does Benjamin recommend as a minimum?
At least 1:2.
22:57
How much has Benjamin withdrawn from Fund Next alone?
Over $120,000.
01:03
What is the total amount Benjamin claims to have withdrawn from all funding companies?
Over $300,000.
01:33
Why does Benjamin use a 1-minute timeframe for entry?
To achieve a higher risk-reward ratio with a smaller stop loss.
21:36
What does Benjamin suggest doing after entering a trade?
Close partial positions at key liquidity levels to lock in profits.
23:25
What is the main reason price tends to react after breaking a high or low?
Because it has liquidated many positions and taken liquidity from the market.
12:51
Transparent Withdrawal Proof
Benjamin shows live withdrawal data from Fund Next, proving his claims with over $120,000 withdrawn.
01:03Importance of Trading Sessions
He identifies specific high-volatility windows (London and New York openings) as critical for his strategy.
04:06Contrarian Entry Logic
The strategy goes against conventional wisdom by selling at highs and buying at lows, based on liquidity concepts.
09:45Prioritizing Technical Analysis
Benjamin explains why he ignores macroeconomic news direction and relies on price action and liquidity zones.
19:30Encouragement to Backtest
He urges viewers to verify the strategy themselves rather than blindly trusting, promoting independent learning.
25:29[00:03] in payouts from funding companies. And in this video I'm going to explain all the secrets of my trading strategy so that you can achieve it too. quickly. My name is Benjamin and I have been dedicating my time to trading for over 7 years
[00:19] . And as always on my YouTube channel, when I talk about data and when I talk about withdrawals and money in trading, I like to share it so you can see that it's totally true. Therefore, I'm going to go into Fund Next,
[00:34] one of the funding companies I use and have withdrawn quite a bit of money from, and you'll see me live while I update the page so you can see how much I've withdrawn with Fund Next, since I like to do everything
[00:49] transparently. Here we are inside the Fund Next funding company and we are in the payouts section. This is where you'll see all the payouts and the total amount that the person has withdrawn. In this case, as
[01:03] you can see here, my name is Benjamin C. And we're going to update true. Okay, we reload the page and see that the amount is still here. Well, with Fund Next alone I've withdrawn more than 120,000,
[01:19] 120,000, specifically 120,000 with 0.458 D. This is just with one funding company. Imagine with the remaining ones, because the amount that would currently add up would have to be recalculated, but it
[01:33] far exceeds $300,000 in payouts with funding companies. As amount. This has been done by practically no one in the Spanish-speaking world, or at least I haven't personally seen it. And on top of that, sharing your screen and
[01:48] updating the page—I know a lot of people post screenshots and photos, but hey, sharing here with you and updating without any screen capture, more than $10,000 in just one funding company on Fund
[02:02] Next. So, imagine the potential of this trading strategy. But not only that, as you can see, here I am also sharing an account, a funding account that is currently funded and
[02:17] currently funded and has more than $720 in it . In this case, I will receive this payment on December 22nd, meaning payment on December 22nd, meaning I will withdraw another $4,720
[02:31] from Funded. Next. Absolute madness. In fact, right now it's not listed here, but I currently have a floating operation that I think is above 4000, approximately 3000, so it will most
[02:43] likely end up being more. If you want to stay updated on this withdrawal, share it there when I withdraw it, as I transparently. And I haven't only withdrawn from that funding company, Fund
[02:56] Next, but, for example, another with it I have withdrawn more than, if I'm not mistaken, $93,000. I'll leave the see that it's absolutely true. And not only that, but with FTMO, the pretty girl
[03:12] , the most recognized fund company , they have also talked about more than $48,000, making a total of making a total of
[03:27] funding companies. If we put together, for example, Neoma, Wall Street Funded, which Bright Funded. If we put all these funding companies together, well, I can tell you that it funding companies together, well, I can tell you that it easily exceeds 300,000.
[03:40] An absolute outrage. And I'm not doing this to show off and say, "Hey, Benjamin is so good at trading, what a great trader he is." No, I'm simply sharing it with complete transparency because I believe there is n't much transparency in the trading sector
[03:52] . That's why I like to teach it, update the page, and say, "Hey, you really can make money, a lot of money, with trading, and potential of the trading strategy
[04:06] first thing we're going to take into account is the timing." And you might ask, talking about, Benjamin?" Well, by " schedules" we mean mainly
[04:18] where there is greater volatility in the market. We're not interested in accumulating and doesn't have much movement or volatility, because then the price will just be , well, acting foolishly,
[04:33] staying in a range, and that's not what we're interested in as traders, especially as day traders, which is what I personally do and what I do with this strategy that I'm going to explain to you. These schedules basically cover two
[04:46] time zones. The first would be the opening of the London Stock Exchange, which opening of the London Stock Exchange, which runs from 9 a.m. to 11 showing you here on the screen are referring to Spanish time. If, for
[04:59] example, you live anywhere else in the world, whether it's South America, the East, I do n't know where, and you have a different time zone, then basically what you have to do is go to HGPT or Google, wherever you want, and put in this
[05:15] time conversion. What we are interested in is knowing, within our we live, in the country in which we live, what these schedules are. Therefore, the opening of the London Stock Exchange , which is at 9 a.m., 11 a.m.
[05:28] Spanish time, this is the first time we have to take into account, these two hours only. This is where, on most days, the price creates the high or low of the day. Because? Well, because normally what this
[05:43] opening of the London Stock Exchange generates is manipulation of the day. This obviously there are times when it doesn't, but as a general rule the opening of the high, the low of the day, because basically that is where that greater
[05:59] volume or that main volume is generated, the first volume, the first volatility London session, since previously there would have been the Asian session, which is the one that comes before the
[06:12] London session. It's that opening of the stock market, the Asian session, where as a rule the price is usually much calmer, unless China, for example, does something, then the market moves a lot. But as a general rule,
[06:25] quite quiet until this London session opens, which would be from 9 a.m. to 11 a.m. This is where we need to be on high alert and watching the chart, so that depending on the direction, we can decide whether
[06:39] to enter or not. The next time that interests us would be the New York Stock Exchange from 2 pm to 4:30 pm, as before, just do the time conversion, put it in Google or in GPT chat.
[06:55] Hey, if I'm from, for example, the United States, or if I'm from Argentina, or if I'm from Colombia, or if I live in the Canary Islands, wherever , what time is this according to add it to your mobile phone or remember it to know what the schedules are
[07:10] important because this is where the and receiving orders, so volatility is where it has the greatest power. even, I dare say, more important than the opening of the London Stock Exchange
[07:26] . Because? Basically, because the New York session is where, as a rule, the vast majority of macroeconomic news, the high-impact news that directly affects the price, usually occurs
[07:39] at 2:30 in the afternoon, 4:00 in the afternoon, or 3:45 in the afternoon. This is usually when the United States government and certain entities release macroeconomic data that is very
[07:54] price. For example, US unemployment, the NFP, the PMI, all that kind of news is usually given at 2:30 in the afternoon, at 4 in the afternoon, at 3:45, so on some occasions we would have to wait for the
[08:09] New York session until they give that data. Not because we are interested in the data that will come out, but because the price usually makes a range, it usually accumulates until that data comes to light. So on many occasions,
[08:22] for example, when there is an NFP at 2:30 in the afternoon in the New York session, I usually don't trade the London session because I'm waiting for that data to come out so that the price can show
[08:35] its hand and show the direction it finally wants to go and not fall for the many occasions, as I mentioned, during the London session, the price tends to accumulate quite a bit and doesn't usually hit that impulse, that great volatility, until
[08:49] that data comes out. And obviously I don't that data comes out and I'm not protected, because if the price has started off in the break- even zone, the data will come out, and if I'm
[09:05] with a fairly wide stop-loss because the problem with news is that the stop- loss usually closes with a sometimes, as I mentioned, it's much better to wait for
[09:20] that news to come out at 2:30 or 4 in the afternoon during the New York session and not in the example I'm going to explain now, based on all the points of my strategy, this happens. We wait for the 4 pm macroeconomic data to be released
[09:33] in the New York session before trading and entering the market in the right direction. But don't worry , that will come later in the video because I have to tell you more about the strategy. In this
[09:45] strategy we will have two entry models. The first would be for finding sales and the second would be for finding purchases. I'm sure these two figures are familiar to you because it's often explained that the
[09:59] for example, when the price breaks a high, should continue to rise. Just like when the price breaks a low, the price would then be in a bearish structure, a bearish trend, and should continue to fall.
[10:14] Well, since the vast majority of people lose money trading, we should do the exact opposite of what people tell you trading. Because if the vast majority are losing money, why are we going to
[10:28] try or copy what everyone else is doing? It makes no sense. Personally, with my strategy, I am looking for precisely the opposite. When the price breaks a high, for example, in this first pattern, which would be looking for
[10:41] sell signals, we would be looking for some of which I'm going to reveal to you in this video, to continue selling. And you might say, "Hey, if it has broken
[10:53] a high, what's the point of us looking to sell?" Basically, because the price moves based on liquidity, and above all the highs and below all the lows is where all the market liquidity is found.
[11:05] All those pending operations such as by limits, by stops, sells, sell stops, stop loss and take profits. All those pending orders are located above every high and below every low. Because really, think about it, what's the only
[11:19] way to protect yourself in the market or to come out on top? By protecting yourself at the previous high or the previous low, or by placing your profits, your take profit, at the next high or the next low. There is no other way to hedge
[11:34] your position in the market, so in the vast majority of cases, when the market liquidates, it exceeds a maximum or a minimum. It will leave us with quite a big reaction if it happens, especially during the times I
[11:47] mentioned earlier, at the opening of the London Stock Exchange or the opening of the New York Stock Exchange. That's where the price will pick up all that liquidity, whether at a high or a low. And we are going to look for the
[11:59] opposite movement to what the vast majority would look for. As I said people, when the price surpasses a high, would look for buys when the price retests, whether it's a Fibonacci retracement, an
[12:12] order block, an imbalance, or whatever, but in most And why? Because once the price has absorbed this liquidity from this peak, the price will most likely move towards the next liquidity zone, which
[12:25] would be this low we have here. Obviously, there's a chance this could go wrong, but I encourage you to backtest what I'm telling you. Go to the one- hour, four-hour, and daily timeframes and tell me what
[12:37] the price does in the vast majority of cases when it settles, when it exceeds a high or a low, within the time frame I mentioned earlier, within the London session and within the New York opening. You'll see
[12:51] price tends to react quite strongly. Because? because it has liquidated many positions and taken a lot of money from the market that had it above that high or below that low. In the case of purchases, as I
[13:06] opposite. When the price exceeds a minimum, the vast majority of people would look for sales. Because? Well, because the price is showing a downward trend, a bearish structure, or whatever. So, what people do is,
[13:19] for example, take a Fibonacci retracement from the highest point to the lowest point and try to find sell opportunities , whether it's, for example, a supply and demand zone, an order block, a trend line, or
[13:31] whatever, because as a general rule it is explained that when the price breaks a lower and lower low a bearish trend is found, so the vast majority of people would continue looking for sell opportunities. What is it that we need to look for?
[13:44] money, we have to do the exact opposite of what the vast majority do, which is to lose money, which would be to keep looking for sales. In our case, have removed everything I already mentioned at the beginning of the video, in
[13:58] this case I would look for buys when the price liquidates, when the price reaches all those stop-loss orders, all those market controls that the price needs to continue in the correct direction. That's when I would be looking for buys as long as it
[14:11] gives me the entry confirmations that I'm looking for and also as long as it's within the zones I mentioned earlier, the London Stock Exchange session or the New York Stock Exchange session. If all of this is true,
[14:25] that is, if the price breaks a high or a low within the look for entry confirmations, some of which I will now explain in the example I am going to show you, to join in the right direction.
[14:38] Obviously, this strategy, this way of looking at the market, doesn't have a 100% win rate, that's impossible, but if you repeat this continuously, believe me, in the vast majority of cases the price will go in your favor. So I'm going to give you
[14:51] a summary. When the price breaks a high, you look for sales. And when the price breaks a low, we look for buys. Yes, exactly the opposite of what the vast majority do, which is also what the vast majority do is lose
[15:04] money, so we have to do it differently if we want to make money in trading. And now let's look at an example so you can see all these concepts grouped together and also see some of the input confirmations
[15:17] that I personally use. Here we find ourselves in the example that we are going to analyze, which I have also uploaded to my Instagram, which by the way completely free of charge, you have my Instagram below in the description, it's
[15:30] basically something. I also posted this trade on Instagram, explaining , but here I'm going to explain it more thoroughly so that everyone understands, taking into account the times, the liquidation of
[15:44] a maximum in this case, and also some entry confirmations that I account, as I mentioned at the beginning of the video, that there was some New York session, so my rule says that I first have to wait for
[15:58] that macroeconomic data to come out and then, based on what I settle after that data has been released, decide whether to enter or not. Also, of course, I have to see if the entry confirmations are good or not to avoid entering a bad trade.
[16:11] In this case, as I've told you, we mark this maximum that we have here. We are in the euro-solar system in the one-hour time zone . As I mentioned before, I invite you to look at the 4-hour, one-hour, or daily timeframes and see that
[16:24] same thing always happens: when the price clears a high or low, it tends to the trading zone I mentioned, the London or New York one. But this isn't the only example we have; if we move a little to the left,
[16:37] we see that the price here has a maximum of one hour. And this is precisely this peak was created on December 11th and the liquidation price on trade that I am going to explain to you is from today, December 16th, when I am recording this video
[16:49] . And this same scenario, this same setup, so to speak, was done yesterday, so according to the trading strategy I use, you could have caught two trades in two days to see that this
[17:01] today, unlike many strategies that give you examples from the 20th century and you no longer know if it is good or not. Well, what I 'm explaining to you happened today and yesterday so you can see that this strategy is totally up-to-date and still
[17:15] works very well. As you can see in this example, the price reached this last we could have easily caught a trade in the same way that I'm going to explain now, the trade that I caught today, December 16th. Let's look at
[17:29] We have this one-hour high here, and not only that, but the price also form of a trend line. This is something he also often uses. This is more comments so I can take it into account and record a video about it. But as a
[17:43] general rule, trend lines tend to be liquid, which the market the right move comes, the price has liquidity, has money to take. That's why it creates these accumulations. After accumulating, manipulate, which is what he's going to
[17:57] do now, and then distribute with considerable force. On this occasion, as I told you, we also had some macroeconomic news. we would have the NFP at 2:30 in the
[18:09] for the dollar, but there was also a very important news which was the manufacturing PMI for the dollar, which was at 3:45 pm, so I always the high-impact news to come out. In this case, the last high-impact news
[18:24] for the dollar is at 3:45 PM, so we would have to wait for that news to come out and, based on what happens after that data is released, enter or not in the liquidated the maximum or the minimum, that is, the liquidity point that we
[18:37] had already planned and analyzed in advance . And we would also have to see if it . Basically, what we're going to do is wait until 3:00 PM, well, until 3:45 PM. In this case, notice that this is the
[18:51] 2:30 NFP news report, okay? Do you see this large candle? It continues to accumulate taken yet, so there would be quite a lot of money, quite a lot of liquidity, and we would have to wait for the data to come out at 3:45 PM. In this case, the data
[19:03] is negative for the dollar, so many of you might say, "Hey, Benjamin, if the data is look to buy the euro, right? Because if the data is bad for one currency, in this the euro, should strengthen, should rise. Therefore, the euro
[19:17] against the dollar, the chart we're analyzing here, if the data is rise. Benjamin, why are we looking to sell?" Well, because in the vast macroeconomic news is absolutely useless . I personally tend to give
[19:30] much more weight to, and it's a higher priority for, the price to be in a technical analysis zone, that is, in a zone of optimal liquidity. If, for example, the data had been good for the dollar this time, it would be
[19:42] telling me that the euro could fall based on that news and also based on the technical analysis we have here . But if the news is bad should rise, but my technical analysis is telling me to sell. In other words, my
[19:58] broken through a high, so we should look for selling opportunities." I would continue looking for selling opportunities because I prioritize technical analysis much more than most cases, macroeconomic data is already fully
[20:12] priced in, and by the time the data is released, the market has already factored it in personally recommend that you prioritize what technical analysis—the liquidity zones the price is entering—and not so much the
[20:27] macroeconomic data. Obviously, if both align, all the better, but personally, I prioritize your technical analysis, which is showing the price breaking through all. Once that macroeconomic data comes out at 3:45 PM, which, as we
[20:41] going to move to a lower timeframe. Here we see the high This was the news... High impact at 2:30. Boom, look at this whole rise, okay? You're seeing it on camera, and the price keeps going up,
[20:55] above the one-hour high, okay? This high we have here, this line, okay? I'm making sure you're seeing it clearly on the chart. We're above this high, so we're looking for selling opportunities, and
[21:07] high it created after the news broke. It's 4 PM now , there aren't any more; they all end at 3:45 PM. And here we are waiting for some very precise confirmations. Pay attention to the news because it's
[21:22] basically looking for a shift, an imbalance where the price is man, I don't want to be here." I'm going to create a bearish candlestick pattern, a proper imbalance, and that's where we're going to enter on a
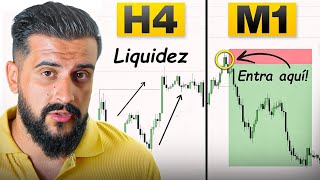
[21:36] 1-minute timeframe. Why am I going to the time frame of one minute? higher risk-reward ratio, because if I go to the 5-minute or 15- minute season, my stop-take-profit ratio will have to be very large, so
[21:49] small. That's why I go to a shorter timeframe; 1 to 5 minutes is usually my timeframe where I execute my trades, and based on in a shorter timeframe. Like I said, from 1 minute to 5 minutes. Here we can
[22:04] observe that the price has already made a shift, right?, an has also created an imbalance in just one minute. This would be leaving us at 4:00 in the afternoon. As I mentioned before, we would be within
[22:18] our New York operating session which runs from 2 pm to 4:30 pm Spain time. And all the macroeconomic data would have been released, so we could perfectly well enter into the operation. You can
[22:30] put your entry order here, okay? If it creates any further imbalance, that is, a gap between the first and third candles, then you could move your entry because it might not mitigate that imbalance, but rather it continues to fall and the
[22:42] So, we would also have to wait and see if it does n't mitigate the problem and doesn't place this order, because then we would have to move your entry. This time we would are already inside the entrance and things are starting to go in our favor.
[22:57] to 1 to 2, so we'd already be in profit here, basically before, you can push a little further and, for example, go for the last low that created that one-hour impulse, so there would be
[23:11] liquidity here, or you could perfectly well go for the price to attack other Obviously, the ratio here is going to be much higher, okay? The first one 1 out of 10, okay? But anyway, in the meantime you can start closing
[23:25] always recommend closing one or two positions, closing them completely, closing them Because? Basically, because the higher the price ratio you aim for, the or hit your stop loss, so a profit ratio of one to two is
[23:40] let's still see how high the price goes, because it's skyrocketed, okay? He has reached 15 perfectly. Another minimum we would have here in 5 minutes would be this, okay? That would give us 1.5, you see. And I don't know if it's reached 18.
[23:52] Well, it's reached 18 and 110. Here we have the two ratios and just coincidence. The price has reached this low, boom, and has also important to know how to allocate liquidity for when you're going to exit the
[24:05] trade. If you enter the trade very well , but let the trade run into areas where it may react and you don't close it or put in a pre-benefit, then obviously the entry is going to go badly. That's why it's very important to locate liquidity both
[24:17] maximum, and also to exit. Hey, what's the lowest price I can expect might the price react? Is this minimum, this minimum, okay? Well, at this minimum I close completely, or at this minimum I close completely, or I close completely to
[24:29] one or two, which you can also do perfectly and it works very, very well. In fact, it's one of the best, because I also tell you, you have to know and you have to be or 1 to 9. It's quite risky, and on many occasions the price will go to
[24:42] wondering, "Why didn't I take profit?" No, I 'm sure it's trading strategy. With this strategy, as I've told you before and as I've shown you, completely transparently, I've withdrawn more than $100,000
[24:57] if I'm not mistaken, from Funder Next, $ 93,000, $96,000 from Alpha Capital, and more than the three largest funding companies. Then we have Neoma, which has also fact, in one payment I made a withdrawal of over $20,000, which put me at the top of
[25:13] , here you are seeing the potential of a very simple strategy. When the When the price reaches a minimum, we buy. And that's the simplicity of the completely transparent results, the incredible potential of this
[25:29] trading strategy. And here we reach the end of the video. I hope you understood everything perfectly and also so that you understand the great potential that this trading strategy has . I've been using this
[25:41] strategy for over 4 years now and it still works the example I analyzed was from today and another possible entry point was from yesterday, the maximum that I also analyzed for you. The price,
[25:55] high, tends to react downwards, and when it breaks through a low, it also tends to react, so the only thing left for you to do is to see it for yourself. I urge you not to believe
[26:09] anyone on YouTube or social media, and especially, if you're going to verified withdrawals, payouts, and that they actually live off trading or at that you try it for yourself. In other words, you've already seen the fundamental things that
[26:23] govern my strategy, the things on which my strategy is based, and now you should go to your TradingView chart or the platform you use for backtesting and test it yourself. Listen, when the price exceeds a
[26:35] peak, it usually reacts downwards. When the price exceeds a minimum, it usually the price usually do during these trading hours? These entry confirmations that Benjamin has revealed to me a few, aren't useful. It
[26:48] 's time for you to analyze all of this yourself and decide for yourself whether this strategy works or not. Spoiler alert, it works because it works for me and you've already , I hope you enjoyed the video. If so, give it a like and leave me
[27:01] a comment, it really helps the YouTube algorithm, and I'll see you in the YouTube algorithm, and I'll see you in the next video.
⚡ Saved you 0h 27m reading this? Transcribe any YouTube video for free — no signup needed.