
Predict Price Reversals with Imbalance
40sPromises a high-accuracy prediction method, sparking curiosity and debate among traders.
▶ Play Clip"Title accurately reflects content: the video teaches how to identify and trade imbalance in crypto, as promised."
This video explains the concept of imbalance in the Smart Money trading strategy, demonstrating how to identify and trade imbalance zones on cryptocurrency charts. The presenter shows that price tends to return to these zones, and provides real examples on Bitcoin and altcoins.
Imbalance zones are areas where price is likely to reverse after a sharp move, as market algorithms aim to fill these ranges.
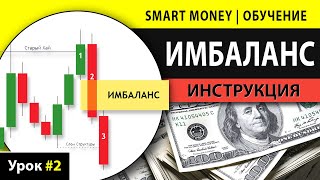
Imbalance forms between the extremes of the first and third candles, indicating a range where there was an imbalance between sellers and buyers.
Institutional participants control price movement and need to fill their positions at specific prices, so they push price back to imbalance zones.
On the daily chart, bearish imbalances were processed effectively over 6 months. On a 4-hour chart, multiple imbalances formed and were filled.
Imbalance works on all timeframes from monthly to minute, and within a daily imbalance you can find nested imbalances on lower timeframes.
Context matters; some imbalances may not give a significant reaction, so it's important to consider the overall trend and other elements.
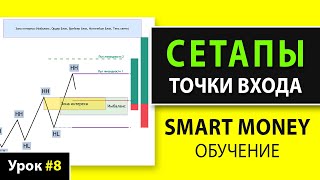
Two setups: single swing high removing liquidity with impulse and imbalance, and double top/bottom removing liquidity twice with imbalance.
Enter trade at 50% of imbalance, stop behind high/low, target nearest significant level. Risk-reward ratio often 1:5 or better.
On hourly chart, price tested imbalance in sideways trend. Entry from 50% imbalance on 5-minute chart gave 1:6 risk-reward in 3 hours.
Price usually fills 50% or 100% of imbalance. Stop loss behind high/low or other elements. Take profit at nearest liquidity pools. Minimum risk-reward 1:3.
Imbalance is a powerful tool for predicting price reversals, especially when combined with liquidity pools and other Smart Money concepts. Using it can significantly improve trading accuracy and profitability.
What is an imbalance in trading?
An imbalance is a price range where there was an imbalance between sellers and buyers, formed between the extremes of the first and third candles after a sharp move.
02:16
Why does price return to imbalance zones?
Because large institutional players need to fill their positions at specific prices, and they push price back to imbalance zones to complete their orders.
03:11
What percentage of imbalance is typically filled before reversal?
Price usually fills 50% or 100% of the imbalance.
14:36
What is the recommended minimum risk-reward ratio for trading imbalance?
At least 1:3.
16:02
Name two common setups for trading imbalance.
Single swing high removing liquidity with impulse and imbalance, and double top/bottom removing liquidity twice with imbalance.
07:34
Where should a stop loss be placed when trading imbalance?
Behind the high of the second or first candle, or behind the nearest high/low, or behind other elements like order block.
15:31
What is the fractal nature of imbalance?
Imbalance works on all timeframes, and within a higher timeframe imbalance you can find nested imbalances on lower timeframes.
05:41
Imbalance as a price magnet
Introduces the core concept that price tends to return to imbalance zones, which is the foundation of the strategy.
00:04Large players control price
Explains the rationale behind imbalance trading: institutional participants need to fill positions at specific prices.
03:11Fractal nature of markets
Highlights that imbalance works on all timeframes, making the strategy versatile for different trading styles.
05:41Common setups for trading
Provides actionable patterns that traders can immediately use to identify high-probability trades.
07:34Entry and exit rules
Gives specific guidelines for entry at 50% or 100% imbalance, stop loss placement, and take profit targets.
14:36[00:04] certainty where the price will reverse? Is it possible to predict with high accuracy where the price will rebound after a sharp rise or fall? The answer is yes. It is possible. There are specific areas on the chart that are a
[00:19] magnet for the price, and market algorithms always strive to fill these ranges. Watch this video to the end and you will find out why this happens and how it works. I will show real examples on the Bitcoin chart. And even if you don't believe me, you
[00:35] Bitcoin chart. And even if you don't believe me, you can check it yourself on history. on the Smart Money concept. In it, we will discuss in detail such an important element
[00:48] as imbalance. There is a separate video on the basics of the smartmoney concept on my channel. There I analyzed imbalance in conjunction with liquidity and showed real examples of how these two factors actually move the price up or down.
[01:01] The link is on the screen and also in the description. In this video, we will dwell in more detail separately on imbalance so that you better understand how to make money on this information. Before we continue, I have
[01:14] important news for you in my Telegram channel. I constantly post reviews of trading situations that arise during the day for different coins to make it easier for you to find profitable setups there. I share my trades and analyze
[01:28] them, publish lists of coins for the current day that I trade myself, give recommendations on where to enter a trade and where to exit, post many useful tips and life hacks that are not on YouTube, help beginners achieve a stable profit, and
[01:44] experienced traders improve their trading skills using the smartmoney concept. I collect all the questions that you send and then give detailed answers to them in case of emergency situations in the market, whether it be a sudden pump or a sharp fall. I
[01:58] go live whenever possible and give my recommendations and analysis, and most importantly, all this is absolutely free. Join our community and we will trade together. The link to my telegram channel is in the description.
[02:16] candles. The area that is formed between the extremes of the first and third candles clearly displays the price range where there was an imbalance between sellers and buyers. To simplify, we can say that in the
[02:29] bullish zone. There were no sellers in the imbalance zone, and there were no buyers in the bearish imbalance zone. sellers in the imbalance zone, and there were no buyers in the bearish imbalance zone. In other words, an imbalance is formed because there was no
[02:43] buyers in this range. That is, one part of the market was unable to complete transactions in the required volume due to the fact that the price was offered unevenly, and the market strive to effectively balance the price so that both buyers and
[02:58] sellers have equal opportunities to buy or sell an asset in any price range. That is why, sooner or later, the price will return to the imbalance zone. Moreover, from the first lesson, you already know that large players
[03:11] control one hundred percent of the price movement. So, large players are institutional market participants. That is, these are large financial organizations that have complex trading strategies and they have their own interests in buying or
[03:25] selling only in certain price ranges. And if a balance formed in their zone of interest during a sharp price movement, this means that they were unable to fully build up their position at the desired prices, so they
[03:38] will put pressure on the price to return it back to the imbalance zone and completely fill their numbers in Long or Short. Perhaps at first glance This may seem illogical to you and you will object that they can carry out transactions at a better
[03:52] price, but no, this is not how smart capital representatives have obligations to other financial organizations; they need to build a position only at certain prices in order to then make a transaction with another company.
[04:05] Technical analysis has nothing to do with it at all. By the way, classical technical analysis does not operate with such a concept as balance and is more like fortune telling on coffee grounds. Now let's move on to real examples in the
[04:17] first lesson. I have already analyzed the daily chart of Bitcoin, where you could see the effective processing of the most significant bearish imbalances over the past 6 months. But let's focus on this section and look at it on
[04:30] lower timeframes. Let's open a four-hour chart. As a result of this fall, several imbalances were formed and the closest one was here, from which the price reversed, resulting in a sideways trend with these
[04:44] boundaries. By the way, there is a separate video on my channel about how to trade in sideways. The link is on the screen and also in the description. Be sure to study it, because 80 percent of the time the market is traded exactly In such sideways movements, we then see
[04:59] a correction to the lower boundary of the sideways movement and a deviation from below after this spike in the lower boundary. I expect a movement to the upper boundary of the sideways movement. Immediately after the price reversal, a
[05:11] bullish imbalance was formed from which the price reversed in the future. Then we saw it working out balances here, here and here. As a result, the price still reached the upper boundary of the range and we saw a deviation from
[05:26] above, after which there was a sharp drop with the formation of new bearish imbalances. The first has already given a reaction, the second will also be filled in the future. Everything I have just said will work equally well on any timeframe
[05:41] from monthly to minute because the market is fractal and it does not matter whether you are engaged in introductory daytra goblins swing trading or scalping. The imbalance will form on all timeframes. Moreover, as a rule, within the daily
[05:56] imbalance you will find a four-hour, hourly, 15-minute balance, and so on. As a result, moving to a younger timeframe, you can most accurately determine the potential price reversal zone and open a More
[06:12] You probably have a logical question about the exact position. If they have a balance, liquidity. These are magnets for the price. Is it possible to simply open a trade in the imbalance zone and wait for the price to reverse? Sometimes this will be appropriate. If you see that this imbalance is in
[06:26] your zone of interest based on higher timeframes. However, it is important to understand that not every imbalance will work properly. For example, these bearish balance data did not give a significant reaction, since we had a
[06:39] local uptrend to the upper boundary of the range. It was appropriate to work in Long. These bullish imbalances should also not be considered for opening trades. As the law of the upper boundary of
[06:51] the sideways trend occurred, after which a price drop was expected, which is what happened. I strongly do not recommend entering a trade from the first imbalance that comes across. Be sure to consider the context and also be sure to study my videos about the order blog, breaker
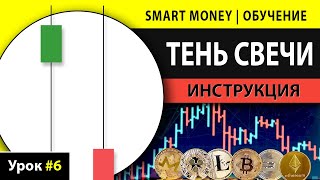
[07:06] mitigation blog, and candle shadow. These elements, together with the imbalance, will significantly increase the accuracy of your trades. Links to these lessons are now on the screen and also in the description. Personally, I always try to look for quotes in which the
[07:19] imbalance is combined with the above-mentioned elements, and now I will give a couple of simple examples that are very common, you can already trade effectively based on them. The first setup is the formation of a single
[07:34] swing high that removes liquidity, that is, collects stops with a subsequent impulse movement in the opposite direction and the formation of an imbalance. The second stage is a double bottom or double top that removes liquidity twice with the subsequent
[07:49] formation of an imbalance. Of course, there are many more setups for the effective use of the balance, I talk about this in training for a beginner, you can already start with these two, and now I will show how to use these
[08:03] setups on real charts, and not only on Bitcoin, but also on altcoins. I will intentionally show the following examples on lower timeframes from hourly to 5-minute and you will see that according to the smartmoney concept, you can
[08:16] trade effectively. Not only positionally, but also intraday and even for quick scalp intraday and even for quick scalp trades, this also works great.
[08:30] previous significant High and a sharp reversal in the opposite direction with the formation of an imbalance, we enter a trade from 50 percent of the imbalance, stop for High, take for the nearest A significant risk- reward ratio of one to five.
[08:49] same coin: a spike at the upper border of the range, followed by a sharp reversal with the formation of an followed by a sharp reversal with the formation of an imbalance. Entry from 50 percent of the imbalance, stop behind the high take at the lower border of the sideways range. The risk-reward ratio is 1 to
[09:04] risk-reward ratio is 1 to 5. The support zone, a double bottom is formed, followed by the formation of an imbalance. The followed by the formation of an imbalance. The
[09:19] on the channel. Let me remind you that in 80 percent of cases, I use it in combination with the balance, an order block, a breaker, a mitigation block, and a candle shadow. This significantly increases the accuracy of transactions. Be sure to study the video for each of
[09:35] in the description. So, here we also enter from 50 So, here we also enter from 50 percent of the imbalance with a stop loss in this transaction. I would fix the profit in two parts, 50 percent at the nearest equal
[09:50] edges, since this is significant semi-liquidity, which will be removed first. Here, the risk-reward ratio is already one to three, and the remaining 50 percent I would have pulled before this High, here the ratio of sharp and
[10:05] before this High, here the ratio of sharp and profit is more than 1 to 5 previous Liquidity Pool plus a retest of the previous imbalance in the Discount zone, which was formed inside the order block, then we see a reversal
[10:21] with the formation of a new imbalance and the continuation of the movement from it. As you can see in this setup, there is a combination of several factors and elements of the smartmoney concept, which significantly increases the likelihood of
[10:34] this setup working out. Entering a trade from 50 percent of the imbalance stop with gold, the goal of updating the previous High, the risk-reward ratio is more
[10:46] than 1 to 6. By the way, in the near future I will post a new video on the channel about how to determine the Premium and Discount zones using the Fibonacci grid. So subscribe to the channel so you do n't miss it. In the meantime, you can find this
[10:59] information in text form in my Telegram channel link in the description of stops from previous Highs and a sharp absorption of the growing candle by
[11:13] self-formation of the imbalance. Also, pay attention to additional factors. The reversal occurred from the order blocks in the Premium zone classic seen on higher timeframes.
[11:27] Entering a trade from 50 percent of the imbalance, stop loss, target for updating the previous low. The risk-reward ratio is almost one to five. Now, an example of a recent trade on Bitcoin
[11:42] on the hourly chart is visible. A clear sideways trend in this area from above has tested the imbalance, and the current structure indicated that it would soon be tested. I have already searched for a trade below this imbalance in this area. The
[11:59] update these equal layers, and fill the bullish balance with it, accordingly, lock in profits. I will be here looking for an entry point during the London session. We see the removal of stops from these equal highs. I will soon release a new
[12:14] which it is optimal to open trades, so subscribe often. During the the formation of the current day's high or low, and I assume that this
[12:26] was the current day's high. Let's switch to a five-minute timeframe. Here, apparently, the formation of a balance after removing stops from equal levels, as well as the word substructure, is visible on 5 minutes. Entering a trade from 50 percent of the imbalance,
[12:42] stop loss, target, as I said earlier. The nearest hourly imbalance has a The nearest hourly imbalance has a risk to reward ratio of 1 to 6. This is an excellent intraday trade, with a processing time of only three hours. With such a low level of
[12:56] risk and such a high profit, you can stop trading that day. By the way, please note that immediately after our entry point, another imbalance is formed, which additionally indicates a further downward movement. If you did
[13:10] not dare to open a trade according to the previous setup, then here was a second chance, although the price did not reach 50 percent imbalance. But even if you entered the trade at its lower border and placed a stop behind the nearest High, then in
[13:24] such a trade the sharp profit ratio would have been even greater than 1 to 7, although the risk was slightly higher here, since such additional manipulations are often removed and only then the price reverses. Although in this particular
[13:37] case, everything worked perfectly at first, it will be difficult for you to visually determine the imbalance area on the chart, so I recommend using special indicators in Trading View that will do this work for you and
[13:52] automatically mark all imbalance zones on the chart. They work very clearly and it looks like this. These indicators will greatly facilitate your analysis. Links to these indicators are also available. You will find the necessary settings for them in my
[14:08] Telegram channel, be sure to subscribe to it, the link is in the description. There I post a lot of useful tips that are not on YouTube, publish my forecasts for the cryptocurrency market and analytics, and also share my trades
[14:21] and give recommendations on which coins are worth paying attention to during the day. There is only unique and useful information there. Now a few words about entry and exit points when trading with their balance. Usually, the price will fill 50 or 100 percent of the
[14:36] imbalance. These are the trigger points for placing a limit order to open a position. In the examples above, I usually opened trades from 50 percent, but sometimes the price will only touch their balance and reverse without
[14:51] filling even 50 percent. You can place a limit order at the beginning of their balance to guarantee entry into a trade. But then the risk-reward ratio worsens. trade. But then the risk-reward ratio worsens.
[15:05] will have to navigate the moment, taking into account additional factors. Personally, I only sometimes set a limit at the beginning of the imbalance and more often people open trades from 50 or 100 percent of its filling, especially on higher timeframes.
[15:18] I try to switch to a lower timeframe and find the nested imbalance within the imbalance on the higher one to clarify the expected reversal area higher one to clarify the expected reversal area
[15:31] percent point. Use the Fibonacci grid, and where to place the stop loss. If you risked opening a trade based solely on the imbalance, then the stop loss can be placed behind the high of the second or first candle, or behind the nearest High or Low. If you
[15:47] additionally took into account elements such as order block breaker, mitigation block, candle shadow, or other setups, then the stop loss is placed behind them. Take profit is placed on the nearest liquidity pools, that is, significant highs and lows, as well as on the
[16:02] nearest significant imbalance. Just make sure that the risk- reward ratio is acceptable for you. I recommend at least one to three. So, you have seen from real examples that imbalance is a magnet for the price.
[16:15] This tool, in combination with liquidity pools, should form the basis of your analysis. If you want to learn to understand the market and predict the correct price movement with a high probability. When you start using imbalance in
[16:28] trading, your profit will increase significantly. You will know where the price is heading and where it will stop, as a result, in addition to profit, your confidence and peace of mind will increase at the end. Like and subscribe to the
[16:41] channel, this motivates me to make new useful videos, and also write in the comments. What topic would you like to see a new video on? If your comment gets enough likes, I will record a video on the
[16:53] topic you asked about. Good luck to everyone and trade wisely.


⚡ Saved you 0h 16m reading this? Transcribe any YouTube video for free — no signup needed.