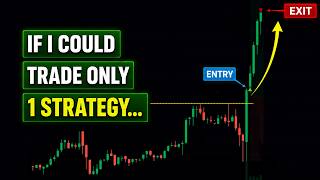

Why I Lost Money on Every Opening Gap
38sTraders relate to the frustration of buying gaps and losing, then discover a solution.
▶ Play Clip"Delivers on the promised strategy with clear rules and examples, but the final 2-minute pitch for SMB Capital slightly dilutes the educational value."
This video presents a mechanical trading strategy for opening momentum (gap up) stocks, focusing on the break of the pre-market high as the single trigger. The strategy includes a gate condition, four filters to avoid false breakouts, and specific risk management rules. The speaker explains why many traders lose on this setup and demonstrates the strategy with three real examples.
Many traders buy the first green candle at the open due to FOMO, but the stock often reverses and stops them out. The correct approach is to wait for the pre-market high to break.
Wait for a 2-minute candle to close above the pre-market high on volume. This confirms the breakout and keeps you out of fakeouts.
The stock must open above both yesterday's high and the prior close. If it opens below yesterday's high, there is supply from short-term buyers wanting to break even.
Volume must be at least three standard deviations above normal (ARV > 3). Price breaking a level is a claim; volume is the evidence.
The breakout candle must have a small upper wick (less than half the body). A big upper wick indicates selling pressure into the breakout.
There must be real news (earnings, sector news) or a significant technical level (e.g., all-time high) driving the gap. Heavy pre-market volume should back the catalyst.
No obvious resistance within 3-5% above the entry. Otherwise, you may be buying into someone else's exit.
The market (SPY) should be above its 20 and 10 SMA and trending up. The stock's sector should be strong. Market tailwinds help momentum trades.
The stop is placed under the low of the 2-minute candle that triggered the entry. Risk per share is typically 2.5-5%, so position size accordingly.
Trim positions at round numbers or prior resistance. Trail the remaining runner using the first 2-minute close under the 9 EMA.
If price closes back below the pre-market high after the breakout, exit the trade immediately.
The opening drive strategy is a mechanical, repeatable model: wait for the pre-market high break on a 2-minute candle with volume, apply filters, and manage risk with a tight stop. The speaker emphasizes paper trading first and sizing small to let the law of large numbers work.
What is the gate condition for the opening drive trade?
The opening price must be above yesterday's high and above the prior close.
02:57
What is the trigger for entry?
A 2-minute candle closing above the pre-market high on volume.
01:40
What volume condition is required for the breakout candle?
ARV (or cumulative volume) must be above 3 standard deviations from normal.
04:38
What is the wick filter?
The breakout candle must have an upper wick smaller than half the body; otherwise, skip the trade.
07:43
Where is the stop loss placed?
Under the low of the breakout candle (the 2-minute candle that closed above the pre-market high).
09:55
What should you do if price closes back below the pre-market high after entry?
Exit the trade immediately.
11:09
How do you trail the runner?
Use the first 2-minute close under the 9 EMA on a 2-minute chart.
10:53
What is the difference between trading the gap and trading the break?
Trading the gap means buying the first green candle; trading the break means waiting for the pre-market high to break on a close.
00:55
What does a large upper wick on the breakout candle indicate?
Selling pressure; someone unloaded into the breakout, making it a trap.
07:58
Why must the opening price be above yesterday's high?
To ensure all short-term buyers from yesterday are in profit and not waiting to break even, reducing supply.
03:14
Wait for the Close
Emphasizes that the key to avoiding fakeouts is waiting for the candle to close above the level, not buying on a poke.
01:40Supply and Demand Logic of the Gate
Explains the rationale behind the gate condition, linking it to the behavior of short-term buyers.
03:14Volume as Evidence
Clarifies that price breaking a level is a claim, but volume is the evidence that confirms the breakout.
04:38Wick Filter Trap
Identifies a common trap where a candle touches the level and then reverses; the solution is to wait for the close and check wick size.
07:43Size Off Your Stop
Stresses that position size should be determined by stop distance, not perceived risk/reward of the level.
09:55[00:03] morning it was the same thing. A stock gaps up on news, the volume looks great, the bell rings, it starts to move, and I'd buy the first green candle, get faded, get stopped out, and then sit there and watch it run without me five
[00:17] minutes later. So, I stopped trading them for a long time. And I went and pulled 30 of the best opening drives I could find. I put them side by side and
[00:29] looked for what they all had in common before they moved. What I found is that this setup is a lot simpler than I was making it. There is one trade here, one,
[00:41] and it's the break of the pre-market high. Everything else, the gate, the filters, the exits, they're just there to keep you out of the bad versions of it and get you paid on the good ones. That's the video. one trigger, four
[00:55] filters, and three real trades where you'll watch the same exact model repeat. So, why do so many traders lose on this setup? Because they trade the gap instead of the break. Here's what that looks like. The stock gaps up on
[01:11] news, the bell rings, the first candle is green, and you buy it because it's moving, and you think that the catalyst is excellent. You don't want to miss it. You have FOMO. That is not a setup. That's a feeling. You have no level, no
[01:27] trigger, and no idea where you're wrong. And about 90 seconds later, the stock rolls over, takes your stop out, and then turns around and goes without you. I did that for a while. You know, sometimes you're right, sometimes you're
[01:40] wrong. You're basically just trading on intuition. The fix is boring and it is the entire trade really. You wait for a twominute candle to close above the pre-market high. That's the difference between the version that works and the
[01:56] version that stops you out. Not a better indicator, not a faster entry. You just wait for the level to actually break and you let the candle close before you believe it and put your money at risk. Because think about what the pre-market
[02:10] high on an inplay stock really is. It's the highest price anybody was willing to pay for that stock all morning while they had hours to sit there and think about it, look at the chart, and think about the catalyst. It's the level every
[02:25] serious buyer and seller has been staring at since they got to their desk. When the stock takes that level out on volume, that argument is settled. Until it does, you're guessing and trading inside of the pre-market range. Before
[02:41] you go looking for the trigger, there is a gate. It takes about 3 seconds. Four numbers. Prior close, where the stock finished yesterday. Yesterday's high, the pre-market high, the highest it traded before the bell, and the
[02:57] opening price, which is the very first print at 9:30. The gate is this. The opening price has to be above yesterday's high and above the prior close. both. Not one of those. If it opens below yesterday's high, this is
[03:14] not the setup. I don't care how good the news is, we're not buying it at the open. And the reason is just supply and demand. If a stock opens above yesterday's high, then every single person who bought it yesterday is green.
[03:28] There's no short-term buyers sitting there waiting to get out at break even. But if it opens below yesterday's high, you're buying into a crowd of people that might want their money back. And those people are exactly who's selling
[03:42] into your breakout. That takes about 3 seconds and it's going to kill most of your bad opening drive trades. If it passes the gate, there's one trigger and it never changes. A long entry on a twominute candle
[03:58] closing above the pre-market high on volume. Two words in there that are doing all the work. Closed and volume. Closed means close. Not touched, not wicked through. If price pokes above that level, inch or bar, my finger is
[04:12] already on the button. But I sit on my hands until that candle finishes, completes, and closes. Most of the fake outs or what we like to call stuffs you have experienced in your trade happens in the
[04:26] middle of a candle as it's forming in volume. I want a real volume expansion, three standard deviations above what's normal for that time of day based off
[04:38] the last five days. And I've got that plotted on my volume pane on Thinker Swim. Or you could use plain old cumulative arval based on the last 5 or 10 days. It's not going to make too much of a difference. And the arval must be
[04:53] over three. Price breaking a level is a claim. Volume is the evidence. Now, the Sometimes the very first candle of the day takes out the pre-market high and day takes out the pre-market high and you're in at 9:32. And to be fair, from
[05:08] what I've studied, that's really the best version. Sometimes it rides sideways for a few minutes first, and sometimes off the open, it sells off hard, flushes everyone out, and then quickly comes back and takes out that
[05:21] level just a few seconds or minutes later. I know those look and feel like three different trades. They are one trade and the trigger never changed. And one thing I have to be clear with you about
[05:36] because almost everybody teaching this glosses right over it. Um, you're not getting filled at the pre-market high. You're getting filled at the close of that candle that broke it. And that candle is usually big. And in real time,
[05:52] it could feel like a chase, which is what made this trade difficult for me to take at first. Look at this example. On Rocket Lab, the pre-market high was 8631 and the stock opened at 8604, just 27 cents apart. On paper, that looks like a
[06:09] dream riskreward scenario. But the candle that broke it closed at 8818. candle that broke it closed at 8818. So my fill is $2 above the open, not 27. So, here's the lesson. When the pre-market high is sitting right on top
[06:23] of the open, that tells you the trigger is going to come fast. It does not tell you your stop will be tight. Size off your stop, never off the level. We'll touch on why this is important in the next section when we discuss the filters
[06:38] for this opening drive setup. Okay, we have four filters. These don't find the trade. The trigger does. These keep you out of the bad opening drives. out of the bad opening drives. Filter one, the wick. This one used to
[06:53] get me almost every time I took this trade, and I want to describe it exactly because if you've traded this setup, I guarantee you've lived this. Price comes up into the pre-market high, touches it, and pushes through. So, you buy it. Uh,
[07:10] and for about six seconds, you're green on the trade. Then the candle stuffs and closes back underneath. What looked like a great breakout in the moment turns out to have been the top right before the sellers unloaded. In half the damn time
[07:27] it felt like I was the last buyer in. That's a trap. And while it's happening, it looks identical to the real thing. That's the whole problem. In the middle of the candle, you cannot tell them apart. So stop trying to the close of
[07:43] the candle is the confirmation. That's the entire filter. Nothing that happens inside the candle as it's forming. The candle has to finish above the level. Then look at it when it closes. If the upper wick is bigger than half the body,
[07:58] skip it. If it closes red, skip it. And if it never actually closed above the level, it was a false breakout. A big upper wick means somebody sold into that breakout hard enough to shove price back down before the candle
[08:13] finished. That is not strength. That is somebody unloading into your enthusiasm. Wait for the close. Let the ones that fake you out ruin someone else's morning. Filter two, a fresh catalyst. real news that released in the
[08:28] pre-market or after the close of the previous session with heavy pre-market volume behind it. Or the stock is at a level so significant that the location itself is the catalyst, a price catalyst, such as an all-time high, the
[08:46] top of a long base on the daily chart. Filter three, there's room overhead, no Filter three, there's room overhead, no obvious resistance within, say, 3 to 5%. your entry or a little bit above it, you're likely buying into somebody
[09:00] you're likely buying into somebody else's exit. Filter four, a strong market, strong sector. This is so important. The market's daily chart has important. The market's daily chart has to be above its 20 and 10 simple moving
[09:13] to be above its 20 and 10 simple moving average and ideally trending up. Not the stocks daily, the markets. That's the tape you're trading inside of and it decides whether momentum gets rewarded that morning or sold into. And really
[09:28] that morning or sold into. And really that goes for most breakouts. We want a strong market on the day itself. If SPY is red, I might pass. And the stock should be in a group that's moving at least as strong as the market,
[09:42] but ideally stronger. On a trade that lives and dies inside of 10 minutes, you want the overall market helping you, not fighting against you. Here at SMB, we fighting against you. Here at SMB, we call those market tailwinds. For risk
[09:55] management, I keep this simple. My stop goes under the low of the breakout candle. The breakout candle is the two-minute candle that closes above the pre-market high on volume. That candle is the trade. If price comes back and
[10:10] takes out the low of that candle, the breakout is not acting the way I need it to act. I do not want to sit there and start hoping it might come back after a false breakout. I'm just out at that point. And this is important. That stop
[10:25] is not always tiny. On the examples I'm going to show you, the risk is somewhere going to show you, the risk is somewhere around two and a half to 5% per share. So, you cannot size this randomly. You have to know your stop first and then
[10:37] size the trade around that risk. That is so key. Once the trade starts working, I trim it to strength. For targets, I'm usually using round numbers, prior resistance levels, or ATR. I'm not trying to predict the exact high. I'm
[10:53] just paying myself as the trade moves in my favor. It's a momentum trade. For the runner, I trail it using the first close under the 9 EMA on a two-minute chart. There is also one failure signal before the stop. If a two-minute candle closes
[11:09] back below the pre-market high after the breakout, that is a problem. That is not what I'm looking for. The pre-market high was the whole trigger. The stock breaking it. Sometimes I don't need to wait for the stop and I'll exit a bit
[11:22] early. So, the management is simple. Stop under the breakout candle, trim into strength, trail the runner, and get out if the stock closes back below the pre-market high. All right, let's look at three examples. Rocket Lab May 8th
[11:37] earnings heavy pre-market volume. There's your catalyst gate prior close There's your catalyst gate prior close 7858. Yesterday's high 8479 and it opens 7858. Yesterday's high 8479 and it opens at 8604 above both. So we have the green
[11:51] light. The pre-market high is 8631. The first twominute candle opens at 8604, dips to 8587 and blows through the level and closes at 88 on high arval on heavy volume. We have a
[12:08] real green body here in this candle. So the wick filter passes in at 8818 stop under that candle's low at 85.87 risk $2.31
[12:21] about 2.5%. I trim into strength and I'm out by 10 around 98 $99. So about four and a half times my risk. Four and a half R. It kept going to 105 and that's fine. Um that's
[12:38] not my money and that's not this trade. ARM May 21st. No news at all. And that is the point. This one is an all-time high breakout. So the location is the
[12:50] catalyst. And look at the room overhead. There isn't any. Nobody in the history of this stock has ever paid more than this. Which means there is nobody waiting to get out at break even or sell into resistance. Gate prior close 25673.
[13:08] Yesterday's high 25944. It opens at 26690. It clears both It opens at 26690. It clears both pre-market high 268.49. pre-market high 268.49. The break candle opens at 266.990, dips
[13:22] to 266, closes at 27255. That's my fill. Stop under the candle That's my fill. Stop under the candle low at 266. Risk 655 about 2 and 1.5%. Extension at the time of my sell about 6%.
[13:41] And same plan, we're trimming into strength and it closes the day at 298. But I'm just worried about that opening momentum. That is the trade I'm looking momentum. That is the trade I'm looking for. Next, we're going to look at RGTI
[13:53] on May 22nd. Sector news. The Trump administration was reported to be awarding $2 billion to nine quantum companies through the to nine quantum companies through the chips act. Fresh and it lit up the
[14:06] entire quantum group, not just this one ticker. Gate prior close 2204. ticker. Gate prior close 2204. Yesterday's high 2210, opens at 2296, clears both of those. Pre-market high 2357.
[14:22] 2357. The break candle opens at 2296, dips to 2266, closes at 2380. I'm buying at 2380. Stop is 2266.
[14:34] 2380. Stop is 2266. Risk a$114. That's almost 5%. The widest stop by a mile. So this is the one that I would size the smallest. It's doing about four arvall and it's doing the most volume out of all these examples
[14:49] that we just touched on. Same plan. We're trimming into strength about an ATR from the open and into whole numbers. So we have three stocks, an earnings gap, an all-time high, and a sector news catalyst. Three completely
[15:04] different stories. same gate, same trigger, same stop, and the same exits. That's the whole point of running this mechanically. The story changes every single morning, but the trade does not. So, here's the whole setup. The trade is
[15:20] the pre-market highbreak, not the gap, not the news, not the first green candle at the open before the bell. I want a strong market, a strong sector, a real strong market, a strong sector, a real catalyst or strong technical catalyst
[15:34] such as an all-time high break. And there should be room overhead at 9:30. The first question is simple. Did the stock open above yesterday's high and above the prior close? If not, no opening drive trade. If yes, I mark the
[15:49] pre-market high and wait. The trigger is a two-minute candle. Closing above the pre-market high on volume. Not poking above it, not wicking through it, not in the middle of the candle. Closing above it.
[16:04] Then I check the candle. I want a full green body. No upper wick. If the candle looks like a rejection, I'm not going to chase it. My entry is the close of that candle. My stop is under the low of that candle. From there, I trim it to
[16:20] strength. often using ATR and I'll trail a runner using the first two-minute close under the 9 EMA. And if price closes back below that pre-market high quickly after I'm in the trade, I'll get out. That is the mechanical
[16:35] model for trading this setup. The reason I like it because it removes any guesswork from the fastest part of the day. I want to trade the fastest part of the day as mechanically as I could. I'm not trying to predict whether the stock
[16:49] is going to rip at 9:30 or close on highs at the end of the day. I'm waiting for one level, one close, one confirmation, and I'm being mechanical. video, remember this. The trade is the pre-market high break. Everything else
[17:04] is filters and management. Opening drives move fast. Paper trade the setup at first or size it small enough that being wrong feels boring. So, you're an active trader, not doing as well as you want, not doing as well as you deserve,
[17:19] and you just can't figure out why you can't become profitable no matter how hard you try. Well, let me show you why. This is your competition. The traders in this room, this room right here is full of elite traders, some of whom are
[17:33] making seven and even eight figures a year. In fact, our top guys have made nearly 20 million each in net trading profits in a single year. Let's head to my office so I can share more. So, you're probably used to seeing videos of
[17:47] you're probably used to seeing videos of lavish trader lifestyles, trading gurus trading off of a laptop for an hour a day, heck, maybe even 15 minutes a day, and then them relaxing on some secluded beach for the rest of the day. Well, all
[18:01] I can tell you is that our traders train like proathletes. They live and breathe the markets and are continually working on their trading skills. Because at our firm, that's what we found it really takes to make it in this game. I'm Mike
[18:17] partner of SMB Capital, one of the world's top proprietary trading firms located in Midtown Manhattan. And we're always looking for trading talent to hire and develop. And not just to trade inhouse on our desk, but also to trade
[18:33] from their own home entirely using our firm's capital. And we have numerous traders doing just that, allowing them to make upwards of seven figures trading the firm's capital without risking their own money. But to even get a shot at
[18:47] something like that, you need to have the right training. That's why we're doing a new free online presentation in which we share how you can get an interview with SMB to become an in-house or remote trader trading firm capital
[19:02] without risking yours and gaining access to all of our firm's coaching and resources. And the best part, you don't have to be a profitable trader yet. In fact, we prefer to mold profitable traders with our methods and our
[19:17] techniques. That's why we have just three simple criteria that can earn anyone an interview. We're looking for highly ambitious and determined traders who fit our culture first and foremost. So, if you believe that could be you,
[19:31] sign up for the free 1-hour online presentation by clicking the link that's in your top right corner of your screen now.

⚡ Saved you 0h 19m reading this? Transcribe any YouTube video for free — no signup needed.