

Why 1-Minute Charts Are Dangerous
60sThe speaker warns about the dangers of 1-minute charts and reveals that over half of entries are false, creating curiosity and fear of missing out.
▶ Play Clip"The title promises a strategy for 2-minute charts, and the video delivers exactly that, though with some rambling and personal anecdotes."
The video is a practical day trading guide focused on the 1-2 minute chart, presented by a trader who shares his personal journey and strategies. He explains why he prefers these fast timeframes, the challenges of false signals, and demonstrates a moving average crossover setup with specific entry, stop loss, and target rules.
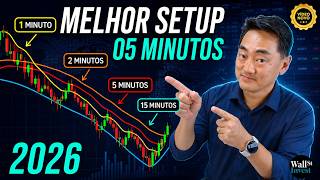
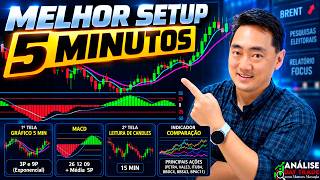
The video is part of a series on best strategies for different timeframes. Today's focus is on 1-2 minute charts, which are fast and erratic, generating many false signals.
Each candle forms in one minute, leading to a zigzag pattern and noise. This noise creates false entries; out of 20 intersections, more than half are false, with only 6-7 being genuine.
The trader uses the 1-minute chart but keeps a 10-minute chart nearby for peace of mind. The 10-minute chart shows strong candles that confirm the trade, reducing anxiety.
In 2017, his partner Júlio taught him mean reversion scalping on a 1-minute chart, leading to 20-40 entries per day. He later migrated to Renko charts and other strategies, eventually settling on 1-2 minute charts.
For students, he recommends 2-minute charts because 1-minute is too fast and generates many false starts. The 2-minute chart is cheaper but more relaxed, and traders can test 2, 3, 4, or 5 minutes to find their preference.
Fast charts provide many entry points, but also many false entries. To filter these, he uses multiple indicators (MACD, moving averages, VAP, support/resistance, high/low, volume) for confirmation.
Smaller timeframes offer cheaper technical stop losses. On 5-minute charts, stops could cost 55-85 reais, but on 1-2 minute charts they are more affordable, fitting his daily loss limit of R$100.
The primary strategy is a moving average crossover: 5-period exponential (blue) and 21-period exponential (red), both on close. This is a 'cautious' crossover for longer-term operations.
For 1-2 minute charts, use cautious crossovers like 5/21, 9/21, or 7/26. More aggressive crossovers (5/9) are for 1-minute charts. The key is the trigger candle.
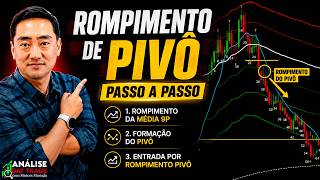
A power candle (large body, small wicks) is essential for entry. For a buy, it should be green; for a sell, red. This candle is defined as the reference candle.
Entry is just past the high (for buys) or low (for sells) of the reference candle. Stop loss is below the low (for buys) or above the high (for sells). Target is the next support/resistance level.
Tomorrow's lesson will cover mean reversion on small timeframes. Today's mini-dollar market was sideways, with a small gap up and a 40-point move at 11 am, but overall unpredictable.
For pullbacks, he uses Renko 3R charts for the dollar. These are based on price change, not time, and provide quick trades, but can be deceptive regarding time elapsed.
The video provides a practical guide to trading on 1-2 minute charts, emphasizing the moving average crossover with power candle confirmation and technical stop losses. The trader stresses the importance of filtering false signals and adapting timeframes to personal style.
False Entry Problem
Quantifies the challenge of fast timeframes: more than half of signals are false.
00:29Dual Timeframe Technique
Using a higher timeframe for confirmation reduces anxiety and improves confidence.
01:35Cost-Effective Stop Losses
Smaller timeframes allow for cheaper technical stops, aligning with risk management.
05:11Cautious vs. Aggressive Crossovers
Provides specific parameter choices based on timeframe, a practical rule for traders.
09:01Reference Candle Method
Clear, actionable entry/stop/target rules based on a defined candle.
10:17[00:02] series "Best strategy, best setup for the time frame," right? We started 10 minutes, which is a timeframe I really like , then to 15 minutes with a wonderful candlestick reading strategy, and today we're using smaller timeframes, right? Those who
[00:17] follow me know that I really enjoy trading on the one-minute chart. Many people speak ill of the Japanese man who doesn't even have a minute to speak ill of, what a disgrace. That's messed up, it's dangerous. Yes, it is dangerous. One minute is a very
[00:29] fast graph, isn't it? Because each candle forms in one minute. So the graph quickly really crazy zigzag pattern, right? And this zigzagging generates a lot of noise, and this
[00:41] noise generates false input. That's the problem. In a small timeframe of 1 minute, I have many entries throughout the day. For example, this intersection 521 will give me 20 intersections during the day, depending on the day. But look, out of
[00:55] the 20 entries, more than half are lies. Few entries, only six or seven, are real entries, they are genuine entries. The rest is a false entry; he crosses, buys, you buy, and he stops you. To filter out this type of
[01:09] error, we use several techniques. There are several classes I teach there on how to filter out incorrect entries from the moving average crossover. But So, 1-minute or 2- minute charts are very fast charts, where
[01:23] each candle represents 1 minute or 2 minutes. So, this graph forms quickly , but the graph is very erratic, so it creates a certain amount of anxiety. But then, why would I oppose it? So let's first explain why
[01:35] 1-minute timeframe. It's not just me, right? If you search for many YouTubers, several of them are trending within a minute, okay? So, look, I trade on the one-minute timeframe, but I always keep trade on the one-minute timeframe, but I always keep the 10-minute chart nearby, okay? So, this is a
[01:49] technique that I started implementing, and it has helped me a lot because trading with just one minute used to make me very anxious, and the 10 minutes I found when I was only trading with 10 or 5 minutes, I found it very slow because I always traded with minutes.
[02:02] So the 10-point chart gives me that peace of mind because I'm seeing a crazy zigzag pattern, but here at 10 I'm seeing continuous strong candles giving me confidence in the trade. Did you watch yesterday's class where I talked about candlesticks? Okay, but let
[02:16] small timeframe? Because back in my early days, in 2017, you know? My partner, Júlio, started teaching me, and he was trading mean reversion, a small-scale scalping strategy, on a 1-minute chart. So, that was the setup he taught me, right? Ah, put the average at seven
[02:31] taught me, right? Ah, put the average at seven here, it's 100 points away from the average, you buy, it's moved upwards, you sell, it exits at the average. A 1-minute chart generates a whole day trading, making 20, 40 entries a day, and I thought that was normal. That's
[02:44] that I later switched to a different chart. I migrated to the Renco chart. But instead of using a 15R or 12R chart, I went with a 5R strategy from some crazy American guy who taught me this thing called shock waves. And it
[02:59] was really cool, a setup that I kept for a year, okay? But then I always traded fast timeframes and I got very used to it due to my anxiety, seeing that 5-minute candle that wasn't moving. And then I ended up joining, I ended up
[03:12] liking the time graphics there and I stayed in that time graphics for years. It was only after that time graphics for years. It was only after I started experimenting with other timeframes and mixing everything up that I now trade on the one-minute chart and leave the
[03:26] ten-minute one aside. For my students, I've only been showing two- minute timeframes for over a year and a half. Because in one minute, guys, he's really fast, he's really crazy, and he makes a lot of false starts, right? So there have been a lot of fake entries for students. Then I changed it
[03:40] to 2 minutes. The 2-minute option is just as cheap, but it's a little more relaxed. So the tip is, you can test number two, test number three, test number four, and go all the way to number five. There's no set rule, as we say, right? The
[03:57] books suggest a 5-minute chart, but I believe that each person should choose the timeframe that best suits their trading style. I'm crazy, I like the 2
[04:09] minutes, the minute, okay? So today, what's the best strategy for trading on a 2-minute chart? 1 minute. Since the 1-2 minute chart is a fast chart, it gives me many entry points. That 's the big advantage. The problem is that a
[04:22] quick graph gives a lot of false entries. That's why I work with so many indicators, right? For those who see my layout here, let's take a look, shall we? The guy puts in MACD, moving averages, VAP,
[04:34] support, resistance, a high/low indicator, trading volume, two charts, a mess, okay? But then, why do I work with so many tools? Because I need confirmation. I can't enter a single intersection
[04:46] . Now, if I have a crossover, a strong ignition candle, confirming that entry, I have an exhaustion region where the price will start to rise, I have the reading of the MAID, the Highow, the
[04:58] trading volume, confirming that entry. Oops. Then I'll go in. It's a way for me to filter out incorrect entries. So for those who trade on small 1-2 minute charts, you have to create a strategy where you have confirmations. And the big
[05:11] smaller timeframe was one of the reasons I ended up choosing it, because the technical stop loss ends up being cheaper. Of course, sometimes I get screwed over, I mean, I get screwed over quite often, just like everyone else, okay? Well, one thing
[05:25] I learned early on is to always place stop losses at a technical point. The problem was that during those 5 minutes, the technical point became very expensive, costing 55 or 85 reais, and I only wanted to lose R$100 that day. So it didn't fit me. That's why
[05:39] lower timeframe, and that's where I had cheaper, more technically sound stop-loss orders. Of course, many times it didn't work out either, okay? But everything is fine. I adjusted and went on with my life without complaining. Adjust, correct, and life goes on. A lot of
[05:54] Let me come back here. I'm talking too much today. 2 minutes or 1 minute. Well, strategies that I really like. The first one, for longer-term operations,
[06:06] is the famous moving average crossover. Let me grab a clean graph here. Okay? So, like this, look. Ah, a lot of people follow me here, but, look, classic setup, crossing, it's the classic of classics, right? So here, and I like to trade
[06:20] on a small chart. Well, I operate on the one, but I've been recommending the two quite a bit to my students, you know? So, first thing here, let me remove the VAPs to make the graph cleaner, okay? Let me remove the VAP here, to
[06:33] clean up the graph. Oops, VAP is missing here. Okay, right? Oh, I'm going, I'm already on the 2-minute chart here, look. 2 minutes. Oh, there aren't even 2 minutes here, you pain in the ass. No problem. You come here, type two, it already appeared here, look, 2 minutes, okay? Three.
[06:49] Just type the number three on the keyboard. Ready. Each candle lasts 2 minutes. Okay, so I'm going to add two moving averages. Insert a moving average, a five-period moving average, a five-period short moving average, and I'll add a second 21-period moving average.
[07:04] This is the famous cautious crossing, okay? Where one average is small and the other average is 20. It's an average average, okay? Let's go. Let's set up this one now, this average is very close to the price here, right next
[07:18] to the price. I'll select it and it will come here to properties. Here, the average price that's closest to the current price is the short-term average, right? So, five periods. Like, I'll leave exponential here, displacement, I don't mess with it, time, I don't
[07:31] mess with it. In terms of appearance, let's leave it in blue, the smaller one always in blue and work with closing, which is better. So, it's a five- period exponential moving average at the close. OK? Okay, let's set up the
[07:46] longer average here now. We click here. This is 21, like, change it to exponential. Period is a period of movement, I don't mess with it. Time, I don't mess with it. Regarding appearance, let's leave it in red so I have the contrast of the colors and thickness of two. And values,
[08:01] closing. OK. Ready. This is the crossing setup. Look at what's happening today, right? At 9 AM, at 9:20 he made a buy cross, right? Let's say you bought here, and managed to get
[08:15] here, R$ 25, R$ 30 in this transaction. Quick operation, okay? First operation of the day, leaving with only twenty bucks to get a little fat removed. Then I crossed over here, look. If it had been a minute, he would have crossed right here. Since I was on the
[08:29] second floor, he didn't cross and only came to cross here at 9:58. It crossed, right? I'll wait here and then I'll go in sold here, look. And there you have it, the price came all the way down here. I got R$ here. Then he messed it up a bit, paved it up a bit , but when he crossed it, he still made a
[08:46] move here, look. So he provides several entry points, but the important cross-referencing is to perform longer operations, okay? So the setup I recommend for short timeframes is what I use. 2-minute cautious moving average crossover, 521. In the
[09:01] minute timeframe, I explained that this can use a more aggressive crossover, 5 and 9, but if you are going to work with a small timeframe, 1, 2 or even 3 minutes, work with a small timeframe, 1, 2 or even 3 minutes, work with a cautious crossover. 521, 921, 926,
[09:17] 726. These are several classic crosses, and basically they're all the same, okay? So, the important thing about the intersection, folks, is the trigger, the ignition, okay? In this case entry triggers. Let me see if there's a better intersection around here. Let's take yesterday as an example
[09:33] . That was a nice one, from yesterday, okay? Look at yesterday here. The price was sideways. He came by at 2 PM to make a purchase. This candle here, this candle # 157, is a power candle, a
[09:48] body candle, where the body is large and the upper/lower wick is small. So, when it crosses the averages, I need to have that strength candle. If it's a candle, if it's an ascent, I need a green candle. If it were a sale, a
[10:03] red candle, okay? And this spark plug, or ignition spark plug, or elephant spark plug, will give me the trigger to start the ignition. So then I define this candle as a reference candle, just like in yesterday's lesson. Anyone who attended yesterday's class will
[10:17] recognize me here. Def as a reference. And there I have, look, the entrance. Let me zoom in here. The entry point is here, a little past the high of the reference candle. Where is the stop loss ? Below the low of the
[10:32] reference candle. And my target might be at the next support/resistance level. Since I must be a band that would more or less get here, look, and get R$ 96 in this lovely operation here. For those who left here already, look, getting 30 bucks
[10:47] was also great. Right? So, that 's the cool thing. It crossed over, look how beautiful 's the cool thing. It crossed over, look how beautiful this is! Oh, it's midday, what do I need ? A red power candle . Body. It doesn't have to be a
[11:01] marubozô candle, a body candle is fine, okay? A candle of strength and continuity. So, look, where my sell entry point is is here, a little bit after the low of the reference price. Where is my stop loss? Above the maximum of the reference range. And
[11:16] price was a little delayed, but then it came down to R$ 84. Look here again. Look here again. Cruzou buys the 68 candle here, look.
[11:29] Sometimes this power candle is one candle before or one candle after the crossing. It's up to you, based on your experience, to say: "I think it's possible to enter earlier or later," okay? So I always go in. Oh, candle 68 here, oh. This
[11:43] reference candle, my stop loss is below the reference point, right? And then the target picked up another R$100. Yesterday was fun trading at the intersection, especially at a quick intersection, a 2-minute intersection, right? So there's a tip for you. The setup I really
[11:58] like is the moving average crossover. Tomorrow in the fifth lesson, I will show the small time frame chart, 1-2 minutes, which involves mean reversion operations. This is an operation I talk about quite often when the market is moving sideways. So stay
[12:12] a look at the mini-dollar now. The mini dollar opened with a small gap up here of eight points. Super lateral in the morning. Only at 11 am did it make a movement here of 40, look, 40 points, going from the low to the
[12:25] high of 46 points, and now in the afternoon the market is more sideways, okay? So, the movement of the day was this climb here, right? Let's take this, look, the moving look at these 5 minutes. Nothing came of it, he crossed paths with others, but didn't get through.
[12:40] Take two minutes here, okay? Also, since the market was a bit more unpredictable today, it didn't work cross a few times, but in a sideways market, you don't trade moving average crossovers, okay? same small time frame chart, mainly from the small time frame chart.
[12:53] OK. Let's go straight to the pullback here. Pulback 3R in dollars. For the dollar, we use a smaller R, okay? Shock waves. Look here. Starting here at 11 AM, which break through VAP. There you go. He managed to grab these little appetizers here, look. Let me grab this
[13:08] here. That first 4 minutes, eight points. This second one here, look, 5 minutes. This third one here, 4 minutes. This one , right? Because Renko, oh, this one's broken. And then he gave more tickets. So, these weren't good entries, they
[13:23] RENCO chart is based on price change, not time. So sometimes she deceives you. Ah, it made a quick entry here, but when you go to check, when you go to measure here, it's been half an hour. That's not cool. Not here. Quick little trades, which is the
[13:36] purpose of pullbacks in fast timeframes, OK? So, Renco 3R, in the case of the thumbs up. This is the easiest way for you to help me. If you're enjoying our content, please give our videos a like, okay? Like, share, leave
[13:50] your comment. Big hug and see you tomorrow, Thursday, which is Wednesday, sorry, see you tomorrow, Wednesday, at 8 am live, but it will be closed to those who have registered. Go there and sign up.
⚡ Saved you 0h 14m reading this? Transcribe any YouTube video for free — no signup needed.