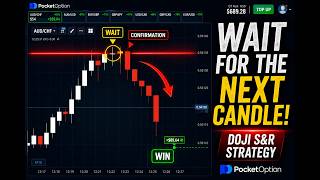

Why Your Trades Fail: The Doji Truth
60sReveals a common trader pitfall and explains the doji's real meaning, making viewers question their own strategy.
▶ Play Clip"Delivers a clear, actionable strategy with live examples, but the title oversells the 'ignored' aspect; the doji is a well-known pattern."
This video presents a price action trading strategy for binary options on Pocket Option, centered on the doji candlestick pattern at key support and resistance levels. The presenter, Sam, explains the strategy's logic, provides exact entry rules for the 15-second timeframe with a 1-minute expiry, and demonstrates live trades, including both a loss and a win, to emphasize the importance of discipline and patience.
The strategy uses a doji candle at support/resistance levels on a 15-second chart with a 1-minute expiry on Pocket Option. It aims for clean entries without complex indicators.
A doji forms when buyers and sellers are in equilibrium, with a tiny body and wicks on both sides. It signals indecision, but at a key level, it indicates a potential reversal or breakout.
Mark horizontal lines at recent swing highs and lows. Look for levels tested at least 2-3 times; the more touches, the stronger the level. If no clear levels exist, move to another asset.
Price touches support, a doji forms, and the next 15-second candle must close green. Enter a buy with a 1-minute expiry immediately after the green close.
Price touches resistance, a doji forms, and the next 15-second candle must close red. Enter a sell with a 1-minute expiry immediately after the red close.
Dojis in the middle of the chart with no nearby level are meaningless. Only trade dojis at key support/resistance levels.
Do not enter on the doji itself. Wait for the next candle to confirm the direction. The doji is the signal, the next candle is the confirmation.
Avoid trading during low volatility periods. Focus on the London and New York session overlap for cleaner moves and respected levels.
After a loss, stay calm and wait for the next clean setup. Emotional discipline is the real edge; revenge trading destroys accounts.
A sell trade at resistance with a red confirmation candle resulted in a loss as buyers reversed the move. The setup was valid but the market didn't cooperate, highlighting that losses are part of the game.
A sell trade at resistance with a red confirmation candle resulted in a profit as price dropped cleanly away from the level. Textbook execution.
A buy trade at support with a green confirmation candle resulted in a profit as price bounced off the level. The trade had some wobble but held, emphasizing trust in the setup.
What does a doji candle indicate?
It indicates indecision, with buyers and sellers in a tug-of-war; the open and close are nearly identical.
01:27
When is a doji candle significant in this strategy?
When it forms exactly at a key support or resistance level.
01:40
What is the confirmation for a buy trade?
The next 15-second candle after the doji must close green.
03:14
What is the confirmation for a sell trade?
The next 15-second candle after the doji must close red.
03:42
How many times should a level be tested to be considered strong?
At least two or three times.
02:22
What is the recommended time frame and expiry for this strategy?
15-second candles with a 1-minute expiry.
03:00
What is the first common mistake mentioned?
Taking dojis in the middle of the chart with no level nearby.
04:12
What is the second common mistake?
Entering on the doji itself before confirmation.
04:29
What is the third common mistake?
Trading during flat, dead market hours with low volatility.
04:42
What is the fourth common mistake?
Revenge trading after a loss.
04:55
What session overlap does the presenter recommend for trading?
The London and New York session overlap.
04:42
Doji as a tug-of-war
Explains the core logic of the doji pattern in simple terms, making it accessible to beginners.
01:27Level strength from multiple tests
Emphasizes the importance of level validation, a key concept in price action trading.
02:22Confirmation candle rule
Provides a clear, executable rule that prevents premature entries and improves trade quality.
03:14Emotional discipline as the real edge
Highlights that psychological control is more important than the strategy itself, a crucial lesson for traders.
04:55Losses are part of the game
Honestly acknowledges that even valid setups can lose, setting realistic expectations for viewers.
07:08[00:01] chart could give you some of the cleanest entries on Pocket Option? No fancy indicators, no crowded charts, just price action, key levels, and one single candle that screams, "The market has no idea what to do next." Welcome
[00:17] back to Sam Trading Strategies. Today, I'm walking you through my doji at support and resistance strategy, a setup I personally use on the 15-second time frame with a 1-minute expiry on Pocket Option. And trust me, once you see how
[00:31] this works, you're going to wonder why you ever made trading more complicated than this. But real quick, before we dive in, trading binary options carries real risk. You can lose money. I'm not here promising profits or guaranteeing
[00:44] I'm sharing a strategy that has worked for me in my own testing, and I want you to do the same. Start on a demo account, watch how it behaves, get comfortable live. All right. If you're finding value here,
[00:59] drop a like, hit subscribe, and turn on the bell. It genuinely helps this channel grow. Now, let's get into it. Before I show you the exact rules, I want you to understand why this strategy works. Because here's the thing. If you
[01:13] setup, the first time you take three losses in a row, you'll quit on it. And that's how most traders miss out on perfectly good strategies. So, here's the simple truth about a doji candle. It forms when buyers and sellers
[01:27] are in a complete tug-of-war. Neither side wins. The open and close are nearly identical. The body is tiny, and those wicks on both sides, they're telling you that price tried to move in both directions and got pushed right back.
[01:40] Now, a doji sitting in the middle of your chart with nothing around it, that means absolutely nothing. Ignore it completely. But a doji that forms exactly at a key support or resistance level, that's where it gets interesting.
[01:53] That's the market literally pausing at a critical zone and asking, "Do we break through here or do we bounce?" And the very next candle that answers the question. And that answer is your trade.
[02:07] a doji, you need your support and resistance levels marked on the chart. This is non-negotiable. Don't skip it. Look at recent swing highs and swing lows. A swing high is a peak where price reversed and came back down. A swing low
[02:22] is a bottom where price reversed and pushed back up. Draw a clean horizontal line through those points. Personally, I look for levels where price has reacted at least two or three times. Because here's the thing, the more times price
[02:35] has respected a level, the stronger that level becomes. Those are the zones where serious money is sitting. And those are the only zones where this strategy has any real edge. And if you open a chart and you can't find clear, obvious
[02:47] and you can't find clear, obvious levels, close it. Move to another asset. Patience at this stage will save you from so many bad trades. I promise you that. All right. Now, here are the exact entry rules. Pay close attention here
[03:00] because the precision is what makes this work. Set your candle time frame to 15 seconds. Your expiry is 1 minute. So, each trade has exactly four candles to play out. First setup, the buy trade. Price drops down and touches your
[03:14] support level. Right at that level, a doji forms. Tiny body, wicks on both doji forms. Tiny body, wicks on both sides. Now, don't jump in yet. You wait. The very next 15-second candle has to close green. That green candle is your
[03:28] confirmation that buyers showed up and took control. The moment it closes green, you enter a buy with a 1-minute expiry. Second setup, the sell trade. Price pushes up into your resistance level. A doji prints right at that
[03:42] level. Same thing. You wait. The next 15-second candle has to close red. That confirms sellers stepped in. The The it closes red, you enter a sell with a 1-minute expiry. That's the whole setup. Two trades, mirror images of each other,
[03:58] Now, here's the part most traders skip, and it's honestly more important than the entry rules themselves. Mistake one, taking dojis in the middle of the chart with no level nearby. There's no context, there's no edge. If it's not at
[04:12] a level, it doesn't count. Move on. Mistake two, entering on the doji itself before confirmation. I know it's tempting. The doji looks perfect. You doji is just the signal. The next candle is the confirmation.
[04:29] Without it, you're not trading a strategy, you're guessing. Mistake three, trading during flat, dead market hours. When volatility is low, price just drifts sideways, and your levels become
[04:42] meaningless. I personally focus on the London and New York session overlap. That's when these key levels actually get respected and moves are clean. And mistake four, revenge trading after a loss.
[04:55] This strategy will lose sometimes. Every strategy does. If you can't sit calmly after a loss and wait for the next clean setup, no strategy in the world is going to save your account. That emotional discipline, that's honestly the real
[05:09] edge. Now, before we get to the live chart examples, I've put together a free PDF guide for this exact strategy. It has the full buy checklist, the full sell checklist, and a quick reference entry card you can keep right next to
[05:22] your screen while you trade. The link is in the description below. Go grab it everything coming up. All right, let's get into the charts. All right, here we are on the live chart, and I want to be up front with you. This channel shows
[05:36] real trades, wins and losses both. So, let's walk through this one together. Look at this chart. See that resistance zone at the top? Price already pushed up hard into to level earlier and got rejected. That zone is now acting as a
[05:48] ceiling. Price made another bullish run into it and right at the top the candle started getting smaller. Wicks appeared on both sides and the momentum completely faded. That's exactly the structure this strategy looks for. A
[06:00] clear resistance zone, tested, respected and showing weakness right at the top. I watched price stall at that level. The candle body was tiny. Price tried to push higher and failed and the very next candle closed red. Confirmation done.
[06:14] candle closed red. Confirmation done. Sell trade placed. Expiry 1 minute. And now we wait. Now here's the part most YouTube channels skip. They only show perfect entries. I want you to see what actually happens inside a live trade
[06:26] test you the most. Initially things look good. Red candles coming in, price dropping, sellers in control. It genuinely feels like this trade is working. Most beginners start thinking, "Yeah, this one's in the bag."
[06:41] And that's exactly when the market reminds you who's in charge. Then a green candle forms, then another. Price stops dropping and recovers. Not just a little, but with real momentum. Buyers step in hard and push price right back
[06:55] up toward that resistance zone we sold from. This is short expiry trading. Anything can happen in 60 seconds. The setup was valid, the logic was correct, but the market doesn't owe you a win just because your analysis was
[07:08] a win just because your analysis was right. The timer hits zero. Price is not where we need it and we already know how this ends. Trade closed. Full loss. And honestly, that's okay. I showed you this trade on purpose
[07:23] because this channel is not a highlight reel. Every rule of this strategy was followed correctly. The resistance level was real, the sell signal was there, the confirmation candle was red. But inside that 1 minute, buyers came back strong
[07:36] and reversed it against us. That happens. It's part of this game. One loss means nothing. One loss followed by revenge trading, that's where accounts get destroyed. I took the loss, stayed calm, and moved on. Now, let's reset our
[07:49] focus and go find the next perfect setup as per our strategy because clean patient enough to wait for them. All right, back on the live chart and this time, watch this setup very carefully because this is exactly what we've been
[08:04] talking about. Look at what price just did. It pushed up aggressively into a resistance zone that had already rejected price before. And right at that level, the momentum dies. The candle body gets tiny. Price tried to go
[08:17] higher, couldn't hold it, and the very next candle closed red. That is the signal. That is the confirmation. Resistance zone, doji structure, red Resistance zone, doji structure, red confirmation candle, every box ticked.
[08:31] Sell trade placed. Expiry, 1 minute. designed. Now, watch what happens next. And this is the satisfying part. The moment that trade goes live, sellers
[08:45] take complete control. Red candle after red candle, price is dropping cleanly away from that resistance zone with zero hesitation. No recovery attempt, no green candles fighting back, just pure clean selling pressure driving price in
[08:58] exactly the direction we called. This is what a textbook setup looks like when it plays out the right way. The structure was clean, the entry was clean, and the market is responding exactly the way the logic said it should. With a few seconds
[09:11] left on the timer, price is sitting well below our entry, and the trade is firmly in profit. Trade closed. Green result. Profit confirmed. Now, let's keep the momentum going and find the next perfect setup as per our
[09:25] strategy because when the chart gives you clarity, you take it. Look at what price just did. It came down hard. A strong bearish move that pushed price all the way into a support zone that had already held price before, and right at
[09:38] that level, something changed. The selling slowed down completely. The candle body got tiny, wicks appeared on both sides, and you could literally see the market pausing. Buyers and sellers both unsure of the next move.
[09:52] support. That is the signal this strategy is built around, but I didn't enter on the doji. I waited because that's the rule, and the very next candle closed green. Buyers confirmed, support held. Every single condition of
[10:06] this strategy was met, and that is when the buy trade went in. Expiry, 1 minute. happens from the moment that trade goes live. Price bounces right off that support zone, exactly the way we read it. The green candles start coming in,
[10:21] buyers are stepping up, and the momentum is clearly shifting from the sellers who were in control earlier. The chart is doing exactly what the structure said it should do, respecting that support level and pushing back up.
[10:33] Now I won't lie to you. It's not a perfectly straight lineup. There are a couple of red candles mixed in, price wobbles slightly, and for a moment it feels like it could go either way. This is completely normal in short
[10:45] expiry trading, and it's exactly why emotional discipline matters. You don't panic, you don't exit early, you trust the setup and let the trade breathe. Trade closed, green result, profit confirmed, and the account balance
[10:58] reflects it immediately. This trade worked because the support zone was real, the doji signal was clean, the confirmation candle was green, and the entry was taken with zero hesitation. No overthinking, no second-guessing, just
[11:11] the strategy executed properly. That is the entire system, simple, honest, and video all the way to the end, I genuinely appreciate you. It tells me properly and not just looking for shortcuts. So do me a favor, hit that
[11:26] like button right now, subscribe to Sam Trading Strategies if you you already, and turn on the bell so you never miss a new strategy video. I'll be back very soon with more live chart breakdowns, more honest trade walkthroughs, wins and
[11:39] losses both, and more strategies built for real traders who want to grow the right way. Until next time, stay patient, stay disciplined, and only take the setups your strategy tells you to take. I'll see you in the next one.




⚡ Saved you 0h 11m reading this? Transcribe any YouTube video for free — no signup needed.