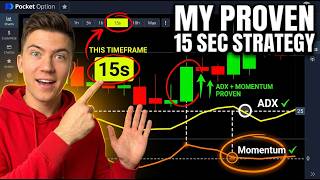

From $29 to $756: My Exact Strategy
60sThe dramatic transformation from a small starting amount to a large profit immediately grabs attention and promises a valuable secret.
▶ Play Clip"The title promises a proven strategy, and the video delivers a clear, repeatable method with real examples, though the 'proven' claim is based on a single session."
This video presents a trading strategy for the Pocket Option platform, using ADX and momentum indicators on a 15-second candlestick chart. The creator demonstrates five consecutive trades, turning $29 into $756, while highlighting common beginner mistakes and the importance of a repeatable process.
Using classic Japanese candlesticks with a 15-second timeframe. ADX indicator: DI length 10, main ADX line off, plus D green (thickness 2), minus D red (thickness 2). Momentum indicator: period 7, main line as line (thickness 2, full opacity), up line turquoise.
Sell trade for $29 with 1-minute expiration. ADX green line crossing below red indicates sellers took control. Momentum turquoise line crossing below 100 baseline confirms downtrend strength. Both signals align, so entry is valid.
Beginners often mix up which ADX line is which. Green line (plus D) represents buyers; red line (minus D) represents sellers. Green on top means market moving up, red on top means down. Color coding helps avoid opposite trades.
After a buy trade, price dipped, tempting a counter-trade. The creator emphasizes not opening a second trade in the opposite direction. The signal remains valid if ADX and momentum haven't flipped. Waiting resulted in $98 profit.
A sharp crossover (green slicing through red at a steep angle) indicates stronger momentum. Shallow crossovers suggest sluggish moves. This detail helps pick the best entries, not just correct ones.
Sell trade for $394, 1-minute expiration. Red crossed green, momentum below 100, sharp crossover. Profit $362, total balance $756. Three takeaways: ADX shows who's in charge, momentum confirms pivot, never enter without both signals; never revenge trade; pay attention to crossover angle.
The strategy relies on dual confirmation from ADX and momentum, with a focus on discipline and reading crossover details. The creator emphasizes that a repeatable process and avoiding emotional reactions are key to consistent wins.
What are the two indicators used in this strategy?
ADX and Momentum.
00:46
What does the green line on ADX represent?
The buyers (plus D).
03:50
What does the red line on ADX represent?
The sellers (minus D).
03:50
What is the recommended ADX DI length?
10.
01:01
What is the recommended momentum period?
7.
01:17
What does a sharp crossover on ADX indicate?
Stronger momentum and a more powerful move.
06:44
What is the common mistake beginners make with ADX?
Mixing up which line is which, leading to opposite trades.
03:18
What should you do if price drops after a valid entry?
Do nothing; wait for the signal to expire if ADX and momentum haven't flipped.
05:30
What are the three key takeaways from the video?
ADX shows who's in charge, momentum confirms the pivot, never enter without both signals; never revenge trade; pay attention to crossover angle.
08:35
Dual Confirmation Principle
Explains the core mechanic: ADX shows who controls the market, momentum confirms when control shifted, and both must align for entry.
02:44ADX Line Identification
Highlights a common beginner error and provides a simple color-coding solution to avoid trading in the wrong direction.
03:50Avoiding Revenge Trading
Demonstrates the importance of discipline and not opening counter-trades, which can guarantee losses.
05:30Crossover Sharpness as a Signal
Introduces a nuanced detail that separates beginners from skilled traders, improving entry quality.
06:44Three Key Takeaways
Summarizes the entire strategy into actionable rules for consistent trading.
08:35[00:07] stronger, the buyers or the sellers. The second shows the exact second that power >> [clears throat] >> Sounds simple? That's because it is. But for some reason, right [music] during the third trade, I ran into the
[00:21] during the third trade, I ran into the situation that breaks a habit of wiping out every second [music] beginner. $29 at the start and $756 at the start and $756 at the end. Five trades, zero stress.
[00:34] Make sure you stick around for the fourth trade because that's where everything will click. Before we begin, don't forget to subscribe to the channel and like this video. I'm Steven. Let's get into it. First things first, let's
[00:46] get our tools ready to go. I'm using classic Japanese candlesticks with 15 second time frame. Next, head over to the indicators tab and select ADX and momentum. We'll set up ADX first. Set DI length to
[01:01] 10. In the style settings, turn over the main ADX line. Make plus D green with a line thickness of two. Make minus D red with a line thickness of two. Then save changes. Now, let's set up momentum indicator.
[01:17] Set the period to seven. In the style settings for the main line, change the plot type to line, thickness [music] to two, and turn the opacity all the way to the right. Make the up line turquoise and then save the changes. [music]
[01:30] That's it. Our indicators are ready to go. Bro, if you trade on your phone, [music] You know what separates the people making money from the ones wiping out their accounts? A clear, repeatable process. In my Telegram group, I share
[01:46] mine every single day. Trades breakdowns, the logic behind them, everything is completely transparent. You can even set up copy trading and automatically. Plus, there are
[02:00] strategies and support in there that you won't find on this channel. It's completely free to join. The link is in the description below this video. First signal and I'm opening a sell trade for 29 bucks with 1-minute expiration.
[02:14] Looking at the ADX, the green line is crossing below the red line. What does that mean? The buyers just lost their edge and the sellers have taken control. The tables have turned. Checking momentum, the turquoise line is also
[02:29] crossing below the 100 baseline. The momentum confirms it. The downtrend move is gaining strength. Both indicators are telling me the exact same thing. Opening [music] the trade. And that's the whole mechanic here. ADX
[02:44] tells you who controls the market, momentum tells you when that control shifted. A crossover on both means you enter. Even if one doesn't cross, you sit on your hands and wait.
[03:03] >> [music] >> Locking in $26 in profit. Moving on, the second trade is buy and right here I'm going to show you something that a lot of people get confused about on the ADX, which causes them to enter in completely
[03:18] wrong direction. Opening a buy trade for $55, 1-minute expiration. It's a mirror image of the last trade. ADX, the green line crossed above the red line, meaning buyers took over. Momentum, uh the turquoise line moved above the 100
[03:35] level. Two confirmations, so we buy. Now, here's what I promised to show you, a common mistake. Uh beginners look at the ADX and mix up which line is which. The green line is plus D, that represents the buyers.
[03:50] >> The red line is minus D, the sellers. If green is on top, the market is moving up. If it's red on top, it's moving down. It sounds obvious, but at the speed of 15-second time frame, when those lines
[04:05] are flashing and moving fast, people get confused and execute the opposite trade. That's exactly why we colored them green and red. Green means go up, red means go down, just like a traffic light. You can't miss it.
[04:20] can't miss it. >> [music] the third trade, and this is where that account-killing habit comes into play,
[04:34] so watch closely. Opening a buy trade for $106, 1-minute expiration. ADX green is above red, momentum true ADX green is above red, momentum true close is above 100, entering a buy trade
[04:47] completely by the book. But watch what happens next. Right after opening, the price started dropping. Not a massive crash, but noticeable. Candle after candle dipping into the red. On a 15-second time frame, this looks
[05:02] terrifying because everything happens so fast, and it feels like the trade is already gone. And here comes that bad habit. You know what a beginner does? They look at the next trade and think,
[05:15] "Well, this one is a loss. I need to open a counter trade in the opposite direction to make up for [music] it." They open a second trade and a sell right on top of the first one. Now they have two open trades pulling in opposite
[05:30] direction, guaranteeing a loss on one of them, sometimes on both. Me, I do absolutely nothing. The trade is set for 1 minute, it will close itself. The momentum didn't break, and the ADX didn't flip, which means the
[05:45] the ADX didn't flip, which means the signal is still valid. I just wait. [singing] >> Boom! Locking in $98 in profit. The
[06:00] >> Boom! Locking in $98 in profit. The price bounced right back. As I said, it always comes back if the signal was right in the first place. 343. Opening a right in the first place. 343. Opening a buy trade for $205, 1-minute expiration.
[06:13] At first glance, it looks like a standard entry. ADX green is on top, momentum is above 100, but take a close look at how the green line crossed the In the first few trades, the crossover were smooth. The lines gradually crossed
[06:29] and swapped places, but here, the green line sliced right through the red line sharply at a steep angle. The distance between them got wider right away, and here's what that means. The sharper the crossover and the faster
[06:44] the line separate right after it, the stronger the momentum. Remember that a shallow crossover means the move will be sluggish. A sharp crossover means the market has already taken off and has no intention of stopping.
[06:58] That is the kind of detail you don't catch during your first five trading sessions. You start noticing it later on once your eyes get used to the ADX, and that's when you stop just picking correct entries and start picking the
[07:11] correct entries and start picking the best entries.
[07:24] four. The final one is up next. Last trade of the session, opening a sell trade for $394, 1-minute expiration. Red crossed green, sellers have taken control, momentum dropped below 100. The
[07:38] crossover is sharp and the lines separated quickly, so this is a strong After what we broke down on the trade number four, you can already see it yourself, right? That's the whole point of this. The
[07:52] strategy doesn't change from the trade to trade. The same two conditions, the same exact logic, but with every trade you start seeing deeper. Not just did it cross or not, but how did it cross? How sharp was it and how fast did the line
[08:08] That's no longer just a strategy, that's a skill. And that stays with you forever. >> [music]
[08:20] [music] >> Securing $362 in profit, total balance is $756. [music] What a phenomenal session. Took my balance from $29 all the way up to $756. Five trades, five wins.
[08:35] Three key takeaways from this video. ADX shows who's in charge, momentum confirms the exact pivot point, and you never enter without both signals.
[08:47] Never open a second trade on top of the first one just to revenge trade or compensate, and pay attention to the crossover angle on the ADX. The sharper it is, the more powerful the move is. If you have any questions left, drop a
[09:03] message on Telegram. I'd really appreciate it if you like the video and subscribe to the channel. I'm Steven, and I'll see you in the next one.




⚡ Saved you 0h 09m reading this? Transcribe any YouTube video for free — no signup needed.