
The Market Isn't Chaotic - Cut the Noise
44sChallenges a common belief and promises a clear strategy, sparking curiosity.
▶ Play Clip"The title promises a winning edge, and the video delivers a concrete indicator setup with live examples, though it leans heavily on promotional content."
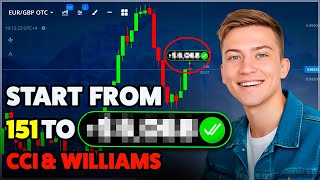
The video presents a trading strategy for Pocket Option that uses CCI and Williams indicators on a 30-second chart to identify high-probability buy signals. The creator demonstrates the setup and walks through live trades, emphasizing confluence and structure. The session ends with a significant profit, showcasing the strategy's potential.
The video introduces a strategy that filters out market noise by focusing on real price movements using CCI and Williams indicators on a 30-second chart.
Set up CCI with period 5, style: turn off background, set +100 line to green and -100 line to red with full opacity. Set up Williams with period 5, main line and -20/-80 lines with full opacity.
When CCI crosses above the -100 line, it signals a shift from selling to buying pressure. This is a structural change, not a snap reversal.
Williams confirms the CCI signal with an upward cross, providing confluence and eliminating doubt.
The strategy is claimed to work any time of day and in any market condition, making it universal.
The session started with a $151 trade and ended with a balance of $7,572, with the final trade adding $1,840.
Which two indicators are used in the strategy?
CCI and Williams
00:46
What period is set for both CCI and Williams?
5
01:03
What timeframe is used for the chart?
30 seconds
00:46
What does a CCI cross above the -100 line indicate?
When the CCI line crosses above the -100 line, it signals a shift in momentum from selling to buying.
02:17
What role does the Williams indicator play?
It confirms the CCI signal, providing confluence.
02:31
What was the final balance after the trading session?
The balance grew from $151 to $7,572.
06:45
What expiration time is used for the trades?
One minute
02:05
Indicator Setup
Provides a clear, step-by-step configuration for CCI and Williams, making the strategy accessible to beginners.
00:46Confluence of Signals
Emphasizes the importance of multiple indicators confirming each other to reduce false signals.
02:17Session Results
Demonstrates the potential profitability of the strategy with a real trading session from $151 to $7,572.
06:45Universal Applicability
Claims the strategy works in any market condition, suggesting versatility for traders.
05:26[00:07] clicked for me the moment I realized one thing. The market isn't chaotic. I was just looking at the wrong things. So, I cut out the noise and kept only what
[00:19] shows real price movements. In this video, I'll show you how this strategy helps you see the market clearly and make decisions with zero hesitation.
[00:31] Stick around to the end. You'll see why this is completely different from anything else you've seen before. If this brings value, hit the subscribe button and drop a like. Let's get into it. First things first, we set up the
[00:46] tools. Classic candlesticks. Time frame 30 seconds. Go to the indicators. Add 30 seconds. Go to the indicators. Add CCI and Williams. Now CCI, set the period to five. Then go to style. Turn off the background. Set the plus 100
[01:03] line to green with the two. Opacity all the way up. Set the minus 100 line to red with the two opacity all the way up. And then save.
[01:21] Now Williams period 5. Go to style main line with the two minus 20 and minus 80 lines with the two opacity all the way up and then save. The indicators are ready. If you trade on your phone, set it up the same way.
[01:36] And if you want ready to use trade ideas and to work with me every day, join me on Telegram. There's autocopy trading, daily scenarios, personal support, no
[01:48] paid entry, no money under management, spots are limited. The group closes soon. Message me if you want in. I open this session with a clear edge. Expiration 1 minute. I open a buy trade for $151.
[02:05] Now, I'll show you exactly how this strategy works and why this signal is especially strong. First CCI when the Turos line crosses the red line from
[02:17] below to above the market signals a shift. Selling pressure fades momentum shift. Selling pressure fades momentum starts to turn. Price slowly moves under starts to turn. Price slowly moves under buyer control. This is not a snap
[02:31] reversal. This is a structural change. Next, Williams. Same story. The Turos line crosses up again. It doesn't repeat the signal. It confirms it. Two
[02:43] indicators, one direction, no contradiction. When both point up, doubt disappears. The trend builds cleanly. Structure The trend builds cleanly. Structure align. The move has a solid foundation.
[03:07] profit. Let's keep watching the market. A little while later, a new setup forms. Expiration one minute and I open another buy trade for $289.
[03:20] After a small pullback, the market shows intent immediately. Price stabilizes fast. Buyers step back in. Candles stretch higher. Bodies get stronger.
[03:32] Movement becomes clean and direct. The uptrend develops smoothly. No chaos. No spikes. Structure stays clean. Momentum is stable. Zooming out, the overall trend is
[03:47] clearly bullish. Indicators fully supported. No conflicting signals.
[04:05] The result comes fast. Plus $266. Moving on.
[04:21] hey, hey, hey,
[04:52] expiration 1 minute and I open a buy trade for $2,000. Both indicators point in the same direction. Price reacts immediately. Candles expand, momentum strengthens, and volume builds. This move has real
[05:10] and volume builds. This move has real force. Structure stays clean. No noise, no hesitation. The market already made its choice. Everything here makes total sense. The profit expectation is justified. And here's something
[05:26] important. This strategy is universal. It works any time of the day, any market conditions. Trade when it's convenient for you. And if you have any questions after watching the video, just message me on
[05:41] watching the video, just message me on Telegram and I'll help you personally.
[05:56] profit. Final trade of the session. Timer 1 minute. I'm opening a buy trade for $2,000. After touching the level, the market After touching the level, the market doesn't correct. It explodes higher.
[06:10] doesn't correct. It explodes higher. Fast, confident, no hesitation. Buyers are in full control. Pressure is immediate. Candles get stronger. Movement stays tight and organized. This impulse is real. The market isn't
[06:27] testing the level. It's using it as a support to move higher.
[06:45] $1,840 profit. Balance grows to $7,572. Let's wrap it up. I'm happy with the session. The balance grew from $151
[06:59] session. The balance grew from $151 all the way to $7,572. questions, message me on Telegram. I'm always glad to help. Thanks for
[07:11] watching. Thanks for the like. Thanks for subscribing. I'll see you next time. for subscribing. I'll see you next time. Trade smart.




⚡ Saved you 0h 07m reading this? Transcribe any YouTube video for free — no signup needed.