
The Strategy That Reveals Market Direction
60sOpens with a bold claim that most traders miss signals, promising a strategy that spots market strength before movement begins.
▶ Play Clip"Title promises a repeatable strategy, but the video is mostly trade recaps with vague indicator logic and no real educational depth."
The video presents a binary options trading strategy for Pocket Option, using RCI and Fractal indicators on a 30-second chart. The creator demonstrates four live trades, explaining how to identify trend reversals and continuations. The session ends with a total profit of $1,209, growing the balance from $8,500 to $12,589.
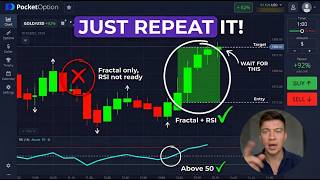
Use classic candlesticks with a 30-second time frame. Add RCI (period 5) and Fractal indicators. Customize fractal colors (up red, down green) and RCI (disable 70/30 lines, yellow 50 line, turquoise main line).
A red fractal arrow above candles signals a potential downward reversal. Confirm with RCI: turquoise line crossing yellow MA from top to bottom indicates a downtrend.
In a clear downtrend with new lows and weak corrections, both indicators confirm continuation. Sell trade for $640.
Sideways movement after an impulse can be an accumulation zone. If global structure is upward, expect further gains. Buy trade for $1,315.
After a series of declines, a calm, controlled downtrend with shorter rebounds indicates weak buying pressure. Sell trade for $790.
Total profit $1,209. Balance grew from $8,500 to $12,589.
Which two indicators are used in this strategy?
RCI (period 5) and Fractal indicators.
00:48
What does a red fractal arrow above the candles indicate?
A red arrow above the candles signals a potential downward reversal.
01:57
What RCI signal confirms a downward move?
When the turquoise RCI line crosses the yellow moving average from top to bottom.
02:11
What does a sideways trend often represent in this strategy?
A sideways trend often acts as an accumulation zone before a further move.
04:31
What does a shorter subsequent decline that ends quickly signal?
Weak buying pressure, indicating sellers are in control.
05:37
Fractal as first signal
Provides a clear, visual entry trigger that is easy for beginners to spot.
01:57RCI confirmation
Adds a second layer of confirmation, reducing false signals.
02:11Sideways as accumulation
Explains a common market phase that many traders misinterpret as reversal.
04:31Session profit
Shows a concrete result ($1,209 profit) that validates the strategy's potential.
06:18[00:06] market almost always shows where it's going. The problem is most people simply don't understand these signals. The strategy I'm about to show you is designed precisely for these moments.
[00:21] When the movement hasn't yet begun, but we can already spot it. Today I'll show you how it determines market strength and why its signals are hard to confuse with ordinary noise. I'd appreciate a
[00:35] subscription to the channel and a like on the video. Let's dive in. First, let's get the tools ready. I'm using classic candlesticks with 30-second time frame. Go to the indicators tab and select RCI
[00:48] Go to the indicators tab and select RCI and fractal. We'll set up fractal first. Change the style. Make the up line red, then make the down Make the up line red, then make the down line green, and then save it.
[01:00] Now RCI, set the period to five, change the style, disable the 70 and 30 lines, make the 50 line yellow with a width of two, make the main line turquoise with
[01:13] width of two as well, and then save it. That's it. The indicators are ready to go. If you trade from your phone, just set up everything the same way. I publish daily analysis, market benchmarks, and share the results in my
[01:28] Telegram group. You can set up copy trading and automatically copy all my actions. Message me to join. I see a first good situation. Expiration 1 minute, and I open a sell trade for $1,700.
[01:44] Now we'll look at how to use this strategy and what's important to pay attention to. First, look at the fractal. When a red arrow appears above the candles, it's the first signal that the market is
[01:57] starting to change direction. This signal often appears when an upward movement weakens and a downward structure begins to form. Next, we always check the for confirmation using the RCI. When its
[02:11] turquoise line crosses the yellow moving average from top to bottom, this indicates that movement is already supporting the downward movement. The decline ceases to be a random correction and begins to look like an
[02:26] correction and begins to look like an emerging trend.
[02:41] in profit. Moving [music] on to the next situation. Second situation, expiration time is 1 minute, and I open a sell trade for $640. At the moment, the chart shows a confident downward movement. The trend
[02:55] is easy to read. The price is constantly making new lows, and the structure remains clear and directional without unnecessary upward surges. Selling pressure remains. Correction appear weak and do not disrupt the
[03:11] The The market is moving calmly and steadily with no signs of reversal in the current section. The indicators also simultaneously confirm what's happening.
[03:24] Both point to a downtrend, reinforcing the overall picture. With these dynamics, there's reason to expect a continuation of a downward movement, for sure. >> [music]
[03:48] the next signal. The next market segment is moving extremely quickly. The expiration is 1 minute, so I open a buy trade for $1,315.
[04:02] The price has entered a brief sideways movement and appears to have calmed down a bit after the previous impulse. Such segments often look like a temporary stop before the next move.
[04:16] At the same time, looking at the overall picture, the global structure remains upward. Lows are holding higher. Pullbacks aren't disrupting the overall trend, and the market shows no signs of a downward reversal.
[04:31] In such situations, a sideways trend often acts as accumulation zone before a further move. If momentum begins to strengthen again, there's every reason to expect further gains and a continuation of the uptrend.
[04:49] By the way, if you have any questions after watching the video, feel free to message me privately on Telegram, and I'll gladly help you.
[05:06] >> Excellent results. Making profit of $1,209. Let's continue and look for the final situation. The last signal appears after a series of declines. The timer is set to 1 minute, and I open a sell trade for
[05:23] $790. The price gradually moves downward, and the movement appears calm and controlled. There are no sharp drops or chaotic candlesticks. The decline develops smoothly with a clear
[05:37] develops smoothly with a clear structure. subsequent one becomes a shorter and ends more quickly. The price doesn't fully rebound, and any attempts at growth immediately fizzled
[05:52] out. This is an important signal of weak buying pressure. With this dynamic, it's clear that sellers are in control, and the market is moving steadily downward without excessive resistance, which
[06:06] often indicates a continuation of a downward movement. downward movement. >> [music]
[06:18] >> Great. I'm up $726. My balance has reached $12,589. great session. My balance has grown from $8,500 all the way to $12,589.
[06:35] methodology itself or you want to go deeper, just feel free to message me on Telegram. I'll be happy to help. Thanks a lot for watching, liking, and subscribing to the channel. I'll see you in the next one. Trade smart.




⚡ Saved you 0h 06m reading this? Transcribe any YouTube video for free — no signup needed.