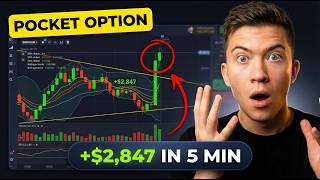

Stop Making This Trading Mistake!
47sHigh engagement from identifying a common beginner mistake and promising a unique strategy.
▶ Play Clip"Title accurately describes beginner strategy with live trades, though results may not be typical."
This video presents a trading strategy for beginners using Pocket Option, focusing on 1-minute binary options trades. The presenter, Steven, demonstrates how to use MACD and ADX indicators to identify entry points, emphasizing patience and confirmation over chasing obvious moves.
Most traders enter the market when the movement is already clear to everyone, which is a mistake. The strategy aims to identify the exact moment when the market is on the edge of a move.
Use classic candlesticks with a 1-minute time frame. Set up MACD with fast period 10, signal period 5, slow period 20. Disable histogram, set line widths to 2. For ADX, disable ADX line, set remaining lines width to 5.
MACD green line crosses below red line signals momentum shift downward. ADX turquoise line crosses below yellow line confirms increasing selling pressure. Opened sell trade for $69, secured $63 profit.
Price gradually builds upward momentum without chaotic spikes. Pullbacks are brief and quickly reversed, indicating solid buying pressure. Opened buy trade for $132, secured profit.
Price moving sideways, lacking momentum to break out. False moves are common; it's wiser to pass and wait for clearer opportunity. Patience is more beneficial than entering a questionable trade.
After prolonged decline, price forms a neat staircase pattern upward. Each new high exceeds the last, candlesticks close higher, no deep pullbacks. Opened buy trade for $1,260, secured profit, balance reached $2,419.
The strategy relies on MACD and ADX crossovers on a 1-minute chart to time entries. Key takeaways include waiting for confirmation, avoiding false moves in sideways markets, and recognizing strong momentum patterns like staircases.
What are the two indicators used in this strategy?
MACD and ADX.
00:39
What time frame is used for the candlestick chart?
1-minute.
00:39
What are the MACD settings used?
Fast period 10, signal period 5, slow period 20.
00:39
What does a MACD green line crossing below the red line indicate?
Momentum is starting to shift downward.
01:54
What does an ADX turquoise line crossing below the yellow line indicate?
Selling pressure is increasing.
02:08
What should you do when the market is moving sideways without clear momentum?
Skip the trade and wait for a clearer opportunity.
04:32
What pattern indicates a strong upward trend according to the video?
A staircase pattern where each new high exceeds the last and pullbacks are minimal.
05:47
What was the final balance after the fourth trade?
$2,419.
06:58
Common Mistake: Chasing Moves
Identifies a key psychological error that most traders make, setting the stage for the strategy's value.
00:08MACD and ADX Crossover Confirmation
Core technique of the strategy: using two indicators to confirm momentum shift before entering.
01:54Patience in Sideways Markets
Emphasizes the importance of skipping unclear setups, a crucial risk management principle.
04:32Staircase Pattern as Strong Trend Signal
Describes a specific price action pattern that indicates strong, sustainable momentum.
05:47[00:08] same mistake. They enter the market when the movement is already clear to everyone. In this video, I'll share a strategy that takes a different approach. It identifies the exact moment when the market is on the edge of
[00:23] Now, I'll break down how it works and show you how to use signals to recognize when the market has made its decision. My name is Steven. I appreciate if you subscribe to the channel and like this video. Let's get going. First, let's get
[00:39] our tools ready. I'm using classic candlesticks with a 1-minute time frame. Head over to the indicators tab and select MACD and ADX. We'll set up MACD select MACD and ADX. We'll set up MACD first. Set fast period to 10, signal
[00:54] period to five, slow period to 20. Now, switch to style, disable histogram, set switch to style, disable histogram, set MACD and signal width to two, then save.
[01:10] five, then switch to style, disable ADX, and set the remaining lines width to Then save it. And the indicators are all set. If you trade from your phone, just set up everything the same way.
[01:24] And if you want daily market benchmarks and you would like to work with me, consider joining my Telegram group. I offer auto copy trading and private strategies. Just message me to join. In the first situation, it seemed like the
[01:38] market was going for a steep decline. With 1-minute expiration, I opened a sell trade for $69. Now, I'll show you how to apply the strategy so the entry logic is as clear as possible.
[01:54] First, pay attention to the MACD. When the green line crosses below the red line, this is a signal that momentum is starting to shift downward. The rally starts to fade and the market begins to reshape itself into a downward
[02:08] trend. Next, make sure to check the ADX for confirmation. When its turquoise line crosses below the yellow line, this indicates that selling pressure is increasing. The downward move gains
[02:21] additional support from the trend strength indicator. >> [music] >> And I secured $63 in profit. Off to a
[02:34] great start, my friends. In the second situation, the movement appears cleaner and easier to understand. Again, with a 1-minute expiration, I opened a buy trade for $132. The price starts to gain momentum
[02:48] upward. This movement isn't abrupt. Instead, it's gradually building momentum, which is a favorable sign that momentum is forming naturally without chaotic spikes. During such times, it's crucial to
[03:02] observe not just the upward movement, but also how the price behaves between Pullbacks may happen, but they're brief and quickly reversed. The market almost immediately resumes its upward trajectory, indicating solid
[03:18] buying pressure. This kind of reaction typically signals a strong demand. As long as corrections remain brief and do not disrupt the movement structure, buyers maintain the initiative and the upward movement has a
[03:32] initiative and the upward movement has a strong chance of continuing. in profit. Excellent. The market is behaving just right.
[04:32] of strong acceleration. With 1-minute expiration, I opened a buy trade for $540. The price is currently moving sideways. It seems like the chart might attempt to break higher, but it feels as as if the
[04:47] market isn't fully ready just yet. The candlesticks appear to lack the momentum needed to confidently break out of range. A rally is likely to happen later once the price builds up more energy.
[05:01] False moves are common during sideways movements, so it's essential to avoid rushing in. Always analyze such situations from all angles, and if you're not entirely sure about the direction, it's wiser to just pass it
[05:17] and wait for a clearer opportunity. Sometimes, patience is more beneficial than entering a questionable trade. Mates, if you still have questions after watching the video, don't hesitate. Message me on Telegram privately and
[05:33] Message me on Telegram privately and I'll be glad to assist you. I'll be glad to assist you. >> [music]
[05:47] worries, that happens. The important thing is that I've demonstrated a challenging situation and now you can draw your own conclusions from it. The final signal emerges after a prolonged decline.
[06:00] I set the timer for 1 minute and opened a buy trade for $1,260. The price begins to move upward gradually, forming a neat staircase pattern. Each new high exceeds the last one and the growth pattern remains clear
[06:16] and understandable. The candlestick consistently close higher, showing strong momentum. The market isn't undergoing any deep pullbacks. The movement is calm and focused. Buyers
[06:29] are clearly in control, not allowing the price to retreat too much. With this structure, the trend seems stable as long as the new highs continue to form and downward pressure remains limited. There's every reason to anticipate
[06:44] There's every reason to anticipate further growth and a favorable outcome.
[06:58] in profit, bringing my balance to $2,419. with the results. My balance went from $69 all the way to $2,419.
[07:16] deeper into the method or you've got any questions, just hit me up on Telegram and I'll gladly walk you through it. Huge thanks for watching, liking the video. Hit the subscription button. I'll catch you in the next one and trade
[07:30] catch you in the next one and trade smart.




⚡ Saved you 0h 07m reading this? Transcribe any YouTube video for free — no signup needed.