
Stop Sabotaging Your Trades!
40sRelatable self-improvement angle combined with a promise of a winning strategy hooks viewers seeking quick trading success.
▶ Play Clip"Title promises a top strategy making $13k; video shows a demo with $3,861 profit, but the method is clearly explained."
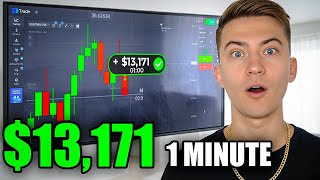
Steven shares a trading strategy using two indicators—D Marker and Stochastic Oscillator—on a 1-minute chart with 3-minute expirations. He demonstrates how synchronized crossovers signal high-probability trades, leading to a $13,171 balance from $9,310 in one session.
Set candles to 1-minute timeframe. Add D Marker (period 10) and Stochastic Oscillator (K period 10). Adjust D Marker style: change 30 line to 20, 70 line to 80, make 80 line turquoise and 20 line yellow. For Stochastic, disable D line, make K line gray with width 2, and reduce opacity of 80/20 lines.
Both indicators cross their upper lines from top down simultaneously. This is the strongest signal for a downtrend. Only enter when both confirm; skip if one lags.
After a prolonged drop, price bounces off support. Indicators show a synchronized upward crossover, signaling a buy. The upward impulse is smooth and consistent, confirming buyer strength.
After a brief rise, market loses momentum. Candles return to downward movement, confirming seller strength. A sell trade is opened with 3-minute expiration.
Price hits resistance, reverses downward sharply. Candles become longer and consistent, forming a powerful downward impulse. Sellers are in control.
Balance grew from $9,310 to $13,171 (+$3,861) in one trading session using the 3-minute setup.
The MEA method relies on synchronized crossovers of D Marker and Stochastic Oscillator on a 1-minute chart with 3-minute expirations. Discipline and clear signals help avoid false entries and achieve consistent profits.
What two indicators are used in the MEA method?
D Marker and Stochastic Oscillator.
00:35
What is the recommended timeframe for the chart?
1-minute.
00:35
What expiration time is used for trades?
3 minutes.
02:00
What adjustment is made to the D Marker's 30 and 70 lines?
The 30 line is changed to 20, and the 70 line is changed to 80.
00:47
What color is the 80 line on the D Marker?
Turquoise.
00:47
What color is the 20 line on the D Marker?
Yellow.
01:02
In the Stochastic Oscillator setup, which period is disabled?
The D period (D line) is disabled.
01:02
What is the key condition for entering a trade?
Both indicators must cross their upper or lower lines simultaneously.
02:16
What should you do if one indicator lags or doesn't confirm the move?
Skip the trade and wait for full synchronization.
02:30
What was the starting balance and ending balance in the demo?
Starting balance $9,310, ending balance $13,171.
05:58
Synchronized Crossover Signal
This is the core principle: only trade when both indicators cross simultaneously, which increases reliability.
02:16Support Bounce Buy Signal
Demonstrates how to identify a trend reversal after a bounce off support with smooth upward candles.
03:06Resistance Reversal Sell Signal
Shows how to spot a strong downtrend after price fails at resistance, with increasing bearish momentum.
05:00Profit Summary
Quantifies the strategy's potential: $3,861 profit in one session, from $9,310 to $13,171.
05:58[00:05] Hi, this is Steven. We all want results, but most of the time we sabotage ourselves with haste and chaotic actions. I used to make those mistakes, too, until I realized results come when there is discipline and clear guidance.
[00:22] And those two tools became my guidelines. Today, I'll share how they help me stay consistent. My name is Steven. Thank you for subscribing to the channel and liking the video. Let's get started. First, let's get the tools
[00:35] ready. Set the candles to classic time frame 1 minute. Go to the indicators tab and choose D marker and stochastic oscillator. Set up D marker period 10.
[00:47] Then go to style, change the 30 line to two to 20. And change the 70 line to 80. Make the 80 line turos. Move opacity to the right and make the 20 line yellow
[01:02] opacity to the right as well. Make the main line gray with the two and then click save. Now let's set up the stochastic oscillator K period 10. Then go to style, disable the D period. Make the K
[01:19] period line gray with two. For the 80 and 20 lines, move opacity to the right. and 20 lines, move opacity to the right. Then click save.
[01:31] on your phone, set up everything the same way. And if you're looking for a way to develop your trading skills and get up to date analysis every day, join my free Telegram channel. We share strategies, analyze trades, and grow
[01:45] together. If anything in the video is unclear, message me. I'll explain. The channel link is in the description. Come and grow with us. On Telegram, you'll find useful materials and tips for trading with more confidence. The first
[02:00] situation kicks off the day confidently. Expiration 3 minutes, and I'm opening a sell trade for $1,000. Now, I'll explain in detail how to trade using this strategy properly. On the chart, we see that both indicators cross
[02:16] their upper lines from top down simultaneously. This is the key moment, the first and strongest signal of a coming downtrend. It's the matching signals from both
[02:30] tools that make the signal strong and reliable. It's important to remember only enter the market when the crossover has happened on both indicators at the same time. If one lags or doesn't confirm the move, better to skip and
[02:45] wait for full synchronization. That approach helps me avoid false entries and only trade when the chances of trend development is highest.
[03:06] profit. A fantastic beginning to the session when the chart reads clearly. Currently, after a new signal appears, expiration 3 minutes, and I'm opening a buy trade for $1,800. After a prolonged drop, the price
[03:22] approached a support level and bounced off it, showing first signs of recovery, off it, showing first signs of recovery, the chart starts to raise gradually with movement looking smooth and consistent. The structure of the upward impulse
[03:37] forms with confidence. Candles are arranged without sharp arranged without sharp or chaotic jumps with which indicates buyer strength and a shift in the market sentiment. All this confirms the
[03:52] beginning of the rise and sets the stage for a continued uptrend.
[04:10] and confidence is increasing. A fresh opportunity appears on the chart with a 3minut expiration. I'm opening a sell trade for 800 bucks. After a brief rise, the market quickly loses momentum and the upward impulse fades. candles
[04:26] confidently return to the border downward movement confirming seller strength and the general trend direction. This kind of dynamic clearly indicates that the downward movement continues to
[04:40] dominate. Based on the chart structure, sellers still have enough energy to extend the impulse further. So, I'm expecting further decline and profit from the current scenario. [Music]
[05:00] profit. The balance is increasing and the trading feels calm and predictable. The final moment of the day comes in strong. Timer set to 3 minutes and I'm opening a sell trade for $900. The price hits a resistance zone, cannot
[05:17] sustain upward pressure and sharply reverse downward. From this point, the move, gain speed, candles become longer and more consistent, forming a powerful downward impulse. Such chart behavior clearly shows sellers are in control and
[05:34] pressure is increasing. Judging by the the current dynamics, the downtrend has very high chances to continue moving further and opening path continue moving further and opening path to new levels lower.
[05:58] Ending the day strong. Another $828 profit. Balance rises to $13,171. It's time to wrap it up. Day summary. The balance grew from $9,31
[06:10] all the way to $13,171 during this trading session. Great result. If you have any questions about the MEA method or you want to dive deeper, don't hesitate to message me on Telegram. I'll gladly help. Huge thanks
[06:25] for subscribing to the channel and liking the video. My name is Stephen. liking the video. My name is Stephen. See you next time.




⚡ Saved you 0h 06m reading this? Transcribe any YouTube video for free — no signup needed.