
4 PHP Profilers Compared!
45sImmediately piques curiosity with a clear comparison hook that promises value for PHP developers.
▶ Play Clip"Delivers a thorough comparison of four profilers as promised, though the presenter's bias toward Tideways is evident."
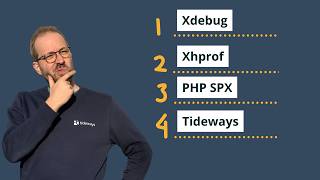
This video compares four PHP profilers—Xdebug, XHProf, PHP SPX, and Tideways—by analyzing the same bottleneck in a Shopware application. The presenter demonstrates installation, configuration, and visualization for each tool, highlighting their strengths and weaknesses, particularly regarding production use. The video aims to help developers choose the right profiler for their needs.
The video analyzes the same bottleneck with four different PHP profilers: Xdebug, XHProf, PHP SPX, and Tideways. The first three are open source, while Tideways is a commercial product. A larger blog post comparing six profilers (including Exakat and Blackfire) is linked in the description.
Xdebug is the oldest and most well-known profiler. Installation is easy via package managers. Configuration involves enabling it as a Zend extension, setting mode to 'profile', and specifying an output directory. It can be triggered via a GET/POST parameter. The overhead is significant, making it unsuitable for production.
Xdebug generates cachegrind files. These can be visualized in PHPStorm via 'Analyze Xdebug profiling snapshot' or with KCacheGrind. If running on a Docker container or remote server, files must be copied to the development machine, which adds complexity.
Xdebug is not recommended for production due to high overhead, large trace files that can fill the filesystem, and easy triggering via a simple parameter, which could be exploited.
XHProf was released by Facebook in 2008 and is now maintained by the community. It is a production-level profiler but difficult to install, requiring manual compilation. Integration into code is manual, offering flexibility but requiring custom trigger code.
The presenter shows how to integrate XHProf into a Shopware application by checking for the extension and a trigger variable, then enabling/disabling the profiler and saving the output to a temp directory in a specific format.
XHProf provides an HTML user interface that lists profile files. It offers a call graph visualization (using 'dot') but lacks filtering, making it hard to navigate large traces.
XHProf can run in production with custom triggers, but installation and integration require significant effort. It offers flexibility but is not user-friendly.
PHP SPX is a lesser-known open-source profiler that is over 10 years old. Installation is easy via the 'pie' command. Configuration requires enabling HTTP profiling, setting a secret key, and optionally a whitelist. Security is baked in by default.
SPX can be triggered via a key in the URL, which sets a cookie to enable profiling for the current user. It uses a flame graph representation, which is different from call graphs. It allows selecting specific time ranges to drill into functions.
The presenter considers SPX his favorite open-source profiler due to its quick setup, security features, and suitability for both development and production.
Tideways is a commercial profiler with various visualizations (flame graph, call graph, timeline). Installation options include Debian, Ubuntu, Docker, CentOS, macOS, and tarball. It offers multiple triggering methods suitable for production.
The simplest way to use Tideways is via a Chrome extension. After installing and authenticating, clicking 'Take Profile' reloads the page and uses message authentication to secure the call, then redirects to the profiler result.
The timeline profiler shows a time span with a list of calls based on instrumentation. It highlights large calls, e.g., an HTTP call to GeoLite Info taking 52% of request time. It also shows stack traces for long-running spans.
Tideways offers a flame graph view that aggregates repeated spans for easier visualization. The call graph view allows deep diving into individual function calls, e.g., curl_exec related to the GeoLite call. Search functionality helps find specific namespaces or plugins.
The video concludes by summarizing the four profilers and encouraging viewers to try Tideways with a 14-day free trial link in the description.
Each PHP profiler has its own strengths and trade-offs: Xdebug is great for development but not production, XHProf offers production capability but is hard to install, SPX is a secure and easy-to-use open-source option, and Tideways provides comprehensive visualizations and production readiness. The choice depends on your specific needs and environment.
Which PHP profiler is the oldest and most well-known?
Xdebug
00:42
What is the main disadvantage of using Xdebug in production?
High overhead, large trace files, and easy triggering via a simple parameter.
03:45
Which profiler was released by Facebook in 2008?
XHProf
04:00
What is the key security feature of PHP SPX?
It requires a secret key and optionally a whitelist, making it secure by default.
08:07
Which profiler uses a flame graph representation?
PHP SPX and Tideways both offer flame graphs.
09:50
What is the simplest way to trigger a profile in Tideways?
Using the Chrome extension and clicking 'Take Profile'.
11:31
Which profiler is considered the presenter's favorite open-source profiler?
PHP SPX
10:46
Xdebug Not for Production
Highlights a critical limitation that affects deployment decisions.
03:45XHProf Production Flexibility
Shows how a profiler can be customized for production use despite installation challenges.
07:10SPX Security by Default
Emphasizes the importance of security in profiling tools, a often overlooked aspect.
08:07Tideways Timeline Visualization
Demonstrates how a timeline view can quickly identify performance bottlenecks.
12:40[00:01] different PHP profilers? How do they visualize? How can the profiler be activated? And how useful is it to run in production? We'll find out in this video when we analyze the same bottleneck with four different PHP
[00:15] bottleneck with four different PHP profilers: Xdebug, XHProf, PHP SBix, and Tideways. The first three are open source and available for free, and Tideways is the product that I am working on for the 10 last 10 years. In
[00:30] the description, you can also find a larger blog post with a comparison between six different PHP profilers, where we also include Exakat and Blackfire. Hi, I'm Benjamin and I'm working on PHP
[00:42] profilers for the last 12 years, helping thousands of developers along the way. We'll start with Xdebug, the oldest of all PHP profiles available, and also the one that probably all of you have heard about or even used before.
[00:57] Installation of Xdebug is quite easy. From xdebug.org, you find explanations for all the various different Linux package managers, macOS, Windows, everything is available. There are tons of different installation instructions,
[01:13] and also they've compiled a lot of videos. So, you should be able to install it without problems. Then, you need to configure it. Then, you need to configure it. On a production server, I've set up
[01:26] a project. You need to make Xdebug enabled as a Zend extension, configure the mode to be profile, and the output directory to be temp, and then start with request trigger. Let's see how running the profiler works. We
[01:41] switch to the documentation, profiling, and there we can see starting the profiler with the trigger, which we configured, uses this get post parameter. Because the overhead of Xdebug is significant, and then
[01:57] afterwards we uh since we're using systemd, it puts the temporary directory here, and we can see we have cachegrind output
[02:09] uh 4.5 much larger. So, let's
[02:23] uh move this out of this server, and then load it with PHP Storm, which is possible which is one option to visualize uh cachegrind data.
[02:35] In PHP Storm, you click on the Tools menu, Analyze Xdebug profiling snapshot, then select the file, and then you get this output here. if you're running Xdebug on a Docker container, or um if you run it on a
[02:51] staging or production system, then you need to copy over the files to your development system to make this possible. So, this is um uh something that makes it a bit more complicated to use um full stack to analyze the data.
[03:04] Then you can see the table of calls here in PHP Storm, or in uh a cachegrind variant that you can also install, and there's also the call tree option here to walk through this. So, Xdebug is a great profiler to get started in
[03:17] development. It's easy to install and configure, and also to trigger trace data. Um it's a bit more difficult to get this data into PHP Storm, KCacheGrind, also if you're running it from a Docker container, or uh from a
[03:30] use it in production. It's not recommended to use it in production, because as you saw, it's easy to trigger with the same variable, the data it generates is many megabytes big, so it can also crowd out the file system, and
[03:45] um because it runs a bit slower than without the extension, it also affects the production application with an overhead that is maybe a little bit too The next PHP profiler that we want to look at is called XHProf. It was
[04:00] released to the public in 2008 by Facebook, but they never really maintained it further since they switched to HipHop and HHVM back at the time. There were a lot of forks and it's currently maintained as well. Version
[04:12] currently maintained as well. Version 2.3.9 was released um a a while ago. So, there's now stable maintainership for this project. Compared to Xdebug, a production level profiler, so you can easily run it in
[04:24] production. However, the downsides is that it's quite difficult to install and you need to do a lot of things manually. And you also need to compile the extension yourself. So, unless you find a project or distribution that ships it
[04:38] pre-compiled, but um nowadays there are not that many that do that. I'm not going to show how to install it, but I'm going to show how to integrate it into your your code. So, for this shopware application, it's
[04:51] difficult because it's using Symfony runtime. We need to go into the code and install some additional um code here. So, there are bundles that help you with it, but it's not quite easy to get it running um and you need to write this
[05:04] triggering code yourself. This gives you a lot of flexibility if you want to enable it in production all the time because you can secure it and but um implementing this is uh left for your
[05:17] own exercise. So, I'm checking for the extension and for an XHProf trigger variable being available. I have the method XHProf enable then. And then after the request is run, I have this code here um that
[05:31] disables it and puts the file into the temp directory given a very specific format because XHProf then looks for this in the user interface. this in the user interface. So, let's see how this runs. I I
[05:46] my demo shop here. I've set XHProf trigger equals one and I'm running this script now. It takes a little time, so you saw the refresh. And then I have the user interface
[05:59] installed on the server as well. On the index.php, it finds all the files that are put into this directory here and I can switch to it and then I see the
[06:11] this. Similar to um how PHP Storm rendered the Similar to um how PHP Storm rendered the Xdebug profile, this is using an HTML output. Um it's quite dated, but it's um
[06:24] to see. There's also the possibility to have a visual representation when you click view full call graph. The call graph is rendered using the dot command and then I can scroll out.
[06:41] And as you can see on very big traces, it's helpful to see it's helpful to see how this request flows, but um there's no filtering mechanisms here and um it
[06:54] a bit big requests. Um nevertheless, quite quite the helpful functionality from XHProf here. So, XHProf runs in production. You have all the flexibility to install it with the triggers that you want yourself. So,
[07:10] the installation takes um more time because you need to integrate it this but then the benefit is that you can run it on production. The last open source profiler I want to show is called PHP SPX. It's a little uh
[07:24] less known than XHProf and Xdebug, but it's also already over 10 years old and um it has made quite the progress during that time. Installation for this is particularly easy since the pie command came out.
[07:39] And um as you can see here, installation we are pie is quite easy. Just install this project and it will compile the extension. And also make sure that the user interface is installed correctly so
[07:53] that you can immediately use it um, through the browser. This is quite helpful and I really like the installation and all the care that was Once you have SPX installed, you need to configure it. And we can look at the
[08:07] configuration here. You need to say the expansion extension is loaded and then you enable the HTTP profiling support. You have to specify a secret key. So this is great. SPX is already production and security-wise
[08:24] um, on the front lines. It So you need to specify a key. The longer the more secret it is and better. Also, you have to specify a white list, but you can make it star so it allows from any IP. But I love that it's sort of like baking
[08:39] security in by default. You can enable SPX then it's not going to run SPX then it's not going to run and people are not going uh able to use it. So restart. And then we switch to the application
[08:55] And then we switch to the application ourselves. The way you can use SPX is let's go back to the application and use SPX. We can see here we can put the key in here.
[09:08] we run it. Then what we can do is we can enable it. And this sets a cookie to my understanding. So our current user now
[09:21] So our current user now has the profile enabled. We can go to the site and scroll through it. Profiler will be activated. now if we
[09:34] reload the control panel we see profiling data at the bottom. Uh we saw the load the get slash um that we opened here, but there are also Ajax request where they were profiled. We can click on them and it then goes into the
[09:50] click on them and it then goes into the profiler where compared to um Xdebug and XHProf, it's using a flame graph representation instead of a call graph and the call table. So, we can see here from the top where
[10:04] The difference with this representation is that it doesn't go as deep as possible. We can see on the high level where time is spent, but at some point it's not uh going much deeper uh from this level here.
[10:19] But, we can select some time here and then go into specific functions. Here we can see um Guzzle HTTP handler being called taking
[10:32] Guzzle HTTP handler being called taking up most of the time, 205 milliseconds. um this is a great profiler that allows you to get started very quickly both in development and to production. And um in
[10:46] my opinion, it's uh it's my favorite open source PHP profiler. Lastly, I want to show you Tideways and obviously I'm biased. I think it's the greatest PHP profiler you can use. It has various different visualizations,
[11:00] both flame graph and call graph and also uh a lot of different ways to trigger it uh a lot of different ways to trigger it that suits it uh well to production. have tons of different ways of installing it starting from Debian and
[11:15] Ubuntu and Docker all the various different uh operating systems CentOS based, uh Mac OS, and also installation from tarball for breath, Frank and PHP, all the different uh ways you might need to integrate Tideways into your PHP um
[11:31] setup. The simplest way to use Tideways is to install the Chrome extension and then if you've installed that into your browser, switch to your application. If you're authenticated to
[11:43] Tideways, you can use this Chrome extension button on the top here and click on take profile. It will reload the page. It will use message authentication to secure this call, so not everybody can do it and
[11:58] then it gets this information back and allows us to switch directly into the scroll profiler result. After clicking, we end up in the Tideways timeline profiler where we see the time span from 0 to 379
[12:12] And it loads a list of different calls that took part in the system based on an instrumentation that we introduced into the Tideways extension. So, it's
[12:27] understand the context of the application. For example, we can see one very large call here representing an HTTP call to GeoLite Info um
[12:40] that takes up 52% of the whole request time. We can also see various different um time spans as we call them. Uh we see Symphony events and Symphony
[12:52] and from there we can scroll through them. If they take longer, then we also see a stack trace here and where they happen, so it's easy to understand where
[13:04] Then we can switch to the flame graph view. It also shows this in a more condensed way. It's not from 0 to the end of the request anymore. The same span happening multiple times gets aggregated, so it's a bit easier to
[13:18] visualize. And then lastly, because we triggered this ourself um as a developer, there's also the call graph available where we can see and deep dive into the performance based on
[13:31] the individual function calls. So here we can see curl exec and this relates as we can see curl exec and this relates as we remember to the geo light HTTP call that we had 52% of the time. So it's a different way of representing the same
[13:45] different way of representing the same thing, the PHP function call or the HTTP call represented as a span. We can search here for different things for example Shopware and we also see all calls from Shopware
[13:58] namespace. Maybe we can search for third-party plugins for example to find problems there. So we are the Tideways vendor. There we can see the geo locate listener on HTTP cache
[14:12] key event. So this one is the responsible to call geo locate and then responsible to call geo locate and then we can see it's called Guzzle here. So jump through the profiler and there's also the possibility to see
[14:29] and there's also the possibility to see this as a call graph visualized. So here we can see geo locate listener is highlighted at the moment. This traces down to curl exec at some point but also we can see where that's coming
[14:44] from. We can go back the stack up to the top and understand how our request This was a speedrun of four different PHP based profilers, three of them open PHP based profilers, three of them open source, Xdebug, HHprof and SPHPSBX
[14:59] and also my product Tideways. I hope you now have a good picture of what you can do with the different profilers, the benefits they have in visualization, the downsides if you can use them in production or not and I would be really
[15:12] happy if you give Tideways a try. You can find a link for a 14-day free trial can find a link for a 14-day free trial in the description. Bye.
⚡ Saved you 0h 15m reading this? Transcribe any YouTube video for free — no signup needed.