
247% Return in 20 Days? Insane Strategy!
45sExtreme return claim (247%) immediately grabs attention, especially in a volatile crypto market.
▶ Play Clip"Title promises a profitable crypto trading strategy and delivers detailed steps and real contest results."
A trading contest with over 400 participants and $23M in volume ended with Bitcoin nearly flat. The speaker's strategy generated 247.76% returns for the top two teams. The video explains the strategy step-by-step, provides real trade examples, and shares advice from the top performers.
Over 400 traders participated, generating $23M in volume. Bitcoin rose max 6.25% and closed only 0.20% down during the 20-day contest.
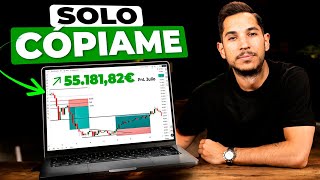
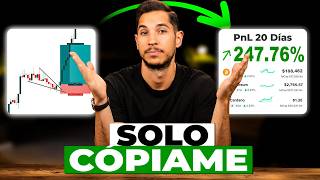
The speaker's strategy generated a 247.76% return for the top two ranked teams.
Two teams were created on different exchanges (Blin and Vitmart) with 153 and 124 traders respectively, plus ~125 not in Telegram groups. Trading ran from July 10-31.
Over $5,000 in cash prizes, all-inclusive trips valued at $1,000, funding accounts up to $100,000, and educational prizes including one-on-one mentoring and full access to Trading Lab.
The same strategy earned the speaker $55,000 trading Forex and 14.7% in one day trading crypto. Seven of the top 10 contest participants used this strategy.
Markets move up, down, or sideways. Uptrends consist of impulses and pullbacks with higher highs and higher lows. Downtrends have lower highs and lower lows.
Cryptocurrencies are unregulated, leading to scams and high volatility. They often correct very little or too much but continue the trend.
Patterns repeat across all timeframes. The same patterns appear on daily, hourly, and 5-minute charts.
A trading strategy has four components: a pattern that repeats, a set of rules, and a mathematical advantage. The pattern should be the most repetitive in the market.
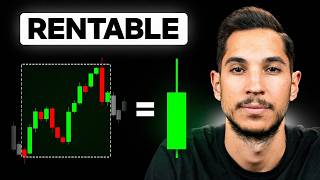
The most repetitive pattern in crypto is a sharp rise, slight pullback, and continuation, or sharp rise, deep pullback, and continuation.
Step 1: Identify support/resistance on daily chart. Step 2: Look for breakout/upturn on daily. Step 3: Confirm higher highs/lows on 4-hour. Step 4: Find pattern (wedge/triangle/channel) on 1-hour at Fibonacci 0.5-0.75. Step 5: Trend reversal on 5-minute with 50-period MA break. Step 6: Stop loss below last valid Fibonacci level, take profit at previous high or dynamic.
Similar steps reversed: resistance on daily, deceleration/downturn, lower highs/lows on 4-hour, pattern on 1-hour at Fibonacci 0.5-0.75, trend reversal on 5-minute, stop loss above Fibonacci, take profit at previous low.
Manel (186.27% return) emphasized consistency, discipline, and emotional control. Ivania (61.49%) stressed being structured, not trading on impulse, and sticking to a plan.
Pau and Rafa also achieved profitability and funding after joining Trading Lab, highlighting the importance of community and structured training.
The video demonstrates a repeatable trading strategy that produced exceptional contest results, emphasizing pattern recognition, Fibonacci levels, and strict risk management. Success stories from top performers underscore the value of discipline and community support.
What was the total volume generated in the trading contest?
More than $23 million.
What return did the speaker's strategy generate for the top two teams?
247.76%.
00:29
What are the four components of a profitable trading strategy according to the video?
A pattern that repeats over time, a set of rules applied to the pattern, and a winning mathematical advantage in the long run.
09:44
What are the two variations of cryptocurrency market movements described?
1) Big impulsive move, small pullback, big continuation. 2) Big impulsive move, big corrective move, big continuation.
08:06
What Fibonacci levels are used for entry in the strategy?
Between 0.5 and 0.75.
17:10
Where is the stop loss placed in a long trade?
Below the last valid Fibonacci level (e.g., 0.618 or 0.75).
19:08
What pattern is looked for on the 1-hour chart before entry?
A continuation pattern such as a wedge, triangle, or channel.
16:40
What did Manel emphasize as key to profitability?
Consistency, discipline, and emotional control.
29:14
What did Ivania say about being structured?
You have to be very structured, not trading on impulse, and stick to your plan.
31:16
What is the first step in the long trade strategy?
Identify a support/resistance zone on the daily chart.
14:20
247.76% Return
Demonstrates the strategy's exceptional performance in a real contest.
00:29Strategy Consistency Across Markets
The same strategy works for Forex, crypto, stocks, and indices, proving its robustness.
03:18Four Components of a Trading Strategy
Provides a clear framework for what makes a strategy profitable.
09:44Core Pattern for Crypto
Identifies the most repetitive pattern in crypto markets, forming the basis of the strategy.
11:22Manel's Advice: Consistency and Discipline
Real-world testimony from the top performer emphasizes emotional control over intelligence.
29:14[00:00] few days ago a trading contest ended in which more than 400 traders participated and in which a total volume of more than 23 million dollars was generated. And despite less than ideal market conditions, during
[00:16] the 20 days of the contest, Bitcoin rose by a maximum of 6.25% and ended up closing only 0.20% down. My strategy, the strategy that I will develop below,
[00:29] generated a return of 247.76% just among the first two ranked teams. yet enriching, as I will explain the rules of the contest so that
[00:42] you quickly understand how everything worked. I will explain step by step how my cryptocurrency trading strategy works that has generated this great profitability. I'll give a couple of real trading examples and finally
[00:57] the most important part of the video. I will summarize the trading advice of Manel and Ivania, the two people who have obtained the highest profitability in the contest. Anyway, I'll leave the chapters in the video playback bar
[01:10] so you can move forward or backward depending on what interests you most pinned comment and the description of the video itself, you will find other links of interest, courses, tutorials, training, and a short video in which I
[01:25] show you a day of my live trading using this strategy so you can see how I earn a 14.7% return in less than 24 hours.
[01:39] return in less than 24 hours. [Music] simple contest. Two separate teams were created , distributing the people across
[01:54] two different exchanges. They could choose which way to go. And we did this simply to create a competition between the two exchanges. In addition, two Telegram groups were created . There were 153 people in the Blin group
[02:08] and 124 in the Vitmart group. This totals 277 traders, but there were about 125 who did not join the Telegram groups. From this point onwards, from
[02:21] July 10th to July 31st, it was possible to operate freely. Each trader could choose the strategy, the method, the leverage, the cryptocurrencies, and so on. The competition has obviously already ended.
[02:34] However, the prizes were both monetary. Here we can see more than $5,000 in prizes, all- inclusive trips valued at $1,000, funding accounts of up to $100,000, and they were also educational. We offer personalized one-on-one mentoring
[02:50] with me and full access to Trading Lab. Trading Lab, for those who don't know, is a trading training program where I,
[03:03] trade exactly as I do. There I teach the trading strategy with which I earned more than $55,000 trading Forex. The same one with which I earned that 14.7% in one day trading cryptocurrencies. The
[03:18] same one with which, despite not being allowed to participate in the contest, by operating for only one day I placed fifth in the ranking of the contest itself, and the same strategy that both Manel and Ivania have followed in the contest
[03:32] to win 186.27% and 61.49% respectively. In addition to the 400 participants, if we focus on the
[03:44] top 10, seven of them used the strategies I use and also teach at Trading Lab. So, as you can see, what I'm about to discuss works. These are profitable trading strategies that not only win
[03:57] cryptocurrency trading contests, but also work for trading currencies, stocks, indices, and so on. And on the channel I have thousands of hours of 100% free content, but
[04:10] nevertheless there will be people who want to learn not only with free content, but also want support, live streams, a community that I'm keeping an eye on etc., etc. Well, that's perfectly legal. So, for anyone
[04:24] interested in that much more personalized follow-up from me and pinned comment and the video description below. through a 4-minute video about what Trading Lab is and what we
[04:39] do there, in case you're interested. And at this point, I'm going to explain the basics of the trading strategy so that we can gradually move towards the next section, in which I will develop each and
[04:54] every one of the rules step by step. So, starting with the basics, the first and most important thing is to understand exactly how the market moves. This seems obvious, quite logical, but many people overlook it
[05:09] and don't focus on the simplest things. And the market obviously moves up, down, or horizontally. If it moves upwards, it's an upward trend. If it moves downwards, it's a bearish trend. And if it
[05:21] moves horizontally, it's a range. The thing is, when it moves upwards it doesn't move like that, it moves through impulses and pullbacks, that is, through increasing highs and lows. When it moves downwards, it doesn't move
[05:35] pullbacks and decreasing maxima and minima . And when it moves within range, well, it doesn't move like that either. It moves, therefore, without the possibility of forming those increasing maximums and minimums. This is the most basic and simplest thing.
[05:50] Because? Because later, when we talk about strategies, understanding this will be absolutely crucial. And now you're going to see it. In any case, what see it. In any case, what we can do is summarize, simplify, and
[06:03] reduce the upward and downward trends as much as possible . In other words, when . In other words, when there is an upward trend, we have this. This is the basic guideline. And when there's a downward trend, we get this. The
[06:16] point is that's how everything works. Currencies move, indices move , commodities move, stocks move, and cryptocurrencies move too. The only thing that cryptocurrencies have, like each and
[06:31] every one of these assets, is their own unique characteristics. What are the defining characteristics of cryptocurrencies? Well, cryptocurrencies cryptocurrencies? Well, cryptocurrencies are an asset that is not regulated. The fact
[06:43] that it is not regulated means that there are many people who want to take advantage of the lack of regulation. So that? To create scams, to join groups and make a price go up or a price go down, to launch projects,
[06:59] absorb liquidity and disappear. In short, the lack of regulation leads to a very important point, and that is the following, a key word:
[07:13] know what the word volatility means, but volatility applied to how the market moves means that when there is an upward trend we don't when there is an upward trend we don't move like that, but rather we adapt both the
[07:27] impulse and the pullback to form a movement more similar to this. In other words, cryptocurrencies often either correct very little to continue
[07:39] the upward trend or correct too much, but still continue the upward trend. I'm not going to go into defining the technical details or the basic details
[07:52] a corrective movement can go, support levels, etc., etc. This is not what's appropriate here. There are videos on the channel, entire courses in which I already explain all this, but it 's important to understand this. The
[08:06] cryptocurrency market, despite moving in a way that is more or less similar to what we initially named as the basic pattern, has two variations. Variation number one, big impulsive movement, small pulba, big continuation. And
[08:19] variation number two, big impulsive move, big corrective move, and big continuation. So, you're going to look for these two types of patterns across timeframes. Because? Because the market is
[08:34] fractal. What does it mean for it to be fractal? that everything repeats itself in all time periods. If your trading style is to look for moving average crossovers, they exist in all timeframes. If your trading style is to look for divergences in the RSI,
[08:48] they exist in all timeframes. If your trading style is based on technical patterns like a head and shoulders, it exists across all timeframes. So you'll find these two movements in all time periods. If you don't have
[09:00] time, you'll look for the pattern on the daily chart. If you don't mind too much because you have more time or more flexibility, you'll look for it on the hourly chart. And if what you want is to maximize and
[09:15] seek the maximum profit with the maximum possible risk during a specific time of day, obviously you're going to look for it in 5 minutes, but the point is, regardless, to look for the
[09:29] you'll be engaging in swing trading. If you search for it during business hours, you'll be engaging in day trading. And if you're looking for it in 5 minutes, scalping. This is how it works. The point is that a pattern is not a trading strategy. What is a
[09:44] trading strategy? A trading strategy, let's put it this way, a trading strategy has four components. First, you have to look for a pattern. Second, this pattern has to repeat itself over time. Third, you will
[09:56] apply a set of rules to this pattern, and this set of rules, fourth, will give you set of rules, fourth, will give you a winning mathematical advantage in the long run. This is what constitutes a profitable trading strategy. And
[10:10] of course, what pattern should we be looking for? Because this is the only pattern that exists, the answer is no. There are many types of patterns, as I said, there are patterns or trading strategies that look for a pattern
[10:24] based on indicators, for example, a moving average crossover or as I said, moving average crossover or as I said, a divergence in RS6. There are trading strategies that look for patterns based on technical patterns, for example, double
[10:37] top, shoulder, head, shoulders, etc. There are training strategies that look for candlestick patterns, as they seek to see the price rise strongly, rise strongly and form a high test and a bearish candlestick pattern, and then they seek to execute it. In
[10:52] these types of situations, there are trading strategies that only look for support or resistance levels and aim for the price to break the resistance to buy or break the support to sell. But how does the market move? Let's go back to
[11:06] basics. The market is moving through this here in an upward trend and this here in a downward trend. And the cryptocurrency market adjusts this based on minimum pullback or maximum pullback. So why don't we
[11:22] look for a trading strategy whose basic pattern, which also repeats itself a basic pattern, which also repeats itself a lot over time, is this here? Wait for the price to rise sharply, fall slightly, and continue rising, or rise sharply,
[11:35] fall sharply, and continue rising. This is how cryptocurrencies move. This is how they configure, not a pattern, but their most repetitive pattern. Well, we know that
[11:47] strategy is a pattern that repeats itself over time. We've got it. Perfect. It is cryptocurrencies because it is the one that is most consistently repeated over time in all timeframes. Now, what would be next ? Apply a set
[12:00] of rules that make the trading strategy profitable, because under the sets of rules. So let's see what sets of rules we
[12:12] have to generate these incredible returns, both for myself and for the strategies as me. And next I'm going to teach you the rules of the trading strategy step by step, both long and short, so that there is an example
[12:26] of each. However, I want to make it clear that for me the most important part is the following, the part in which we will be able to hear from Manel and Ivania, two people who a few months ago had no idea about trading and who, after
[12:40] following the rules of this strategy that we explain in Trading Lab, have generated we explain in Trading Lab, have generated returns of 186.27% and 61.49% respectively in just 20 days. I
[12:54] recommend that you don't underestimate the power of community, the power of learning from other results you want to achieve, but not from a point of view like mine, but from a much closer point of view , much more similar to your
[13:08] current characteristics, since it is literally what trading needs and what in trading gives you a start and an incredible improvement, training within a community and within an environment of communication, interaction,
[13:22] questions, answers. etcetera, etcetera. So, with that said, let's get straight to the point. Let's start with a long trade. In this case, it is not a trade that was executed during the contest; it is a trade that has been
[13:34] executed in general terms, but it is not a trade from the contest. The short trade , which we will see later, was indeed within the competition. I'm going starting from scratch, and I'll go through the next one a little faster,
[13:49] but I'll provide the necessary information at all times. First, what graphs do we have? We have the daily chart at the top left, the 4-hour chart at the top right, the one-hour chart at the bottom left,
[14:05] . In each of these graphs we are going to look for a specific type of pattern, behavior, or movement, and we will discuss it daily chart, what we need to find, since we are talking about
[14:20] an area of a buying movement, is a support zone. It's step number one. There are five steps in total. Well, there are six, but the
[14:32] and take profit. So, well, we could say 5 and a half, right? So, point number one, resistance support zone on daily chart. Furthermore, it is not a recent zone, but it is also a previous zone
[14:47] that we can see has acted quite well in the past, both as support and also as resistance, impulse, impulse, pullback and a large continuation, etc., etc. Step
[15:01] number two, we look for a breakout, an upward turn in this daily chart. Here we have the price located above the support zone. It goes up a little, falls, and then starts up again with great force through a large bullish candle on the
[15:16] important? It's important because it gives us a clue that what we can expect over the next two or three days is this right here. Simple. That's it. We just the price is going to do on the daily chart over the next two or three days.
[15:31] Once we have that, we need to find a way to implement it. What is the shape? We now go down to the 4-hour chart. How is the market moving? through rising highs and lows, because what we have to do in an uptrend
[15:44] is look for the break of the previous high. The maximum is not only a zone of highs as such; here we have a clear break of the previous highs, clear break of the previous highs, but it is also a zone of support and
[15:59] previous resistance. Look, if we go back in the 4- hour chart, we see that this chart, what you are seeing here, are . This horizontal line, in the form of
[16:12] resistance and support, also acts in the past. So not only are we breaking the previous high, but we're also breaking a resistance level. This allows us to move on to step number
[16:25] four, which is that on a one-hour chart, I'm going to copy this area from here. What are we I'm going to copy this area from here. What are we looking for? A pattern. A through higher highs and higher lows in an upward trend. Yes, but we are looking for
[16:40] a continuation pattern, whether it's a wedge, a triangle, a channel, whatever, that leads to the next points that I will discuss that we have reached the peak of the momentum, what we will do is mark
[16:55] Fibonacci levels. So that? It's clear we've reached the maximum. We launched Fibonacci. Because? Because what we want to see is that the chart in one hour reaches the following levels, at
[17:10] least the 0.5 level and at most the 0.75 level. This is the area where we will wait for the price. So that? To form or to end the corrective movement and begin the
[17:26] continuation. And what we're going to look for is how to join this continuation before it starts, right? So, once we've marked the level or the area where we want to see the one-hour chart in the form of a pattern,
[17:40] not just any movement will do; we need it to be in the form of a pattern, and we're going to keep reproducing the price. Now we can clearly mark the . And somehow we can mark the
[17:56] bottom part. There it is. It's a kind of wedge, I think it's fine. And the moment we reach those levels, we're already fully in the important zone. eye on the 5-minute chart. Because? Because we will execute the entry
[18:13] the daily chart, the 4- hour chart, and the one-hour chart. We we join this movement, as we are looking for a trend reversal that is already arriving on the 5- minute chart. What is a trend change?
[18:28] A movement in which the price stops making lower highs and lower lows and starts making higher highs and higher lows . Additionally, it needs to break the 50-period moving average in 5 minutes. Hey, I'm getting confused with the steps, I don't know what. Do
[18:42] n't worry. First I'll repeat them later. And second, you pause the video and watch it 100 times. if necessary. Okay, with that said, we've reached the end. We have broken, closed and confirmed, forming a
[18:55] confirmed, forming a trend reversal in 5 minutes. We bought. Where do we place the stop loss? In this buying move. So we're going to put the stop loss buying move. So we're going to put the stop loss below the
[19:08] nearest Fibonacci level. Look, stop loss. What is the nearest Fibonacci level loss. What is the nearest Fibonacci level we have? The level of 0.618. You can see it here in a one-hour chart. We have stayed between 0.5 and 0.618. Well,
[19:21] we put the stop loss down here. If the price had corrected the price had corrected to this point, to 0.75 or half that, where would we have placed the stop loss? Below 0.75. If the price breaks
[19:34] the 0.75 level outside, we are not interested in it at all . But just as there is a stop loss, there is also a take profit. We can set the take profit statically at the
[19:48] previous high, or we can easily elaborate on this now simply because I don't want to go into too much
[20:03] detail or dwell too long on the strategy, but it's very simple. If you want to participate in the maximum possible movement, move the stop loss dynamically. For example, you follow the stop
[20:17] loss and you do it like this, right? You go along depending on whether Because it can get here and not stay here, but continue breaking. However, if you want to exit quickly, leave the stop loss, or rather
[20:31] , the take profit, in a very specific area. I'm going to put a 15- minute chart so that this progresses, or rather an hourly chart so that this progresses faster, because at the beginning it takes a little while to get going. But you can
[20:44] quickly see how the price ends up hitting the take profit right away and not only reaches the initial zone, but continues with the upward movement and in this case it would have generated a profit with this position size and so
[20:58] profit with this position size and so on of 13,524. the position size is huge, but it's a benefit that would have to be adapted to each person's situation. The point is this, I repeat very quickly, and we move
[21:14] directly to short trading. First, support and resistance on the daily chart. Second, deceleration and upward turn. Third, increasing maximums and minimums in 4 hours. Fourth, wedge, triangle or channel pattern on an hour to
[21:29] triangle or channel pattern on an hour to Fibonacci levels between 0.5 and 0.75. Fibonacci levels between 0.5 and 0.75. Fifth, breakout and trend reversal in Fifth, breakout and trend reversal in 5 minutes. Sixth, stop loss below
[21:41] 5 minutes. Sixth, stop loss below the last valid Fibonacci level and take profit according to what each one considers. short trade. I don't think I've mentioned this before, but if you're wondering, there are several
[21:55] moving averages. You only need to pay attention to the ones in red. They are the exponential moving average of 50 sessions. The lilac one we have here isn't necessary; it's for other strategies I have, etc.,
[22:07] etc. And again there are several lines here, but that's the subject of other trades. Don't pay any attention to him either. So, to get straight to the point, we're going to teach the support or resistance zone on
[22:21] daily chart. Here we have it quite clear and quite simple. The previous trade was in Ethereum, this one is in Cardano. Second, what are we looking for? Deceleration and turning, movement in the
[22:33] opposite direction on a daily chart. Here we are starting to slow down as support, sorry, resistance. It looks like the daily chart is starting up and will continue, but regardless , look, it's rising very
[22:47] strongly. What ends up happening is that it completely reverses and begins a downward movement. And that's exactly what we need. Notice that what appeared to be a large bullish candlestick actually turns out to be a new
[23:01] a new deceleration candlestick, causing the price to start going straight down. We are seeing it in a much more developed form on the 4-hour and 1-hour timeframes, where the
[23:15] price is already starting to break out of the moving average and is even starting to break out of this kind of diagonal, etc., etc. Perfect. start the downward movement. I'm going to
[23:28] put this on a 15-minute chart to make everything a little faster, 5-minute chart, we're going to be very slow. And here we have the break. Perfect. We are breaking out because step number three is decreasing highs and lows
[23:45] on a 4-hour chart. Notice that in this area here we had the previous lows and in 4 hours we first formed the decreasing low, so we already have a trend reversal in place. Now
[23:59] remember, all we need to do is wait to see that the hourly chart stops falling, which it seems to have already stopped falling. Mark Fibonacci levels from the highs to the lows. Here we have a
[24:12] first impulsive move, a pullback, and a large impulsive move that breaks through, and then we wait for a pattern to form. Pattern of what? We don't care, wedge, triangle, or channel. It has to be a corrective pattern that allows us to
[24:28] understand that the price is most likely going to continue falling. At the moment we are getting there, although we have not yet reached, by the way, the levels we are interested in when entering are 0.5 and 0.75 Fibonacci. We could
[24:45] already set the pattern. I can see the top part more or less clearly. I more or less clearly. I can't quite see the bottom part clearly yet. We just focus or reach the levels. Perfect. The price is
[24:58] starting to fall, but I still don't see the pattern on the hourly chart. The top part is clearer to me, something like this, but the bottom part is too broad, it's not the pattern, it's not right. If the price
[25:11] rises further from here, the pattern would be this. Then we would have it, or we this. Then we would have it, or we way, wouldn't it? We see the pattern. Okay, perfect. What we need to confirm is
[25:28] the lower part, which is not yet fully confirmed, to be honest. It has improved a little, but it's not enough. Yes, now I'm seeing things much more clearly. Okay, sorry, that slipped my mind . Okay, now it really would
[25:40] be the "Now it's really happening." See? Now we have a clearer understanding of the pattern. Something like this. So. Good. Perfect. Now we really have it . In this case, the principle is not entirely clear because I
[25:54] believe this is not part of the pattern. We start here, the top part, the do now? Simply run the graph for 5 minutes, this is 15. We go back to the CCO one and obviously it has
[26:08] escaped us, but well, we'll show it. The moving average breakout also occurs here , etc., etc. In 5 minutes we're going to push it back a little more. We would enter more or less this way .
[26:22] Let's go to sell. Good. And where does the stop loss go? Well, we 've settled on 0.618. Let's set the stop loss at 0.75. We must always protect the next level. The take profit, well,
[26:37] we're going to do the same thing again, we're going to set it at the previous lows. This is not the previous minimum, it's a little lower here. Okay, perfect. Yes, that was fine. Okay, so this is the
[26:51] entry point. We just keep playing. We'll put it back on in 15 minutes. There it is. And we keep seeing how the price keeps falling, falling, falling. I don't know exactly at what point or how long it
[27:05] know exactly at what point or how long it takes to reach the take profit, but it seems to be falling quite sharply and that it's going to fall quite quickly. There it is, the take profit. And
[27:18] obviously the entry rules are exactly the same, but in reverse. , as I mentioned, we look for decreasing ones. Instead of looking for support on a daily chart, we look for resistance. Simply
[27:32] change and reverse the type of tool we are going to use. And now we are going to hear the testimony in the form of two or three sentences from each of them, since we have interviewed them about how the two
[27:47] people with the highest profitability within the competition were able to obtain those returns, but not based on what strategies used, what concepts or anything. These are the concepts. The point is, what has your experience been?
[27:59] Where did they come from? What were they looking for? How have they organized themselves? That is , real elements that can help you all to resemble their situation as closely as possible. And what I want to do is introduce you to both
[28:15] Manel and Ivania. In Manel's case , as I mentioned, he has obtained , as I mentioned, he has obtained a return of 186.27%. She has been at the academy a little longer than Ivania and has
[28:30] even been coming to the in-person events that we hold twice a year. return of 61.49%. He is a person from Latin America who does not
[28:45] have the same ease as Manel in attending face-to-face events, but by taking full advantage of all the resources we offer in the training, he has been able to be profitable trading.
[28:58] I discovered the world of cryptocurrencies about 3 years ago, I fell for many scams, I learned a lot from my mistakes and only recently could I say that I am becoming profitable, so it has been a long road, almost 3 years. To
[29:14] see results, obviously you need consistency, discipline, and to control your emotions, right? Like, if things go badly or you lose everything,
[29:27] try again and again and again until you can achieve good results, because in the end it's about being consistent. And in the tournament I got being consistent. And in the tournament I got second place in profitability with 68%
[29:40] and fourth place in the overall tournament which is both volume and profitability. is both volume and profitability. Second with 68%, which is easy to say, in
[29:52] Second with 68%, which is easy to say, in days it was 20 days if I remember correctly what you days it was 20 days if I remember correctly what you have been in. Well, what this experience, after all your journey, participating in a tournament,
[30:06] reaching the ranking, what lessons do you take away as a trader? Hmm, we have to try. At first I wasn't very convinced about the tournament, but then I said, "No, I mean, I'm going to try it, it doesn't matter if I do
[30:21] badly, because I'm going to learn something." So you're welcome , I tried. I said, "I hope to win an award, to be among the top five." Uh, I didn't want to win either. It was like, "Okay, I'm going to make a few trades, but make sure they're
[30:36] a few trades, but make sure they're good ones," and that's what I did. So, if I had made more trades, I think I could have gotten into a better position, but I didn't want to make too many out of
[30:49] make too many out of desperation and end up worse off. In other words, you arrive here already profitable at the start of the tournament, after your work during this time and maintaining consistency. So, what did you do
[31:03] to achieve that profitability? What helped you take the step, right? participate and, well, surprise yourself with what you just said. You yourself with what you just said. You have to be very structured, like not
[31:16] doing training on impulse, because many people say, "Oh no, now I have to get in, let's put in more and open another position," and they get carried away by emotion. In the end, I feel that you don't have to be that intelligent to be
[31:32] profitable; it's very emotional, very emotional to be structured, to stick to your emotional to be structured, to stick to your plan. If you have good macro analysis, you'll understand that Bitcoin, for example, was in a bullish cycle, and
[31:46] you could have taken advantage by opening long positions and keeping a cool head. So, that's what being structured is: keeping your emotions under control and being consistent. That's the key. And discipline, obviously.
[32:02] And the best part is that Manele and Vania aren't the only success stories. I can also tell you about Pau, who started training with us. After two months, they convinced him to go to another training program, and when he saw what was out there, he came
[32:15] back quickly, got his act together, and for months now he's not only been profitable, but he's also making monthly withdrawals from his $100,000 account. And what's happening is that I've I've done various training programs, but each one only gave you
[32:29] training programs, but each one only gave you the bare minimum for that type of trading. Of course, you were leaving a lot behind. And thanks to Trading Lab, I gained a much broader understanding of the market. The amount of
[32:43] the market. The amount of information available is very comprehensive, and this also allowed me to properly establish some rules because, ultimately, everyone knows about support and resistance levels,
[32:57] diagonals, and indicators, but you need indicators, but you need order, structure, and reasons for acting a certain way. The
[33:10] moment I joined Trading Lab, I started applying these principles. And from there, I began to see very positive progress, right up to today, where I'm currently funded with one account, opening a second account
[33:26] one account, opening a second account after completing the first phase, and therefore experiencing the progress I'd been seeking for so long. Or take Rafa, who, after watching several of my YouTube videos,
[33:41] decided to join Trading Lab. He just increased his funding to $100,000 and has been withdrawing money for months. I mention being in the academy When I started studying this seriously, I mean, it goes to... Well, after about a
[33:57] year, I had... I mean, I funded the first account, and then it's been... well, looking back, it's been a quick process. In the following six months, there have
[34:11] quick process. In the following six months, there have been quite a few approved accounts, and some burned through too, but I see that the capital is definitely growing, right? The funding. I have more and more funded accounts, and in the
[34:29] have more and more funded accounts, and in the end, I manage to ensure that end, I manage to ensure that the accounts I'm the accounts I'm buying are funded with money
[34:42] funded, and that's what allows me to grow them as well, although these aren't the only ones. We have dozens of recorded video testimonials and dozens of positive reviews on Trustpilot. So, below in the
[34:56] video description, I'll leave you a link explaining exactly what Trading Lab is in four or five minutes, since we don't just have an academy, we have a community, we hold in-person events, We have voice chat rooms, we do
[35:11] daily live streams, we correct trades, we have exams—it's a huge academy made up of tutors, mentors, myself, of course,
[35:23] technical staff, tech staff, 35 people on the team, and the only thing we want is the same thing: for everyone who trusts us to have the best possible experience. You'll
[35:36] best possible experience. You'll video description. However, if you want to continue learning for free, perfect, I encourage you to do so. This channel is made by and for you,
[35:49] so that everyone who wants to or ca n't afford training can learn 100% free of charge, since the content here is of much higher quality and quantity than what you'll find in any
[36:03] other Spanish-language training program. So, in addition to the link with information about Trading Lab, you'll also find other links of interest such as courses, tutorials, and training programs—as I said, all 100% free content for you.
[36:15] Continue learning without needing to invest your money. I'll leave this video liked it, and that it was helpful, which is the important thing. If so, like, subscribe, share it with friends and family, and I'll see you in the next
[36:28] video. Goodbye. [Music]
⚡ Saved you 0h 36m reading this? Transcribe any YouTube video for free — no signup needed.