
Tokyo's Low Volatility: Small Timeframes
54sReveals a counterintuitive trading insight that Tokyo moves only 15-20 pips, making small timeframes essential for profits.
▶ Play Clip"Title accurately describes a profitable Tokyo strategy; content delivers on the promise with clear rules and examples."
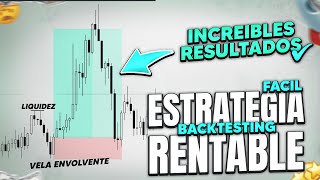
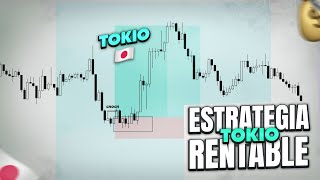
This video presents a profitable trading strategy specifically designed for the Tokyo session on the Tokyo Kilson Exchange, using small timeframes (5-minute, 3-minute, and 1-minute) to capitalize on the session's lower volatility. The strategy focuses on identifying structure breakouts (BOS/CHoCH) on the 5-minute chart, key imbalances on the 3-minute chart, and confirmation entries on the 1-minute chart using a 'checkmark plus imbalance' pattern.
The strategy uses three small timeframes: 5-minute, 3-minute, and 1-minute. This is because the Tokyo session typically moves only 15-20 pips, requiring smaller timeframes to capture moves.
On the 5-minute chart, look for a structure breakout: a BOS (Break of Structure) for sell signals or a CHoCH (Change of Character) for buy signals. Mark the structure using impulse and retracement swings.
On the 3-minute chart, identify clear imbalances (FVG) where price is likely to react. Focus on imbalances formed by impulse and retracement moves.
On the 1-minute chart, confirm the entry using a 'checkmark' pattern (impulse, retracement, impulse) combined with an imbalance. Entry is taken when both conditions align.
Use a minimum stop loss of 1 pip (1.5 pips recommended) and target a 1:3 risk-to-reward ratio (1 TR). The strategy aims for consistent small gains.
In the examples shown, the strategy achieved 9% profit in two days using multiple trades, demonstrating its effectiveness in the Tokyo session.
The Tokyo session trading strategy using small timeframes and structure breakouts with imbalance confirmation can be highly profitable, as demonstrated by the examples. The presenter encourages backtesting and offers mentorship for deeper learning.
What are the three timeframes used in the Tokyo trading strategy?
5-minute, 3-minute, and 1-minute.
01:21
What does BOS stand for and what does it indicate?
BOS stands for Break of Structure; it indicates a sell signal.
02:16
What does CHoCH stand for and what does it indicate?
CHoCH stands for Change of Character; it indicates a buy signal.
02:16
What is the typical pip movement range for the Tokyo session?
15 to 20 pips at most.
01:50
What pattern on the 1-minute chart confirms an entry?
A 'checkmark' pattern: impulse, retracement, impulse, combined with an imbalance.
05:09
What is the recommended stop loss distance for this strategy?
Minimum 1 pip, preferably 1.5 pips.
14:57
What is the target risk-to-reward ratio for trades in this strategy?
1:3 (1 TR).
15:27
What percentage profit was achieved in the two-day example?
9%.
23:35
Tokyo Session Volatility
Explains why small timeframes are necessary: Tokyo moves only 15-20 pips, unlike London/New York.
01:50Structure Breakout Definition
Clear distinction between BOS (sell) and CHoCH (buy) as entry triggers.
02:16Checkmark Plus Imbalance Entry
Combines two confluences for high-probability entries on the 1-minute chart.
05:09Stop Loss Discipline
Emphasizes tight stop loss (1 pip minimum) to manage risk in low-volatility session.
14:57Example Profit: 9% in Two Days
Demonstrates strategy's potential with real trade results.
23:35[00:03] profitable strategy for trading in Tokyo, specifically on the Tokyo Kilson Exchange. That the Tokyo Kilson Exchange. That
[00:15] same thing," since they couldn't trade on New York or London time zones because of work, their country's time zone, or whatever. And today, I'm bringing you a totally profitable strategy that you can use on the Tokyo Kilson Exchange. Before we
[00:28] can subscribe, leave a like, and comment. It really helps me a lot. Please subscribe; it's totally free and it helps me tremendously. And comment on videos would you like me to make? I'll be reading and responding to all of them. If
[00:40] you want backtesting of this strategy, let me know so I can bring it to you. my Instagram is in the description. You can follow me there to find out about all the news regarding upcoming videos and much more.
[00:53] And my Telegram group—yes, we 're almost there! 1000 people, yes, a group of Trading Titans where I announce many, many things and send my analysis, my entries, etc. So you can join, it's totally free.
[01:07] Let's close it here. Perfect, the link is in the description. So let's the link is in the description. So let's quickly get to the video. First of all, to use in this strategy. First, let's write this down: we
[01:21] First, let's write this down: we have 5 minutes, we'll capitalize the first timeframe, 5 minutes. Let's go to the second Let's go to the second timeframe, 3 minutes. We're going to use
[01:35] very, very small timeframes. And the third timeframe is one minute, since Tokyo has the specialty of not moving much, not being so volatile. Yes, for example, New York and London usually move about 40 pips, 30 pips, sometimes 60,
[01:50] move about 40 pips, 30 pips, sometimes 60, 50, and Tokyo moves from 15 to 20 pips at most. Since it doesn't have that much volatility, we're going to use smaller timeframes for buying, selling, buying, selling, buying, selling. Yes, so
[02:03] let's write down what we're going to look for in each timeframe. In the 5- minute timeframe, we're going to look for... let's write down two things here: first, a breakout A
[02:16] breakout A structure breakout can indeed be a Boss or a Ch to help us understand where we are
[02:30] in a buy or sell position. If the price is coming down and does this, it's all Bosses. Perfect, we're looking for a sell. If the price does this here, it does this breakout, this is a Ch. So we're looking for a buy. It's that
[02:44] simple. Let's run to look for? We're going to We're going to mark the
[02:58] mark the structure with the price's highs and lows. structure with the price's highs and lows.
[03:10] in completely. Notice how we're going to mark the structure in the following way. It does, for example, this, for example, a Ch. Let's say it does this Ch, and we're going to, as I've explained in many videos, impulse,
[03:23] retracement, impulse, impulse, retracement, impulse. This is my high, this is my low. That's the structure where I have, where I have, according to Smart Money, an extreme, and this is what they call a decision. But this is a very, very clear structure. It's
[03:37] understood. If it were all bearish, there's a Boss, for example, something like this. We have Boss, Boss. Okay, we look for what our last structure is up to the beginning of the retracement. So we have impulse, retracement, impulse. We have our high,
[03:53] our So, at a minimum, we're looking for sales in these zones. Yes, that's how we're going to define our price structure. Now, let's go to the 3- minute timeframe. What are we going to look for, Pedro? In 3 minutes, we're going to look for
[04:09] Pedro? In 3 minutes, we're going to look for put it in capital letters—where the
[04:23] For example, we have this in 5 minutes: maximum, minimum. Now we go to 3 minutes. We're looking for clear imbalances. Yes, where there's impulse and retracement. Yes, because there millions of imbalances. The most important are the
[04:38] does that, for example, there's a clear imbalance here too, which is my extreme. If it does something like this here, here I have another imbalance. Yes, in impulses examples in the market, much simpler, but in 3 minutes we're going to
[04:54] the price can react, which are the imbalances. Yes. And now, what do we do in one minute when the price reaches those zones? We're going to those zones? We're going to confirm the
[05:09] confirm the entry. We're going to put in a... Minute, the topic of confirmation, what way do I recommend? The main I recommend? The main checkmark plus
[05:24] checkmark plus imbalance, with this, they work perfectly. If implementing the checkmark with imbalance, what does that mean? Let's do an example: it makes a snap, impulse pullback, this in 5 minutes. Let's say this in 5
[05:37] minutes, okay. Then what does it do? Let's go to 3 minutes, we mark, for imbalance. We notice that here there's another one that makes the price do this. Here I have another imbalance, etc. The price starts to go down. I see here it doesn't give me any
[05:52] confirmation, and here, for example, what does the price do? It makes the checkmark, we have an imbalance, we would enter a buy here. That's how we're going here. That's how we're going to trade in the Tokyo Kilson. Let's
[06:04] see two examples in the market now so you can adapt the strategy. And if you want a slightly deeper backtest of three or four weeks, ask me in the comments. So let's go directly to the chart. Before continuing
[06:16] with the video, I want to tell you all the information about the group mentorship in November 2023. That's right, new spots have opened up for people who want to join in the month of... November to the group mentoring I give. Remember that we've already been
[06:29] mentoring for two months; we started in September and also did it in October. We have more than 20 students and we're all fully engaged, and new spots have opened up for tell you all the information. First, we have the topics here:
[06:43] Killson, advanced liquidity, plus UX inductions, plus imbalances, Boss and Choch rules to enter the market with my strategy, plus what my personal strategy is, the rules it has so you can
[06:57] use it, and how, and some examples in the market. Remember that we've been at in the market. Remember that we've been at more than 40% with the strategy for 8 months, and I show it on YouTube, Telegram, everywhere. We're going to achieve 40% in
[07:12] everywhere. We're going to achieve 40% in just 8 months. Then I'll tell you about my trading plan, plus the risk management I use, psychology—a very important concept; 80% of the results come from psychology—and training
[07:25] journal. Notice that there are concepts that are fairly easy or that I've explained on YouTube: ordb, imbalance, liquidity, voos, chch Et cetera. In the mentorship, we're going to polish them 100%. There are things I don't explain for free, and in the mentorship,
[07:39] free, and in the mentorship, each concept will be covered in its entirety so you understand it completely. Then, we have two classes here where we'll be developing ourselves personally, talking about daily habits, how to achieve goals, the
[07:51] law of attraction, visualization, books I recommend, and much more. recommend, and much more.
[08:03] students are sharing their habits, I'm sharing mine, and we're all fully committed to these two Personal Development classes are very important. Then, you'll have the benefits here: first, an exclusive lifetime group. You'll have
[08:18] a Discord group where you'll be for life. You don't need to pay monthly; with this payment, you can join and stay for life, be in the next mentorships and classes. Yes, and you're in the
[08:31] times as you want without paying anything else. The classes attend the class for any reason, the class is recorded and uploaded to a Telegram channel where you can watch the classes as many times as you want. You'll
[08:47] also have access to the recordings forever. You'll have direct contact with the educator; you can ask me any questions directly. There will any questions directly. There will
[09:02] Personal Development and the 8 on Trading), we'll have an exclusive session where you can ask me questions answer all your queries and doubts so you're completely clear. Then we'll hold a raffle for
[09:15] a $10,000 funded account valued at $100. I'll provide the $100, and the winner can buy a $10k or $ 5k account, spend the $100 however they want, or keep it. Yes, that's up to the winner. But we'll be raffling off
[09:30] 100 funded accounts valued at $100. We held the same raffle in October, we'll repeat it in November, and more raffles are coming soon. So, if you join in November, you'll be able to participate in the
[09:43] raffles for December, January, and February. The mentorship price will increase in December, January, and February, so the student, they'll be able to share their screen and ask questions in class. Yes, that's no
[09:58] screen, show me any questions or doubts they have about a particular topic, and I'll answer them without any problem. Then we have some student results here. Look, these are results taken from Discord.
[10:11] Winning entries with my strategy that they've used. A sale, a purchase. Look here, purchases, a 1 to TR, it can go a 1 to C. The operation was sent here by Jorge, Marcos, Diego, Richo. Look how the students are sending
[10:26] more results from the students. Euro, dollar 13, another 1 TR. We have a little entry here too, a purchase. More results still, we have here Jorge, a little purchase in the dollar 3% that He sent it here and also here. Another person, another student, sent me that he
[10:42] was also at work and was able to make this sales entry. Yes, while working, he was able to make it and earn 3% to his account. Then, what do we have to
[10:54] A total of 11 classes for a value of $150 for the moment. Soon it may increase in the mentorships of December, January, and February, as I said before. So, stay tuned for that, but today it costs
[11:08] $50. Payment methods: remember, you have cryptocurrencies: Bitcoin and US Dollars, Mercado Pago for those who are from Argentina, or Western Union if you don't have cryptocurrencies. And finally, we move on to the last slide where it is extremely
[11:23] important that the start of the class will be on Monday, November 13th, at least. That's why you have Monday, November 13th, at least. That's why you have almost a month registration deadline will be the same day that the classes start,
[11:36] day that the classes start, November 13th. Look, today is the 17th. So you November 13th. Look, today is the 17th. So you have about 26 or 27 days to join. You have plenty of time, so don't worry. That and the schedule.
[11:48] Classes are Mondays and Wednesdays at 9 PM Argentina time and Saturdays at 11 AM. If you can't attend live, the classes are recorded and you can watch the recordings as many times as you want. So that would be all. I'll leave you with the video. Excellent, let's go with the
[12:02] first example. So, notice what a breakout is doing here. If this bearish breakout, it's clearly indicating sells. We're on a last impulse retracement. What is this? An impulse retracement and a
[12:18] start retracing. Okay, so our high, our low is this, and our high is this one here. Okay. This is our strategy. What do we do now? 3 minutes. Very, very simple. In 3 minutes, we're going
[12:34] to look for imbalances. First, the extreme one is always marked. Yes, we're going to do it understand it 100%. Then remember, impulses and retracements are important imbalances. We know the price... an impulse, impulse, impulse, impulse, impulse...
[12:48] important imbalance is this. Always remember that. So, for now, we only have two zones. Yes, two zones. Only because these are imbalances and they are important. We don't have any further down because they are all here.
[13:03] mitigated, clearly. It's more than clear. So we have two zones of possible sells. We're going to advance the price until it reaches the zones. Let's go for that in 5 minutes. Look what happened here: impulse,
[13:17] retracement, impulse. Very simple. We have the simple choke, and what do we have here? Impulse, retracement, impulse. Let's see when it starts to retrace. Nothing yet, nothing. Well, there we have
[13:32] yet, nothing. Well, there we have our new one. Look. This is like this. Like this, like this, like this, and like this. So our minimum is this, and our maximum for now is this. We're going to look for a sell here, but we're also going to position ourselves to buy or look for
[13:46] buying opportunities. Yes, so we're going to eliminate this. We have our minimum, our maximum. Look how simple it is to apply. We're going to look for an imbalance in 3 imbalance. We don't have one. It's all mitigated. Well, if the price goes down to
[14:01] here, we have a buying opportunity, but in the meantime, now we've reached this point. Let's go for a minute. Let's look for sells. Let's see what we have. Let's advance the price. Let's see what it does. Watch, watch, pay attention here. It doesn't do
[14:15] any kind of jump or anything. Look what the price did. Hey, let's lock this in here. Point number one, the price reached... let's erase this... our zone is supported. It's supported. Our
[14:30] imbalance has arrived. Okay, it's covered. The imbalance means it can go into selling. So what do we have? Let's confirm in a minute: impulse, retracement, impulse. It gives us the perfect jump, breakout, bearish structure.
[14:42] Point number one, we're looking at where we'll put our sell order looking for is selling in this imbalance. Always remember that too. I forgot to write that down. Okay, now I'll repeat it: a pip minimum stop because it usually has
[14:57] pip minimum stop because it usually has the issue of how it is in Asia, sometimes it gives you 0.5 and clearly that's very little. Minimum one pip, 1.5 is a little clearer, but always a minimum one pip. So our
[15:11] So our main entry would be there, our little sale is there. main entry would be there, our little sale is there. We mark this there. No, here. There it is. This is our main sell and we're going, as we always say, to 1 TR. 1
[15:27] TR, perfect. Let's run this a little bit more. Now we also have a buy. This is about to happen. This is happening precisely, I don't know if it was news, surely, but two important things are happening here: we have impulse, pullback,
[15:42] impulse, semester, our possible buying zone gives us the structural breakout here, here we get the bullish choke, and where we have imbalance here, here
[15:56] imbalance here, here we have our beautiful imbalance, always a pip stop loss at least, and we go to a at least, and we go to a TR. Look, what it does is the
[16:12] buy operation, the sell is already closed, look, it barely reaches it, it barely reaches the 13, it doesn't touch the stop, nothing, the next candle continues, so the 13 clearly touched this operation, let's move it a little more here, and this one
[16:29] entered as a buy, it clearly touched the imbalance, and let's see if it gives us the take profit, and clearly it touches the T-profile, look at three crazy candles. That's right, sometimes it gives us the tap profile, look, let's review it
[16:43] profile, look, let's review it quickly, we had our big boss that I had marked at the beginning, we have our beginning, we have our clear imbalance We looked for a bullish structure in 5 minutes. Yes,
[16:56] also a bullish structure. Yes, but the main thing was always sales. Then it hit the block. We looked for confirmation of the change with an imbalance, simply and we entered our trade. We programmed it. Yes, then if it hits the stop, it hits the stop.
[17:09] Nothing happens. The idea, the idea is always to look at the long term. So, we also had the buy opportunity. The 3-minute imbalance came in and gave us the chance. imbalance and both trades happened. Take profit in both. Let's go to one last
[17:24] perfect example. We continue with the last example I have for you today. Look at the following: we have a breakout of a bearish structure again. All of this is bearish. We are going to mark our structure until we start to
[17:38] see a pullback. Well, here we have our impulse. Because look, we have impulse, pullback, impulse, pullback, impulse. Our last We mark the minimum and maximum. Let's go to the 3-minute
[17:56] imbalance. Of course, here the only one I have is this one here. Perfect. Remember also to think about the buy because what happens here? Look, we... It
[18:08] clearly shows the check, if we have to wait for the impulse, retracement, impulse to mark the the impulse, retracement, impulse to mark the high and low. Now we have the check here, bullish. Let's see, let's go to 3 minutes, we mark our
[18:22] imbalance. Although we still don't have the impulse, retracement, impulse that we would like, look, the imbalance arrived, it didn't give us the impulse, retracement, so for now we don't trade, and well, wait, we are thinking about selling. Yes, here, surely the
[18:35] buy gave us. Yes, let's see it and by the way, we stay a minute for the sell. Look, we had the check and then it entered the structure, we have impulse, retracement, impulse. This is the check that doesn't happen here because this is all
[18:49] this, it reached the point but didn't break, it didn't break, it only breaks here and here we have our imbalance. Here we would have entered and surely the buy would happen because it reaches here, it gives us the 13, more than enough, but we don't enter the trade because as a rule
[19:02] we have to wait for our entry, then the check, impulse, retracement, are always doing. Nothing happens, we follow the price, we follow it, what does it do here, a minute, let's see if in this part there is We'll put a sell signal on this, it's already
[19:18] broken our imbalance. So we'll forget about that. Now that we're looking for a wait for the structure we're looking for: impulse, retracement, impulse. Let's fast- forward a bit. We have impulse, impulse signal for now. Let's see when
[19:32] the price starts to retrace. Only then might it start to retrace here. Let's watch it a bit more. It's still going to retrace now. I see several candles. This is my high and my low is this one
[19:48] This is my high and my low is this one here because it's impulse, retracement, impulse. Perfect. I mark the low. Good. What do we do? 3 minutes. Look how simple it is to We mark imbalances. This is a significant imbalance. Imbalance, imbalance. Just
[20:03] here. No, I didn't get confused. This black candle has an imbalance. Perfect. Remember to also look for sell signals while we're buying. Before it's about to enter. Here we go. One minute. Let's see if it confirms to put the buy signal in.
[20:18] I just got the signal up here. Yes, that's good. They're equal highs. As soon as it breaks, we put anything in. Pulse, retracement. It's going out of the square. No, not yet. Now I'll
[20:30] forget about this. It didn't give me any kind of signal or anything. Let's go. Five minutes to see if we can get a sale here, let's see, wait, this is coming in, look, it's What's happening here is that the impulse, retracement,
[20:44] impulse doesn't make a bearish breakout. We mark the hit; it's very, very simple: a perfect bearish hit. It's all with a breakout, structure, price action, etc. We're going to follow the price until it touches here, and with
[20:59] touches here, and with confirmation, nothing. What do we see here? Oh, before that, we see one last impulse, retracement, impulse. Perfect. We have our low, which for now, well, it can continue to fall, and our high is this.
[21:15] Perfect. We're marking this, at least. Good. Now we're going to the 3-minute chart to mark possible sell spots. Look. Remember that impulses and retracements impulse, retracement, impulse. Here there's a key imbalance. Yes, all the impulses and
[21:31] retracements. Perfect. Then another imbalance. There isn't one directly wait for it to retraces even more. On top of that, it has prior liquidity, so even better. Let's go to the one-minute chart to look for a buy. Here we are. We're not in our
[21:46] main structure. Remember, the head is buys. We're going to follow it and see if we get the hit. No, uh. These are equal highs; it doesn't
[21:58] would enter there with a buy. No imbalance. We follow the price; it gives us the perfect choke, and the imbalance I have is right here. If it touches it, it's
[22:10] clearly a very clear buy. Don't tell me it's going away, and unfortunately, it did. It was a very nice buy. Yes, yes, maybe if we enter in the gap of the imbalance, which is this one, maybe it will give us the entry, but you always
[22:24] enter on the candle that generates the imbalance since the imbalance isn't covered by since the imbalance isn't covered by not touching that candle. So, no matter what we have, guys, we still have the sell, the sell in mind, which is this one
[22:36] here. This imbalance here, we're going to look for confirmation, and if not, we keep waiting for impulse, pullback, impulse. It gives us the choke. Excellent, now we just have to program the operation in our beautiful and divine imbalance here.
[22:52] We place our sell; remember, always a minimum of one pip, and the a minimum of one pip, and the 13
[23:05] price. It enters; see how it makes the entry, on top of that, it liquidates this. Here it comes, touches this part, makes the choke, and then enters the zone with all this previous liquidity. Excellent entry point, and then we'll see what happens. Oh, thank goodness!
[23:20] Remember a pip stop loss. Always. This is very important. Let's see if the Take Profit is the Stop Loss and Take Profit. We're talking directly to the Take Profit 1 to 3, a 3% profit. We ca n't take this one here because of the
[23:35] pullback impulse. So, this one is 3%, and the previous one was 3%, and another 3%, which is 6. 6 + 3 = 9% in just 2 days using a strategy in Tokyo. Look how good this
[23:48] strategy is! It's very, very good and profitable, so apply it. If you want a backup, let me know in the comments. I'll really enjoyed this video, and I'll see you in the next one.
⚡ Saved you 0h 24m reading this? Transcribe any YouTube video for free — no signup needed.