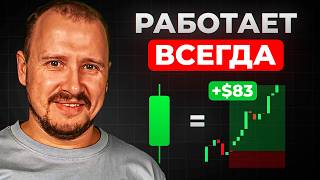

Scalp Crypto with ONE Candle!
44sPromises a simple, fast profit method with minimal risk, appealing to traders tired of complex strategies.
▶ Play Clip"The title promises a scalping strategy using one candle, and the video delivers exactly that with clear examples and a live trade."
This video presents a scalping strategy for cryptocurrency trading that relies on just one daily candle to identify entry and exit points. The trader explains how to use daily highs and lows as key levels, then switch to a minute timeframe to spot reactions and execute short or long trades with a favorable risk-reward ratio.
Scalping involves short intraday trades lasting minutes to hours, reducing exposure to manipulation and news events. The less time in the market, the lower the risk and psychological burden.
Instead of chasing volatile low-cap coins, the strategy focuses on top 50-100 coins by market capitalization (e.g., Bitcoin, Ethereum, XRP) for more predictable movements and better liquidity.
The strategy uses only the high and low of a single daily Japanese candle as support/resistance levels. This avoids chart clutter and provides clear, actionable zones.
After drawing levels on the daily chart, switch to a minute timeframe and wait for a price reaction (e.g., sideways consolidation, false breakout) before entering a trade in the direction of the bounce.
Place stop loss behind a nearby swing extreme (e.g., a 'knee' formation) on the minute chart. Aim for a risk-reward ratio of at least 1:3 or 1:4. Example: $10 stop loss, $40 take profit.
The trader entered a short on XRP using the previous day's low as resistance. The trade lasted 19 minutes with a 1:4 risk-reward ratio, demonstrating the strategy's speed and effectiveness.
The one-candle scalping strategy simplifies trading by focusing on a single daily level and confirming reactions on lower timeframes. With proper risk management and a favorable risk-reward ratio, traders can achieve consistent profits while minimizing market exposure.
What is the main advantage of scalping according to the video?
Short market exposure reduces risks from manipulation and news events, and lowers psychological burden.
00:30
Which coins does the strategy recommend for scalping?
Top 50-100 coins by market capitalization (e.g., Bitcoin, Ethereum, XRP).
02:31
How many candles are used to draw levels in this strategy?
Only one daily Japanese candle.
06:38
What two levels are drawn from the daily candle?
The high and low of the daily candle.
07:10
What must be observed before entering a trade?
A price reaction at the level, such as sideways consolidation, false breakout, or a bounce.
10:53
Where should the stop loss be placed?
Behind a nearby swing extreme (e.g., a 'knee' formation) on the 1-minute chart.
12:11
What is the recommended minimum risk-reward ratio?
At least 1:3, preferably 1:4.
12:53
How long did the live XRP trade last?
19 minutes.
20:28
What tool does the trader use for technical analysis?
TradingView.
05:42
What is the 'knee' formation in candlestick analysis?
A pattern of a red candle down, a green candle up, and another red candle down, forming a turning point.
12:24
Scalping Reduces Risk
Explains the core philosophy that shorter market exposure minimizes risk from unexpected events.
00:30Focus on Top Coins
Contrasts with common scalping advice to chase volatile low-cap coins, advocating for more stable assets.
02:31One-Candle Simplicity
Simplifies chart analysis by using only one daily candle's high and low, avoiding clutter.
06:38Reaction Before Entry
Emphasizes waiting for price reaction at levels, a key discipline for avoiding false breakouts.
10:5319-Minute Trade
Demonstrates the strategy's speed with a live trade that achieved a 1:4 risk-reward in under 20 minutes.
20:28[00:02] to take profits using just one candle. No junk on the chart, just pure price movement mechanics. I'll show you in practice how to find the ideal entry point to close in the plus. My name is Sergey. I am the author of the
[00:17] SRK Crypto channel, a trader and investor with twenty years of experience, disclaimer. There is no financial advice in this video, the risks are on each of us. Let's go. So, what is the advantage of scalping? Why are we discussing the
[00:30] scalping strategy today? The essence of scalping is that we take short movements within the day. That is, transactions can last minutes, sometimes several hours, but we do not sit in a transaction for days. The risks of falling under some kind of
[00:46] manipulation, news are reduced to a minimum. The basic idea is that the longer we are in the market, the higher the risks. The less time we spend in the market, the lower the risks and, to some extent, even the
[01:02] psychological burden is lower. We quickly entered, processed the deal, and exited the entered, processed the deal, and exited the market. We don't sit for days, not monitoring what's going on there, whether it's a drawdown or not , the entire transaction is limited to
[01:14] literally minutes. And now in order. What is the plan of action? What is the essence of the strategy we are discussing today? First, let's start by choosing a coin. Typically, scalping monitors some top coins by growth today,
[01:31] for example, or the top hits. Also, the top coins based on the volume traded per day can be selected. Yes, this makes sense, since, for example, these are the coins that are called coins in the game. They
[01:46] involve the most traders and participants. That is, the movements there are more active, impulsive, and, it would seem, you can work out your deal faster, find some kind of setup. On the one hand, this is true, but on the other hand, more often than not,
[02:00] we neglect some fundamental value of the asset here. That is, most often they take some dubious altcoins, shtikoins, coins with a small capitalization, and the movements there are smeared, chaotic. Yes,
[02:16] the amplitude is large up and down. The coin may fly in well, there may seem to be a lot of movement, but stop losses are easily hit in a jiffy. That is, we can make a lot of deals there within an hour, make a dozen deals there, but most of them
[02:31] will be unprofitable. This strategy, this approach also has a place to be. But today we will go from the other side. We take the top 50, top 100 coins by market capitalization. That is, these coins are the most fundamental on the
[02:46] coin market today. If we look at the Coin Market Cup statistics on this issue, the figures are simply insane . The total number of . The total number of cryptocurrencies tracked is 49 million. A total of
[03:02] cryptocurrencies were created in the last 24 hours. We see Last 24H 62,000. Well, that is to say, it's a complete madhouse. What's happening in the crypto market? The last 7 days, that is, the last week - 362,000 and the last 30 days - 2 million coins. If I
[03:19] understand these metrics correctly, it seems impossible to me to understand them any other way. The numbers are on the screen, but this at least gives reason to think. Therefore, we imagine that out of 46 million coins, there is not enough room on our head
[03:33] . We take this number as the top 50, top 100, that is, the very top in terms of market capitalization. The same Coin Market Cup, cryptocurrency section. Or, in principle, you can already go directly to the crypto exchange.
[03:48] I also use the Bybit crypto exchange for my trading. This is the top crypto exchange in the world. There's a convenient trading terminal, spot futures trading, a variety of earning tools, Spot X, a pre-market, and trading.
[04:03] Copy trading, trading bots. In the Banking section you can open a crypto deposit. You can also open a payment card for yourself, just like a bank card. Only here you can pay for purchases with cryptocurrency.
[04:17] verification in the section "Buy cryptocurrency, [music] P2P trading." You can top up your balance using a bank card or any payment system. card or any payment system.
[04:31] description below the video. Don't miss your chance. And if you don’t understand something, go to the channel, playlists. There's a whole Bybit Bybit training playlist for beginners here. In this playlist, you'll find answers to almost all your questions
[04:45] about the Bybit crypto exchange. It also discusses many ways to make money on this crypto exchange. And here we take the markets section. Uh, in the markets section
[04:57] we need to select spot. And then here we select USDT. We don't have a top list by capitalization as such, but we can filter by 24-hour trading volume . We click on the trading volume here and
[05:11] see that we have a coin in a day whose trading volume even surpasses Bitcoin. Well, if we open the chart, we see that it has no history. That is, they created a lot of hype, yes, some kind of new coin. Naturally, it is better for us to look at the top coins that
[05:26] already have a history. Bitcoin, Ethereum, Sana, for example, XRP, and A is also an old man. Well, yes, here we won’t be able to filter out the top by capitalization, but we can also look at those with the highest coin volumes, just so that they at least
[05:42] have some kind of history. They just have a couple of candles here during the day and that's it. Well, for example, let's move on to Trading View. I often use the Trading View platform to conduct technical analysis. There are many convenient tools here, as well as a
[05:56] huge set of indicators. You can set an alert so you don't have to sit at the chart and monitor the market simulator to practice on history. Here we can assemble a watchchliist. Click the plus sign and enter
[06:11] the name of the cryptocurrency you need in the search box. Next, we click the plus sign opposite and the coin goes to our Watchlist. And this is just a small part of the tools available on the Trading View platform. I'll leave the registration link in the
[06:23] description below the video. And we begin to delve into the essence of the strategy itself. Which particular candle are we interested in? The strategy is based on just one candle, according to which we draw our levels. A common problem for traders is
[06:38] that they can simply slap dozens of levels on the chart if they want. Here the graph will be just a sieve. You can, for example, place a level here, stick a level here, place some here, draw levels. Here too,
[06:54] for example, we have a level here, here, that is, infinity. And at these levels, what to trade and how to trade is absolutely unclear. Therefore, we take as a basis only one Japanese candle from the daily time frame. We have a
[07:10] red and a green candle. Naturally, each candle has, for example, if it was a rise, uh, our Japanese candle will be green, the opening, if it is a daily candle, the opening of the day, where the price was at the beginning of the day, the closing, where the price was at
[07:25] the end of the day, and the minimums, maximums, that is, where the price reached the minimum and maximum within this day. This is using the example of a daily candle. This will all work in exactly the same way on other spark plugs. If, for example, it’s an hourly candle,
[07:40] all of this will simply happen within the hour. And these daily highs and happen within the hour. And these daily highs and lows are often used lows are often used as levels in trading. That is, uh, many
[07:52] traders pay attention when they start their trading. Today, for example, trading is a job, nothing more. Typically, of course, this can be a different investment of time, but let's take, for example, the average trader who
[08:06] the average trader who trading session, his trading day, he will look at what yesterday's lows were, that is, where the price reached its lowest point and where it
[08:20] rose to its highest point during the day. This will be like a kind of guideline for him. This is what market participants will be fighting for today. That is, either push the price above yesterday's trading maximum, or lower it below yesterday's minimum.
[08:35] Now let's look at a couple of examples. And today, by the way, I already grabbed a deal. Literally, I entered it in a minute and in a matter of minutes I had already closed it in profit. matter of minutes I had already closed it in profit. Therefore, the strategy is very interesting. I was
[08:49] surprised by its simplicity, but at the same time it is quite viable, if, of course, you take into account a few more nuances. We didn’t take it blindly; we only have two levels there: minimum and maximum. Of course, we still need to refine this
[09:04] into a strategy, which is what we will do now. So, guys, our analysis , as always, is as detailed as possible, so I would be grateful and appreciative for a like, a comment, and a subscription to the YouTube channel so I don’t get lost. And also
[09:17] subscribe to the Telegram channel, the link will be in the description under the video. There we post the latest news from the world of cryptocurrency, various bonuses, and promotions. Come, we will be glad to see you all. But we continue. So, let's return to the same
[09:30] Trading View. And here I have already conducted experiments. There are, uh, certain nuances. It's good to conduct a level, yes, everything is simple and clear here. But it is also important for us to see the reaction to this level, because without
[09:45] a reaction it is useless to trade anything at all in trading. And their reactions here have something in common. Now we’ll look at some examples from history
[09:57] and see how I’ve already worked this out in practice. Here we have a little candle. This red one is some kind of strange little top. We have set the maximum level. And here we have the minimum. To attach a level here. It's not just like that
[10:12] . We hold down Ctrl. We all see that it sticks. We have a magnet that turns on. And with the control key pressed, this ruler of ours sticks. We take this ruler here on the panel. Now, if we press the most ordinary horizontal beam. That
[10:25] is, we see that within the next candle, we have not yet had any approach. Here we don't need anything else anymore. That is, on the daily chart we found these levels in literally 2 seconds and switch to the minute time frame. Here
[10:39] in the minutes we already observe the approach itself and what is being formed at the level. We see that the price has come up. Further on, we have some kind of trade emerging. It is important for us to see the reaction at the level
[10:53] in the form of a price stop. That is, it could be just like this, at a trading level. We see that the price has come up and how it is rubbing here and not going higher. Naturally, here we will wait for a downward pass and then enter into
[11:09] a trade. This could be going a little beyond the level, some kind of trade. Here there is also some level of formation, that is, some kind of elementary inclination. Or again, here we will see some kind of sideways movement beyond the level and a
[11:25] downward breakout. That is, here, for example, we will already look for our entry point at this downward breakout. That is, this is the very reaction that we are waiting for and watching how it works out in us further . That is, we found our
[11:39] reaction. Here she is. We are waiting for a downward breakout. That's it, the price has already approached us, showed us a reaction, bounced down, and even broke through the lower level of this small sideways movement. And then we open a short position
[11:55] . That is, short is when we earn an attack, long is when we earn a growth. Hiding the stop loss. Again, the stop-loss, as always, is hidden behind some level that has formed here, or behind some candlestick extremes. Yes,
[12:11] it is a minute time frame. Well, by the way, another advantage of taking some fundamental assets for such a trade is that here, even on a minute-by-minute basis, you can look for some extremes to operate with. That is,
[12:24] the extreme is when we had, for example, a red candle down, a green candle up and again a red candle down. This little knee formed. Here we have a turning point. And beyond this reversal point, you can
[12:39] move your stop loss a little bit beyond it. That is, we see that here we is, we see that here we had all sorts of spikes, the price reaction to trading, to some kind of transactions. That's it, we've hidden our stop-loss here. Takek profit. Who has what
[12:53] goals? Of course, the minimum is 1: 1 to four is desirable. But there are some pretty four is desirable. But there are some pretty
[13:05] but of course, it's not for minutes, it's about sitting there for an hour or two, dragging it out. Well, and, in principle, to take more deals. Here you need to conduct some back tests, research, and act according to your own risk management. Well, the
[13:20] minimum base is 1: t, even better 1: four. That's it, we don't do anything further . We calmly wait for either take profit or stop loss. In any case, this is not a prediction of the future. Here we earn on statistics, over
[13:35] time, that is, we bombed 10 deals there. Some of them are stop-loss, some are take-profit, but due to the fact that our stop-loss is three or four times smaller, and the take-profit is, naturally, larger. That is, for example,
[13:48] as we can see, here we would have a test run. Let's say we had a stop-loss of $10 and a take-profit of $40 . So we made 40 dollars from this short deal. Well, it lasted 2 hours. That is, 2 hours is not
[14:00] that much. 2 hours 14 minutes here. And then we already have a allow ourselves to make a mistake, catch several stop-losses there, for example, and then close the take-profit. And this is how we trade our take profits. Due to the fact
[14:15] that they are four times larger there, for example, they cover some stop losses. Of course, if you lack knowledge, the channel has a trading training playlist risk management is covered, and it's as simple as opening and closing trades on the stock exchange, and
[14:29] simple as opening and closing trades on the stock exchange, and we have closed the next day. That is, we were the ones trading for this little red candle. So we closed the next day, in which we snatched up our
[14:42] deal and worked it out. And we need levels again. We move it here. Once. Once. Again. Let's move on to the minute timeframe. The story here is the same. We wait for the approach to the level and the formation of a reaction at this level.
[14:58] We see that a breakdown has begun. Of course, the price may not bounce down from this level. There might be a breakout and that's it, the price will jump further. But such a move beyond the level on
[15:10] a minute timeframe doesn’t frighten us yet . We are waiting for the probable formation of . We are waiting for the probable formation of some kind of trading pattern beyond the level and a breakout back downwards. Here we see that the price is already moving outside the level. Well, one way
[15:23] or another, we also have some bargaining going on here. That is, if the movement goes down back below the level, then it will be possible to look for an entry point. We see, yes, that the price has returned back below the level. That is, in principle, on
[15:37] a minute time frame we cannot expect a clear arrival at daily expect a clear arrival at daily highs or lows. It will be in the area of this level. But it is important for us to see that very trade, that very struggle
[15:51] for this, in our case, the maximum of the previous day. And after this struggle, the exit is in the direction of a return, as it were, below the level, but this turns out to be a rebound, a bounce from this zone of the previous maximum of the day. Here you can
[16:07] also place a deal, for example, a short one. We hide the stop-loss, as always, behind some knee. We see that we have green candles here, then some red pins. That is, there is a small shop here. This is where
[16:21] we put a stop-loss behind it and hide our profit. one to three, to four and then again we do nothing, we’ll see what comes of it. We see that the price jumps back to the level and bounces off again. That is, there were quite a few entry points here
[16:36] bounces off again. That is, there were quite a few entry points here , and the deal was completed in an hour and 3 minutes and we were already out of the market. And let's look at the deal that I opened today right before recording the video. And she closed at take profit. We had XRP.
[16:52] So I opened a simple daily chart and took the previous day’s minimum. Here we have a red, tall candle, this is the previous day. I took this minimum and noticed that we are already at this minimum . I wonder why not try to
[17:07] take back the deal? Yes, there is a small shortfall here, but I noticed here further to the left, another, so to speak, level. Here we see. We'll guide him now. Here we also had a minimum of this candle. And in principle, some kind of
[17:23] such zone has already formed here. That is, as I already said, there is no point in expecting a clear entry into the level there. One way or another, this will be a reaction somewhere in the level zone. But here we have two more levels intertwined. Now, on
[17:36] Bybet, we have XRP open. Let's unfold all of this onto the screen and figure out what was here. That is, these are the very levels that we drew on the daily candle. That is, here is the daily time frame. Here on Bybet the terminal will be approximately the same as
[17:51] more convenient to work in Trading View. There's also a useful video on Trading View in the trading from scratch playlist . If you are not familiar, you can take a look. Trading view has its own convenience for technical analysis. Here we have the same minimums taken on a
[18:08] daily basis. Then I jumped for a minute. And what was the reaction? That is, we see that the price has come up. It's elementary here, a tilt, a regular tilt, which for a tilt, a regular tilt, which for us consists of 1, 2, 3 touches. Here again,
[18:22] us consists of 1, 2, 3 touches. Here again, top by capitalization. I don’t know about volumes, but in terms of capitalization, it’s in the top 10, I think, right now. And we see here a beautiful test of this slope. That is the very
[18:36] same reaction. We understand that here we are approaching our understand that here we are approaching our levels, and also breaking through this more had a descending corridor here. We made it through. Retest. Here we see a
[18:49] made it through. Retest. Here we see a green flag - move. This is how it is celebrated at the baybet . Here is a small flag. It was on this candle that I entered. Stop also hid here in his own way. First of all, we had a red candle here, a green one. Well,
[19:02] that is, something like a knee. And in this place we also see a kind of pin, the tail of a candle, that is, some kind of reaction is also taking place. Here the price was pushed down and from here they bought it out. This is how our candle tails are formed. That
[19:17] is, there was some kind of price reaction here too . All. Here's a short stop. Yes, the stop here could have been made longer, hidden more securely here. But since I had little time, as I said before recording the video, I
[19:31] quickly worked out the deal live. Mm, [snorts] there was a desire to show, then such a short stop. And we see, here I have a take profit, here is this red bird, this was a take profit. The ratio is exactly one to four, but I see
[19:43] that yes, it was possible to pull out more here. We see that the price has gone up, up, up. That is, here it is exactly one in ten with such a short stack. Exactly 1 k de could be snatched. $10 stop loss, $100 take profit. Here are
[19:59] short stops. Yes, here in short stops the risk is higher, but you can also take advantage of the stops the risk is higher, but you can also take advantage of the movement much better. That is, to take, let's say, more profit from a smaller movement , since if the stop were pulled all the way
[20:12] here, then the ratio here would only be one to two, not even to 2 with a positive. Therefore, it is a matter of your personal balance between risks and profits. For example, you can grab one deal like this 1:10 and then
[20:28] even three in a row with a stop-loss, the next 1:10 can be taken and you can calmly cover everything. And our deal lasted exactly 19 minutes. It took me half a minute to find the deal. Enter the trade for another 2 minutes and the trade worked for 19 minutes. That's it
[20:44] , I'm no longer in the market. The risk of being caught in some kind of manipulation, news and so on no longer affects me. I have also been using the DragonFly trading robot trading for almost 3 years now. To date, a whole line of Dragonfly algorithms has been developed
[20:58] whole line of Dragonfly algorithms has been developed . Conservative ones bring 5-8% . Conservative ones bring 5-8% per month to the deposit. Moderate 8-12% monthly. Aggressive - 1220. There are also semi-automatic algorithms.
[21:11] Users achieve profitability of up to 150% per day, but this requires active participation. I'll leave a link to a detailed video and step-by-step instructions for installing it on a real or demo account in the description below this video. Be sure to
[21:25] comment, subscribe to the YouTube channel so you don't get lost, and also to the the description below the video. That's all from me. All the best and successful trading.
⚡ Saved you 0h 21m reading this? Transcribe any YouTube video for free — no signup needed.