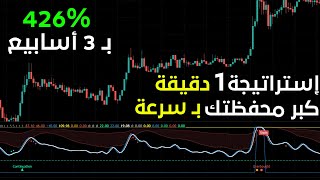

From 42% Win Rate to 427 Pips
45sThe dramatic transformation from a low win rate to massive pip gains creates a compelling 'rags to riches' narrative that hooks viewers.
▶ Play Clip"Title promises a fantastic strategy; video delivers a functional one with improvements, but results may vary."
This video presents a trading strategy for Ethereum/USDT on the 1-minute timeframe, originally found on the FX Accurate US channel. The strategy uses the Boom Hunter Pro indicator with a 2:1 risk-reward ratio, achieving a 42% win rate and 60% account growth over 100 trades. The creator then improves the strategy by adding two indicators (Hal Sweet and Footy Oscillator) to follow the trend, resulting in 427 pips profit over three weeks.
A single-indicator trading strategy from FX Accurate US channel, adapted for 1-minute scalping on Ethereum/USDT.
Uses a 2:1 profit-to-loss ratio: take profit is double the stop loss. Green line (TP) must be twice the red line (SL).
With a 40% win rate (4 wins out of 10), if each win is $2 and each loss is $1, net profit is $2 (8-6).
Added to TradingView. Settings adjusted to disable unnecessary elements. Entry on close of candle after signal.
Indicator gives signals against the overall trend, leading to losses. Backtest shows 42% win rate.
42% win rate, 60% account growth over 100 trades. 13 consecutive wins and losses observed.
Added Hal Sweet (period 200, multiplier 1) and Footy Oscillator to filter trend and volatility.
Three confirmations: Hal Sweet green, price above green line; Boom Pro white line crosses red upward; Footy Oscillator crosses upper blue line. SL at nearest low, TP 1.5x SL.
Hal Sweet red, price below red line; Boom Pro white below red; Footy Oscillator below lower blue line. SL at nearest high, TP 2.5x SL.
Strategy now follows trend, avoiding counter-trend entries. Backtest over 100 trades shows 427 pips profit in three weeks.
The improved strategy with trend-following indicators significantly outperforms the original, achieving 427 pips profit in three weeks on the 1-minute timeframe. It is recommended for scalping on Ethereum/USDT and other currency pairs.
What is the risk-reward ratio used in the original strategy?
2:1 (take profit is double the stop loss).
00:56
What was the win rate of the original strategy in the backtest?
42%.
04:38
What was the account growth percentage after 100 trades with the original strategy?
Approximately 60%.
04:38
What is the main drawback of the Boom Hunter Pro indicator?
It does not follow the overall market trend, giving counter-trend signals.
03:41
What are the two additional indicators used to improve the strategy?
Hal Sweet and Footy Oscillator.
05:21
What settings are used for the Hal Sweet indicator?
Input 200 and multiplier 1.
05:41
What are the three confirmations required for a long trade in the improved strategy?
Hal Sweet green and price above green line; Boom Pro white line crosses red upward; Footy Oscillator crosses upper blue line.
06:17
What is the take profit ratio for the improved strategy on long trades?
1.5 times the stop loss.
07:13
What is the take profit ratio for short trades in the improved strategy?
2.5 times the stop loss.
07:33
How many pips profit did the improved strategy achieve over three weeks?
427 pips.
09:29
Profitability with Low Win Rate
Demonstrates that a 40% win rate can still be profitable with a 2:1 risk-reward ratio.
01:49Trend Following Gap
Identifies a common flaw in indicators that ignore trend, leading to losses.
03:41Original Strategy Backtest
Provides concrete performance data: 42% win rate, 60% account growth.
04:38Three-Confirmation Entry
Introduces a robust multi-indicator confirmation system to filter trades.
06:17Trend Following Advantage
Emphasizes the importance of trading with the trend to avoid common mistakes.
08:27[00:01] fantastic trading strategy I found on the FX Accurate US channel. The strategy uses a single indicator. We'll examine this strategy, analyze its performance, and try to
[00:13] significantly improve its profitability. The founder of this strategy stated that it's best used on the 1-hour timeframe, but I'll be using it on the 1-minute timeframe to create a fast scalping strategy. I hope you can
[00:30] rely on it. I'll be using the Ethereum/USDT pair on the 1-minute timeframe, as mentioned. So, follow along with the video; I hope you'll benefit from it. After you finish watching, please share your opinions in the comments and let me know if you'd like me to share other
[00:43] strategies if you find this type of video helpful. Now, let's move on to the video. Before we begin our explanation, I want to clarify some key points that beginners often find confusing. As we mentioned, this
[00:56] strategy is based on a two-to-one profit system. This means that in every trade, we have the potential to potential to double our stop-loss. Using this tool on TradeView, we can determine this. The white line in the middle
[01:10] indicates the entry price, the green line above it is where we take our profit, and the red line below it is our stop-loss. Therefore, with this
[01:22] strategy, we always need the green rectangle to be larger than, or twice the size of, the red rectangle below it. As you can see, in the red square in the middle, we have a risk to double our potential loss,
[01:34] currently at two. So, we enter the trade at the white line and have the potential to double our potential loss. With this the trade at the white line and have the potential to double our potential loss. With this strategy, assuming it has a 40% success rate (
[01:49] meaning four winning trades out of every 100), then, for example, if our strategy's profit percentage is [percentage missing], the profit percentage would be [percentage missing]. 40% means that for every 10 trades, we have four winning trades. So, assuming we make $2 in each trade, our total profit will be
[02:06] $8. If we lose six trades, our total loss will be $6. our total loss will be $6. Therefore, we will still be profitable if the number of winning trades is less than the number of losing trades. Now, let's add
[02:21] our indicator and see the strategy we have today. We'll go to the indicator and today. We'll go to the indicator and enter the name of the indicator, which is Boom Hunter Pro. I'll put all the indicator names in the video description. Now, we need to access the settings of this
[02:34] video description. Now, we need to access the settings of this indicator and disable some things we don't
[02:53] need. Now the indicator is ready. Let's look at the rules for entering trades. As soon as the indicator gives us a long entry signal, we enter at the close of the candle. We set the stop loss at the nearest close of the candle. We set the stop loss at the nearest low and set the take profit to be double the stop
[03:13] for short trades. As soon as the indicator gives us a short signal, we enter at the close of
[03:26] the candle and set a stop loss. The loss is at the nearest peak, and our profit is double the stop loss.
[03:41] As you can see, the indicator is giving us some good entry signals, whether for short or long positions. However, this indicator has a drawback: it doesn't follow the trend. The overall market trend might be upward, yet it
[03:57] gives us many short positions, or vice versa. Let's backtest the current situation and see the success rate of this indicator, and then we'll try to improve it in the second part of the video.
[04:38] As you can see, the profit rate is 42%, and frankly, that's not bad for a single indicator we're using. Within 100 trades, we were able to increase our account size by approximately 60%. As I mentioned at the beginning of the video, the channel that published this indicator
[04:54] stated that it prefers to use it on the hourly timeframe, but we're using it on the minute timeframe here, so that might be the reason. As you can see, we have 13 [units/items/etc.] here. One
[05:06] successful trade in a row and another losing trade in a row. Let's now try to improve the performance of this indicator using another strategy I found on a YouTube channel. Honestly, the strategy became powerful after using the new indicators that I'm going to teach you about. We'll
[05:21] new indicators that I'm going to teach you about. We'll need two additional indicators to improve need two additional indicators to improve this one. The first indicator is called Hal Sweet,
[05:41] Let's first adjust the Hal Sweet indicator's input to 200 and the multiplayer to 1. Now let's modify
[05:59] the letter by going to Style and deleting these. Now we'll completely change our Boom Pro indicator. Now we'll completely change our Boom Pro indicator.
[06:17] So now we have a simple indicator that relies on line crossovers. Now let's look at the rules for entering trades using the new strategy. The first confirmation new strategy. The first confirmation we need is confirmation of the letter's direction. We'll
[06:30] get this confirmation from the Hal Sweet indicator. The color must be green if we want to enter a long trade, and there must be a green candle. The price closed above the green line of the indicator, and the
[06:42] second confirmation we need is from the Boom Pro indicator. We need the white line to cross the red line upwards at this point, and we need a third indicator showing high volatility in the market. This confirmation is taken from the
[06:57] market. This confirmation is taken from the third indicator, where it crosses the upper blue line upwards. When these three confirmations are combined, we can enter a three confirmations are combined, we can enter a
[07:13] long trade, placing the stop loss at the nearest low. Our profit target here should be 1.5, and the stop loss should not be double the amount we used when using the indicator alone,
[07:33] as you can see. Conversely, for short trades, we need the Hal Sweet indicator in red, and a red candle closing below the Hal Sweet indicator. We also need the red candle closing below the Hal Sweet indicator. We also need the Boom Pro indicator's white line to be
[07:46] below the red line, and there needs to be volatility below the lower line on the Footy Oscillator. In this case, we enter a short trade at this point and place a
[07:59] stop loss. The loss occurs at the nearest peak, and our profit is double and a half of the stop
[08:27] beauty of this strategy is that we always follow the trend, which is very important for traders because most people don't follow the trend. They always notice the peak here and the trough here and enter, and this leads many
[08:43] people to lose money during trading. Overall, I see that this strategy has very profitable trades. Let's now look at its backtest for 100 consecutive trades and see its profit percentage.
[09:29] In three weeks of using this strategy, during the period in which we tested the trades, we were able to double our account by 427 pips. So, frankly, this is an excellent scalping strategy on the
[09:45] one-minute timeframe. I hope you will also look at it and try it on currency pairs. Other coins, and tell me your opinion in the comments below. If you're benefiting from the content I'm providing, please don't forget to like the video, as this has greatly helped it
[09:59] spread on YouTube. Also, for those who haven't subscribed to the channel yet, I hope you'll support me by subscribing. Thank you so much, and stay tuned for my upcoming videos. Bastian will be better and better, God willing. Thank you, and peace be upon you.



⚡ Saved you 0h 10m reading this? Transcribe any YouTube video for free — no signup needed.