
The 4-Minute Timeframe Secret
53sReveals a specific, actionable timeframe that outperforms others, sparking curiosity and debate among traders.
▶ Play Clip"Delivers a clear, actionable strategy as promised, though the 'blind spot' name is more branding than a unique edge."
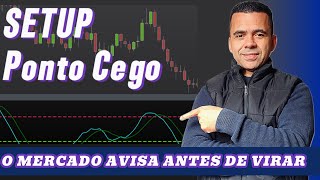
This video presents a trading strategy for the Brazilian mini-index (WIN) using a single indicator, the DT Oscillator, on a 4-minute chart. The strategy identifies overbought and oversold regions (above 70 and below 30) and uses line crossovers within these regions as triggers for buy and sell entries, with a fixed target of 200 points and stop loss of 150 points.
The video introduces a study model for trading mini-index using a single indicator, promising excellent performance.
The strategy uses a 4-minute timeframe, which the presenter claims yielded the best results in tests compared to other timeframes.
The DT Oscillator is added to the chart, which is a blend of RSI and stochastic oscillator, showing overbought and oversold regions.
Horizontal lines are added at 30 (green) and 70 (red) to mark oversold and overbought zones respectively.
Above the red line (70) look for sell signals; below the green line (30) look for buy signals. No trades when the indicator is between these lines.
A buy trigger occurs when the two lines cross below the 30 level, and the candle that forms the crossover is used as the entry trigger on a breakout of its high.
A sell trigger occurs when the lines cross above 70, and the candle forming the crossover should be red with a robust body and close near the low; entry on breakout of its low.
Recommendation is to make one or two trades per day, preferably during the morning period of highest volatility.
A valid buy setup requires a confirmed crossover, a candle with a robust body closing near the high, and a breakout of that candle's high triggers entry.
The strategy is simple and visual, relying on the DT Oscillator's overbought/oversold zones and line crossovers to time entries, with a fixed risk-reward ratio of 150-point stop and 200-point target.
What timeframe is recommended for this mini-index trading strategy?
4-minute timeframe
01:21
What indicator is used in this strategy?
DT Oscillator
01:34
What are the overbought and oversold levels set on the DT Oscillator?
Overbought at 70, oversold at 30
02:33
What is the recommended number of trades per day?
One or two trades per day
07:56
What is the target and stop loss for each trade?
Target 200 points, stop loss 150 points
05:58
What conditions must be met for a valid buy trigger?
Lines cross below 30, and the candle forming the crossover must have a robust body closing near the high; entry on breakout of that candle's high.
05:00
What conditions must be met for a valid sell trigger?
Lines cross above 70, and the candle forming the crossover must be red with a robust body closing near the low; entry on breakout of that candle's low.
06:31
4-Minute Timeframe
The presenter explicitly states this timeframe yielded the best results, providing a concrete parameter for traders.
01:21Trading Zones
Clear definition of when to trade (above 70 or below 30) and when to stay out, simplifying decision-making.
04:03Trigger Confirmation
Emphasizes the need for a crossover in the oversold/overbought zone and a candle confirmation, reducing false signals.
05:00Trade Frequency
Recommends limiting to 1-2 trades per day during high volatility, promoting discipline and risk management.
07:56[00:02] Hey my friend Edmar CO here bringing a complete lesson presenting a study model for trading mini-index indexes using a single indicator and achieving excellent performance.
[00:15] Quite an interesting topic, isn't it? So I invite you to subscribe to the channel, notifications and, of course, leave a like so that our video is recommended to more people here on YouTube. I also invite you to
[00:30] Instagram account, where we post daily information about day trading, mini-index, mini-dollar and, of course, we talk about our trading strategy. Speaking of operations, if you're interested,
[00:43] there's a link to our website in the video description. There you will learn about the operational side. I talk about it quite a bit, I explain in detail how it works. If you still have any questions, you can send them directly to Instagram via direct message
[00:56] greatest pleasure. Now I'm going to share my screen with you. I'm going to show you how to set up and use this study model to trade the mini-index. Okay, so here in the graph, we're going to show all the configuration,
[01:09] everything that will be necessary, so that we can get the best results from this study model. So, first of all, we need our own chart here, which we need to be on a 4-
[01:21] minute timeframe. I performed some tests on other timeframes, and this one yielded the best results. So, on a 4-minute timeframe, the asset is the mini- index. We're basically going to need an indicator here with some
[01:34] settings and some metrics that I 'll explain from now on. Right-click here on the chart, insert indicator. We will look for the DT oscillator indicator. Apply it here below in this
[01:50] lower window. And by default, it's already shown here for us. It's coming with these two lines, one blue and one green. We're going to double-click on it. Let's improve the appearance and increase the thickness of both to three, so that we
[02:06] of both to three, so that we have a better view of the indicator. This indicator is actually a blend of an RSI, showing regions like a stocratic oscillator, that is, an RSI with
[02:20] overbought and oversold areas. And we will identify these regions, and it is precisely in these regions that we will act, seeking the triggers for the operation.
[02:33] To identify the legal area, we're going to right side and configure it, inserting two lines that will mark these
[02:45] lines that will mark these important regions for us. Fixed gate. Let's go to the horizontal grid and first remove these two values that first remove these two values that are here, and first insert the
[02:58] are here, and first insert the value 30. Select it. Let's apply a color and a dashed line, and then a green color
[03:10] a dashed line, and then a green color to it. So let's set it to thickness three. Let's go back there and enter the value 70. Select the dashed line and color it
[03:25] red to highlight it for us, because those are the overbought and In other words, when we're in that red zone, we're exhausted,
[03:38] red zone, we're exhausted, meaning we're close to reversing the trend and where we'll try to take advantage. Similarly, the region down there, where this green line is located, is where there is
[03:51] a reversal is likely to occur, allowing us to enter with buying pressure at that point identified in our indicator. So we have
[04:03] these regions here. So above the red line here we'll be looking for sales, and below the green line we'll be looking for purchases. always based on a will happen on the chart when we're about to perform these operations.
[04:21] Let's go. So, as I explained to you, the market may be falling here and you, the market may be falling here and at a certain point it will stop selling and we will have a buying force acting and it
[04:33] will probably change the market trend. This is visible in the indicator. So, you see, when I have the indicator lines working inside the red and green lines , we're not going to do anything. It's already
[04:46] in motion, it's already gone. When he works here below the green line or above the red line, then we have potential triggers. The purchase option would be listed below . And when do I see a trigger happening? We're going to check
[05:00] first if it's working below the green line, below 30, right? And when exactly this happens here, the crossing of these two lines in this region, it indicates that
[05:14] a reversal, a change in movement, is occurring. This will be reflected up there in the candle. Let me grab the tool that shows it correctly. Just look . So, this crossover was
[05:27] identified in this candle. Exactly. Oh, we have confirmed this movement. Once this movement is confirmed, I know that I can, from the breakout of this candle or above its high, place
[05:42] a buy order, and we can then act on the buy side at that point because it's being validated by these two movements. My entry point is at this location, my exit point is 200 points above, and my stop loss is 150
[05:58] points below. So here we're going to see that there was an entry and he hit the egg on top at 200 points. So this is always how it will be our trigger. When we have the price trading below the
[06:14] 30 region of the DT oscillator with a crossover in that region, the candle that originated the crossover is an entry trigger. And we're going for the target. So points to consider. We will
[06:31] more interesting. For example, here, look, the beginning of the day. I will wait for this movement, for this intersection to happen. So, look, the market opened, and we have the price here working above the price in
[06:45] my sales region, right? So I 'll look for a crossbreeder who can identify and sell it to me. I have here a crossing of these two lines, but they are crossing in a direction where I have a green candle
[07:00] . So, this doesn't interest me at all. At this red dot, I'm going to look for something to sell. If I'm looking for a sell signal, I need a red candle with a robust body and a close near the low. Where am
[07:14] I going to find that? In this chart, starting from this point here, I'll observe that this candle here is red like this; it's starting the crossover movement. Is this confirmed in the next candle? Yes. So, this candle
[07:27] here shows me a crossover. So if I look here, put see the intersection happening at this point. I have a well-validated candle
[07:39] here at this point, giving me the idea to sell at this point. So I would have a below the low of that candle, I would have a sell signal. At this point of sale, if I'm doing it, I have a top 150 points above and a target 200 points below. Then all you have to do is
[07:56] observe market movements. I see that he's triggering my sale and coming to grab my target down here. Recommendation. How many trades can you make per day? Ideally, you should make one trade per day, right?
[08:11] Or as little as possible, one or two trades per day, taking advantage of the timing, utilizing the period of greatest movement, of greatest volatility, which is the morning period. If this happens, it will be very easy for
[08:24] us to achieve our results. So, let's take another example here: the market opening, the movement has been steadily decreasing within the region where we don't operate. When he enters the region where we are going to search for the
[08:37] confirmed movement. Oh, when I come here and observe, let me zoom in here to make it look nice. Note that there is a green candle here, but this crossover is not confirmed. I have this candle here in sequence with the lines widening out
[08:54] , confirming the trade for me . So I have a candle with a very robust body, closing near the high. So we have the possibility of making a buy trade here on the breakout of the high of
[09:09] this candle. So if this breakout happens here, I have an entry point, and then the target is set at 200 points, with a stop loss below at 150 points. From there, I observe that it triggers the entry
[09:29] and then, with two more candles, it catches on and hits the target. And here I see that he's making the crossing there, right? There is a candle forming the crossover, but the trigger, which would be the breakout of
[09:42] that candle, is not activated. So, there's nothing to be done. In this case, we can only observe the animal as it done. In this case, we can only observe the animal as it And when it arrives in this region, it leaves down here that
[09:58] trigger configuration that we are looking for to operate. So here I have exactly that setup, look, the crossing of the lines in the region where I can
[10:10] have a trigger, a candle configured with the closing price near the high. with the closing price near the high. So I observe, if I see a So I observe, if I see a breakout from that candle, I have a
[10:23] buy trigger activated. Then I notice that it activates there, hits the target there, the stop down here, and it hits my target up there in a very direct way. So it's a
[10:35] target up there in a very direct way. So it's a simple, straightforward, very visual setup that can offer you excellent possibilities. That's it . So guys, I hope this video, this content, has added
[10:47] value, added knowledge for you, and helped you in some way, which is the helped you in some way, which is the main purpose of this channel. If any way, I ask that you subscribe to the channel, activate the bell to
[10:59] receive notifications, and of course, leave a like if you really enjoyed it. Don't forget to follow us on Instagram. If you have any questions, you can answer them, or leave a comment on this video. Warm regards to
[11:15] all, may God bless you immensely. Until the next video.




⚡ Saved you 0h 11m reading this? Transcribe any YouTube video for free — no signup needed.