3 Indicators for 0DTE Options
40sOpens with a bold promise of transforming 0DTE trading with a simple setup, hooking viewers seeking quick gains.
▶ Play Clip"Title accurately describes the content; the video delivers a clear three-indicator setup for 0DTE options."
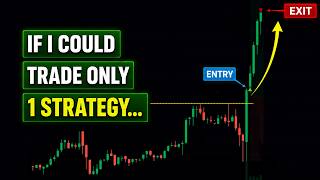
This video presents a three-indicator setup for trading zero days to expiration (0DTE) options, focusing on capturing explosive momentum moves. The strategy combines a Bollinger Band squeeze to identify compressed energy, the Tick index to confirm trending market conditions, and an ATR trailing stop for disciplined entry and exit management.
0DTE options are extremely sensitive to volatility and time decay, making them cheap but prone to expiring worthless if the stock doesn't move immediately.
The Bollinger Band squeeze occurs when Bollinger Bands cross inside Keltner Channels, quantifying compression and built-up energy. It signals the stock is ready to move but not direction.
The Tick index measures the breadth of buying/selling across all stocks in an index. When it holds above zero (buying pressure) or below zero (selling pressure), it confirms a trending environment.
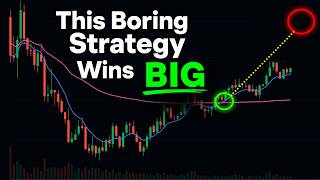
A 3-period, 1 ATR trailing stop on a 5-minute chart is used to enter on breaks and exit when the trend reverses, preventing premature exits and managing risk.
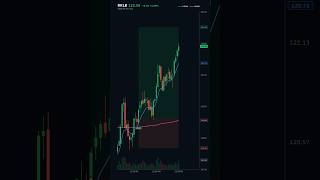
After a down move and consolidation, the squeeze indicator triggers. Entry on close below ATR trailing stop or break of support. Exit on first close above the trailing stop.
After a deep pullback and sideways consolidation, the squeeze appears. Tick holding above zero confirms trend. Entry on break of high of day, exit on ATR trailing stop.
Squeeze at open, tick reclaims above zero. Entry on first candle breaking ATR trailing stop. Trail out near high of day.
The three-indicator setup—Bollinger Band squeeze, Tick index, and ATR trailing stop—provides a structured approach to trading 0DTE options, helping traders capture explosive moves while managing the unique risks of time decay and volatility.
What is a Bollinger Band squeeze?
It occurs when Bollinger Bands cross inside Keltner Channels, indicating compression and built-up energy.
04:44
What does the Tick index measure?
It measures the number of stocks ticking up vs. down in an index, indicating buying or selling pressure.
14:06
What settings are used for the ATR trailing stop in this strategy?
3-period, 1 ATR trailing stop on a 5-minute chart.
23:20
Why are 0DTE options cheap?
Because they expire at the end of the day, making them highly sensitive to time decay and volatility, with a high risk of expiring worthless.
02:33
What is the aggressive entry method for a short trade using this setup?
Short on the first close that breaks the ATR trailing stop below price.
25:40
What does the Bollinger Band squeeze tell you about the stock?
It tells you the stock has been resting and has built up energy, but not the direction of the move.
06:52
How do you exit a trade using the ATR trailing stop?
Exit on the first close that reverses the stop: for longs, close below the trailing stop; for shorts, close above.
26:22
0DTE Options Are Cheap Due to Decay Risk
Explains the fundamental reason 0DTE options offer high leverage but also high risk of expiring worthless.
02:33Bollinger Band Squeeze Quantifies Energy
Provides a mathematical way to identify when a stock has compressed and is ready to move.
04:44Tick Index Confirms Trend Strength
Uses market breadth to validate whether the environment supports a sustained move.
14:06ATR Trailing Stop Removes Emotion
Automates entry and exit decisions, preventing premature exits and helping capture trends.
21:12[00:03] potentially make big returns fast and the simple three-step indicator setup you'll learn in this video will transform the way you trade them and the results you can achieve I'm Mike Bella Fury and we're one of the top
[00:16] proprietary trading firms located in New York City and proud to develop num seven and even eight figure Pere Traders watch take notes and learn so you can grow your trading account all right we're here with Garrett I'm really excited
[00:31] about the strategy um we're seeing more Traders do this on the desk Garrett take Traders do this on the desk Garrett take it away all right so trading momentum with odte options can be an extremely
[00:43] explosive strategy but with this incredible upside that comes with this strategy there are also very specific risks that when ignored often lead traders to crash and burn and what we're talking about here
[00:56] just to clarify because we're not talking about selling premium at at this point um that's a totally different strategy that's cess World we're talking about directionally trading uh zero DTE options in this video we're going to
[01:08] outline these risks that come with trading zero DTE options risks that frankly cannot be ignored and we're going to go over specific indicators we use to help sidestep each of these risks and you
[01:23] found three indicators that really add the most value right yes okay and and those three indicators are are they things that everybody can find platform that I know of you can just bring them up cool great so let's get
[01:38] are going to work together so this is really like one setup but we're going to interesting okay so in the end we'll reveal how to trade this simple three reveal how to trade this simple three indicator setup for crushing zero DTE
[01:52] options including specific entries and exits well why can't you just tell us so there stuff that I need to know about each of these or like yeah I mean you know you have to understand okay how to read them but yeah all right then let's
[02:06] out how to trade it so let's go all right so as you know uh I'm big on testing strategies I've tested these three indicators extensively for trading three indicators extensively for trading this exact kind of momentum and together
[02:19] they they complement each other incredibly well so what are these risks incredibly well so what are these risks of trading zero DT options so these options contracts expire at the end of the day
[02:33] and this makes them incredibly sensitive to volatility and time Decay because of this sensitivity because they're so close to expiring you can buy them for
[02:45] extremely cheap which is why we can make incredible gains when trading these instruments but why are they so cheap it's because of the risks that they'll expire worthless and it's very easy for this to happen because the decay is
[03:00] rapid I've been in that trade where you think something's going to happen and even worse it starts to happen and then you start to get into that decay and the Decay happens so fast and it is so painful so I'm really hoping this
[03:15] strategy that you've put together can help me stay away from that really you'll hear me on the dust kind of this sucks and it really is because you feel sucks and it really is because you feel you feel I feel helpless when when that
[03:28] decay starts and the price AC isn't working out because you know a lot of to get out of the trade so are you going to help us understand that too yeah okay all right good then let's move forward all right so with options and especially
[03:42] these zero DTE options unlike with trading stock if you're long and price is not doing anything you can really get killed in the position and that's exactly what Jeff is talking about here right so the clock is ticking and if you
[03:57] sit around in a position that is not Moving Your Position will go to zero where you can just kind of sit there and it doesn't do anything right so we need price to move in this situation uh so we have to time our
[04:13] moves really well we don't want to get in too early we want the stock to move in our favor immediately we need to make sure that the stock is ready to move and has already done its resting okay we want our stock to have already built up
[04:28] enough energy we want know that it's ready to run so how can we do this well there's an indicator that is amazing at identifying when a stock has been resting enough to have the energy to really run it's called the Ballinger
[04:44] band squeeze all right but everybody knows the basics of a Ballinger band squeeze or or if they don't I guess you know the compon the core components of it seem to be um what standard
[04:57] deviations of of of price volatility right yeah it's a it's a Kelner Channel and it's a Ballinger band okay so the Ballinger band squeeze occurs when a Ballinger band crosses inside a Kelner Channel and this quantifies a certain
[05:13] magnitude of compression and energy that has built up in the stock okay so if we look at this chart for a second you can see the Shaded blue area is where this stock in Nvidia in this case is in a Bounder band squeeze okay so forget
[05:30] which what's the purple and what's the what's the blue the so the purple is the bower band okay and the blue is the Kelner Channel okay so it seems pretty rare that the Kelner channels the blue
[05:42] lines are actually outside of the Binger bands the purple lights yeah so that's that's the normal state right is that the Kelner channels are inside the Binger bands yes okay interesting yeah and you you really what uh what inputs
[05:56] are you using are these standard like 20 period Binger bands and 20 period Kelner you've had to do yeah it's just G it's a 20 period both are 20 period and it's
[06:08] going to be two standard deviations and it's going to be one and a half atrs for those are those are fairly stock settings for a Ballinger band squeeze okay um and and again we don't have to worry about standard deviations or atrs
[06:23] I mean this is the math that's going into these indicators yeah but the key bands and we're just measuring how they react to each other okay right so all right so I have a squeeze and I put the trade on no I just go crazy y press the
[06:38] Stock's going to make a move all we know and this is actually a really key point because with indicators like all these things are math right these aren't magical potions or anything like that it's just math so quite
[06:52] literally a Ballinger band squeeze is telling you that the stock has been resting for a certain quantifiable amount of time and it's compressed a amount of time and it's compressed a quantifiable amount so all it's saying
[07:06] is that this has built up energy is it saying it's going to do anything is it going to go higher is it going to go lower once it breaks out is it going to Trend we really don't know we just know that it has energy it has the potential
[07:20] so then what do we look for to identify I that's great that it has potential but be able to identify this potential turning into a probable yeah so this is this is where the other indicators are going to commit
[07:35] the other indicators are going to commit right so um and and and usually the better right because that means it's been compressing for even longer is there a general timeline that you look for so I like I like to like have at
[07:48] least like five bars but but then again five one minute bars five five these are we're we're on a five minute time frame for this entire presentation so all these charts are five minut minute intraday time frames okay I think it's a
[08:01] really good time frame for this okay um and and you can see in Nvidia in this situation that was a very long Ballinger band squeeze right and so if you look down at the bottom you can see the red dots yep right and that's just the TTM
[08:16] squeeze indicator on thinker swim okay stock indicator I took out the histogram okay the histogram like some people might use that great all we're doing here with the red dots is identify when it's in a squeeze that's all we
[08:31] view I could do the exact same thing just putting in the standard things and just look at it I may not need the dots or anything like that and if I'm on any other platform same thing you can just find it yeah this is a very generic
[08:44] indicator that anyone can can bring up and and I just the real indicator is the red dots down at the bottom right that's all you need to see squeeze I put the Kelner and the Ballinger bands on price above just to
[08:59] show you how this is created the math that's going into it the fact and you can even see the bands are pinching right they're coming in that's showing that volatility is Contracting that's what we want to know so what what so
[09:12] what comes next because you know we can identify volatility contraction based on this term pretty easily it's a very visual thing yeah exactly but you just told me that that doesn't have Edge so in this case Nvidia made a huge
[09:25] move out of this right it makes sense right it rested it contracted built up energy and it made a move that's like what we want to capture right and but I can't just take this blindly no you you can't like this is one component right
[09:38] can't like this is one component right okay and and look we can look on a chart Contracting yeah right like if you if someone said hey like I don't need a ball SC I can just look in the chart Great like you're right but there are a
[09:52] few reasons why we might use an indicator to tell right one one is readability right like we're gonna we might just not want to have to count bars or like try to quantify like too difficultly we just might want to get an
[10:05] alert that says okay it's in a baller B squeeze another thing is if you want to put this into a model right and you're coding in Python yeah you can't back test by visually walk I mean you could but it would take forever you're just
[10:17] going back and marking each bar individually and you have to have some way of quantifying it because you can't tell python hey all right so I want to do this when the stock is compressed yeah like it like that doesn't mean
[10:30] anything so this is just a way to quantify so you've identified with this just to sum it up really quickly with this strategy the first component of it this first indicator for really effectively trading explosive moves in
[10:43] zero DTE options is seeing that compression and we're defining that compression by a a squeeze essentially the Kelner channels trading outside or I guess the Binger B tra trading inside of the Kelner channels showing that period
[10:58] of rest yeah okay great so then what do we do next yeah so now we can identify when a stock has buil up energy right it has the potential to make a big move but this doesn't mean
[11:12] out we need to make sure that there's a high probability of continuation in our favor so that's what the next part is going to be about okay so when we're trading zero DTE options we're often
[11:26] buying out- of the money calls or puts because this makes them even cheaper and increases their sensitivity do you have yeah do you have a metric of what you know I could I buying any out of the money calls like does it do you have
[11:40] something that you prefer yeah I mean I I actually like to look at the chart I know a lot of people just look at the Deltas and that's fine too yeah but I actually like to see where I think it can go oh interesting okay um and then
[11:53] I'll also look at the Delta as well so if you're thinking if this breaks out of range visually it could go not visually but technically it could go up a certain amount so you're kind of finding a price Target and you're buying to that Target
[12:05] or you're buying well because the Deltas are changing so fast for these because doing this right like if there's only an hour left in the day like those Deltas for that same distance are going to be a
[12:17] lot low yeah okay that makes sense all right that's good to know so so pick a price Target on the chart and and essentially buy to that is what your strategy tends to be yeah really want to I want it to get there really fast and
[12:31] really can get get a lot out of these options okay that makes sense um so again in this situation uh there's another risk right the risk is that the stock won't move far enough and fast enough right we just talked about the
[12:45] targets we need it to get there right so in other words how can we make sure that the market is in Trend mode yeah because that's really the kind of environment we want to be in when trading these kinds of options so there's this is so this
[12:59] of options so there's this is so this would be different than most days or most most zero DTE strategies where for zero DTE strategies I think even I was watching watching a video that I think Justin did the other day and there was
[13:14] an ad that popped up about a somebody talking about a zero DTE strategy where we selling premium and I think that's what most zero DTE strategies are right but this is not selling premium this is I want an explosive fast move I'm not
[13:28] I want an explosive fast move I'm not looking to capture 100% 100% of a two standard deviation away from the money I'm actually looking to capture a significant move even if it is two standard deviations away from the money
[13:40] which is my price Target right okay so you're T you're looking for situations where it's beneficial to take the other side of that premium sell exactly as everyone's stopping out of the trade who's shorting these things and you know
[13:52] we're we're really which probably actually Builds on the trade on its own hopefully you can help us see that all right let's go all right so there's an indicator that's amazing at identifying market trends and it's called The Tick
[14:06] okay so one of the great things about this indicator is that it's not measuring anything about the price of the index or stock we're trading instead it's analyzing the action of all the stocks in the index and measuring how
[14:22] broad the buying or selling is at any moment and so this is really great for when we're trading Futures we're trading the index we're trading The Q's we're the index we're trading The Q's we're trading the Spy or high Beta Market
[14:37] names right and and when we're trading these kinds of options we really do want liquid names right we're not going to be doing this on illiquid names because we want to be able to get in and out of these options and so typically and a
[14:51] really good way to do this is to be looking at either the qes or spy you know maybe SPX if that's your thing right or uh the Teslas of the world the
[15:03] the Googles and the metas and the nvidias right ESP looking at Market markets or Market names that are in play for this yes and so one way that we can Define in play on our desk is say if it's trading three plus rall right
[15:17] that's very quick standard we can talk about why we think three plus rall matters but I I can't remember a day when I've looked at spy after like 9:31 and it's trading 3 plus Sall yeah so what do I do in that case well I mean
[15:32] right we look at the we look at the internals we look at the tech take is one of the internals when we're trading the market um volume is much harder to the qes and the spy and stuff like that okay okay so so if I'm if I'm looking at
[15:49] maybe if I'm using arval so I have the tick maybe in in in my favor and and and it's in play yeah if I'm looking at like like a 1.2 rval in spy or Q's is that
[16:02] acceptable yeah that's fine well 1.5 would be good 1.5 is amazing okay yeah because you mentioned some of the market names are we talking like maybe 1.5 is
[16:14] acceptable if Ralls 1.5 that's acceptable for this that's acceptable for this okay and then two would be maybe two is two would be amazing and because you might see this setup in the market yeah but then you might actually
[16:27] look at something like Nvidia and that might be having a very special day yeah and you might be able to make twice the trade oh inter in Nvidia right so if Nvidia is doing two or three arval maybe it has a catalyst and you're seeing this
[16:41] set up in the market I mean you might gravitate to Nvidia really capture a huge move that's when this might be an A+ setup for you okay so that's that's good to know so that's an advanced topic I'm guessing but all right so sorry for
[16:54] diverging but I need to know this stuff because I want to learn this and and are implemented in my own trading yeah um so but what do we need with tick yeah so when this indicator is holding above zero or holding below zero we know that
[17:09] zero or holding below zero we know that we have a seriously trending environment when the tick is holding above zero it means that more stocks are ticking up trading on the offer than ticking down and the market is sustaining this okay
[17:23] so in the flip side when the tick is holding below zero it means that more stocks are ticking down trading on the bid than ticking up and the market is sustaining this okay so if I'm hearing you correctly then it's find the squeeze
[17:39] where where the Binger bands are trading inside the Kelner Channel and make sure that you have tick in a trending fashion yes trading above zero or for the long side or below zero to the short side yes okay so if I have that then I can surely
[17:54] buy out of the money calls and just go right that's a great starting point like we got we're we're not totally done with the okay there's one more after this okay but look I mean at this point we do have we have a compressed Market that
[18:09] have we have a compressed Market that has energy it's it's rested yeah and we have a market that has either buying pressure or selling pressure enough of really what we want this is what this is what we're after but that's really just
[18:23] the setup then right I don't have an entry trigger I don't okay all right so so the tick is one of the indicators that it's very straightforward it is what it is it's telling us exactly what is going on under the hood just
[18:36] literally and on big Trend days this is the kind of thing we see over and over okay so if we look on the screen I've highlighted in blue the areas just over the last I mean this is within the last few weeks actually um I just picked a
[18:52] random point in the chart and you can see these two areas are very very easy see these two areas are very very easy to see where the is trending above zero and we see that that massive uptrend again this is this is a five minut so
[19:05] The Tick's on the bottom of the chart here and then we see the the trend wow that's crazy okay yeah and so I mean and you and you can see look like the ticks can they can Wick below zero it's not it's not like we can't let it go below
[19:17] zero but like 80% of it is maybe even 90% of it in these cases 80% most of the closes are above like you can look at it that way um and so we have a good uptrend here and then we have good downtrend perhaps the day later the next
[19:31] day there all right so we have a stock that's ready to move we have a trending environment so we want to know when to enter and when to exit because remember we can't waste time with zero DTE options we don't want to sit and chop
[19:45] waiting for it to go and when we're in the trade that's working and this is really important we don't want to let it go against us or even start to rest sideways we're going to it's going to start our positions you're giving me
[19:59] you're giving me the palpitations right now thinking about all the times I've been in a trade especially using zero DTE and and you know that you're right on the direction you know that you're right on the direction and you you feel
[20:12] like it's got more to it and you're up 80% or 100% on your options or 200% on your options but as soon as it starts to go sideways like that's where my heart starts going because I'm like I know this is going to go further but it comes
[20:29] off so quickly and all of a sudden you're up 80% and it feels like a blink and you're up 30% then it just takes one little down move to kind of trigger the whole yeah thing okay so so you're going to give us some guard rails around this
[20:43] that's the scariest that's my biggest challenge with zero DTE so how do you avoid that so this is very nice and this is actually something we put in our alos too like a way to manage position so it's it's it's very very simple so it's
[20:58] gains when trading these options right so how do we make sure to enter correctly and get out when the move is over so what we're going to do here is over so what we're going to do here is we're going to use an ATR trailing
[21:12] stop okay this is an amazing indicator at keeping you in a trend until something changes it's a volatility stop so when the stock goes against you with a certain magnitude of relative volatility
[21:25] it gets you out and in the same way it can get you in so when the trend is cruising along and there's nothing to do it will help you stay in the trade and this is exactly the kind of discipline I hate using that word but that's kind of
[21:40] what this gives us and nimbleness that we need when trading zero DT options it's really a guidance principle because that's the challenge that I have that's where the most pain and frustration comes in for me is is either being in
[21:54] comes in for me is is either being in too soon and seeing your your p&l make a trading decision even though nothing's happened or even worse which is more painful um being in a trade that's worked but you know there's more
[22:10] there and you you know if it keeps going you're going to feel awful for taking it off early um but also you know that the bit and one little tick is going to take
[22:25] away so much of your p&l and so this is the part that I'm most interested in so understand it takes the emotion out a little bit okay right yeah you're saying discipline and I'm going to do exactly this and all that stuff it's more
[22:40] discipline that should be something that we're not even talking about right but but it just helps take the emotion out it helps quantify things give you some rules right which are always good when trading yeah that's how you could back
[22:53] if it out is Edge you can't tell a back test to stop you know exit the position when when Jeff thinks that it's it's at its Target and enter exit the position its Target and enter exit the position at Max pnl Max P I'd love to run a back
[23:07] test like that okay so this is on this chart we that okay so this is on this chart we have an ATR trailing stop okay and this is this is literally a five minute chart same as
[23:20] literally a five minute chart same as before um I think on this we used a um before um I think on this we used a um one a one ATR three period ATR trailing stop and you can see that in a few of these Trends it keeps you in the trend
[23:36] to either consolidate or trade against you it gets you out so when that blue line is below price it's long and when the pink line
[23:49] is above price it's short and it's as simple as that and you can see a few of chopped up and that's when the Stock's resting and that's fine cuz we have a trailing stop this is just something that we're going to use within the
[24:03] context of having something that's been resting and now is set up to Trend and so we're going to capture that and then we're going to let this manage the trade for us so we have some examples of putting
[24:17] these three together that we can go over all of these examples are taken from the last few weeks we've been actually seeing this set up a lot lately in the market um see you can trade this setup like I said with Futures cues spy hi
[24:31] to look at the cues we're going to look at one example in Nvidia but we're specifically using zero DTE options because the leverage they provide but we have to recognize that leverage can go against us if we're not specific with
[24:45] our setup which is what you've created here is a very specific setup okay yeah let's look at the examples because I'm really interested all right here's the QQQ super simple right we get a little down move of with the open and then it
[24:59] starts to consolidate and when those red dots start to show up which I highlight in blue that means that it has Consolidated and compressed enough for enough time to start giving us that squeeze signal so if we put the Binger
[25:12] bands on the chart the Binger bands would be inside the Kelner Channel at that point yes and this is the F minute chart again right yep okay yes so we've got the five minute chart with the Binger bands inside the Kelner channels
[25:26] and then we've got the tick on the bot that was below zero and then what's my that was below zero and then what's my entry criteria so I like to do two things right if you're going to be really aggressive you can short on the
[25:40] first close that breaks the ATR trailing stop so you can see in this case um we're above it when the squeeze indicator starts to trigger and so you can wait until it flips short and a close below that is going to flip it
[25:55] short so the bar closing below that okay and that would be an aggressive entry because we haven't broken support yet so you might do half there that's what I like to do and then you can do half on the break the first close below the
[26:08] support okay if nothing else I like to just short the break I mean it's super just short the break I mean it's super simple but um but this works too and once you're in you're just using that trailing stop to keep you in the trade
[26:22] because for me I know that sometimes I need help getting out when it starts to more and you know like we said with these options we can't waste time but also sometimes like I have a tough time seeing this entire move right like after
[26:39] little bit and the the options feels good you're like I'm just going to book the trade because I'm I'm terrified that these things are going to start decaying on me yeah but this is a very tight ATR trailing stop one that is designed for
[26:53] this trade and so if it doesn't trigger you out of the trade and and you're going to capture that move so for me like I like this because it actually helps me stay in the trade until I really should be getting out so
[27:07] you're buying to the Target of your price Target but you're actually trailing the stop using the the ATR Trail okay and so what's going to trigger you out of it is the first close above the ATR trailing stop in this case
[27:19] so you can see the the blue circle there okay gets you out and that's you know that's a that's a pretty big move I mean that's almost like capturing a trend day um with everything lined up yeah yeah that's great and the option premium must
[27:33] have been very much going in your favor for a lot of that time even through the pause because it looks like it had you know a little brief pause there you know know a little brief pause there you know you're still not closing above that ATR
[27:45] trailing ATR exactly great all right so next one here's a long example in the cues and this was actually last week I think and I like this one because some
[27:57] times the compression and the squeeze is looking at Price sometimes those those wedges those compressions they get squeeze indicator to kind of quantify that it just looks so good this was a
[28:11] little bit Messier because we had kind of a a deep pullback in the morning and then it started to reclaim and go sideways and eventually we started to get those you might miss it yeah absolutely you legit might miss that I I
[28:23] chart without that indicator so that's good so that's the first component of looking at the tick so you're probably GL noticing that that tick is occurring first and then looking for this is that that's a great point because yeah I mean
[28:37] the first thing that kind of triggers you to think about the setup is the squeeze but you're right like what I I mean that's an incredible tick like look it's barely trading below zero so so if I see the tick holding
[28:50] above zero firmly then I can start to look for the TTM squeezes or the the Binger band squeeze or whatever you're going to call it yeah okay yeah indic this is the kind of when the tick looks like that I'm I'm looking at the market
[29:02] you're looking for that SP so that's the first step okay all right cool yeah and so I mean we have a big heads up with the tick on this one y like I mean it's it's super super clear and again you
[29:15] know you can in this case uh you you can you can just get in because it's above the ATR trailing stop MH but and again trailing stop so that's how you're going to risk it but what I would do if I'm
[29:29] buying the break of the high of day I'd be buying the break of that smaller consolidation that's right around where price is TR right where that blue dot is you just buy the breakout of that okay
[29:41] it until you get out and you can even see how um when right when we get out from the ATR trailing stop that the tick actually starts to get a little bit super clean you know tick trade right
[29:56] earlier that you're not just looking at this for Market stuff let's assume you see a strong tick reading right yeah are you are you then looking for the scans are you do you have a scanner or you you kind of scanning through stocks to look
[30:12] for the other checks how are you finding individual stocks in play yeah so you to all the high betas that's just how I do it I have a screen that tells me all the high betas okay right but I also have within that an alert for whenever one is
[30:29] looking at that because I'm not always trying to do that kind of trading y but when the is it pretty easy to put in to put in that alert okay you just have a window on the side or something like that y okay all right great and but when
[30:43] the tick is trending that's when I'm actually really looking for these setups have a trend yeah absolutely So you you're using the tick to give you the context of the setup yeah okay yeah 100% that's that's a great way to put it okay
[30:58] and so this is NVIDIA long setup and this is another example where I think spotting that compression is a little bit difficult just looking at price but we do have a squeeze pretty much right at the open
[31:12] and the tick does open negative but it quickly reclaims and CLA just Trends above the zero line for a while right so by the time the trade triggers The Tick is trending above zero and we have a
[31:27] be buying the first candle that breaks the ATR trailing stop with a stop below um and then you know the you trail out there near the high of day and again just rinse and repeat yeah and you can put this in a model you can trade it
[31:43] discretionarily to really quickly sum it up what we're looking for first is um you know an individual name or or a market um to have that that that squeeze
[31:55] right so that Binger band Trading inside of the Kelner Channel that's the first this and then what else do we need Garrett we need the tick to be trending right holding above or below zero and by the way if you want to learn the ins and
[32:10] outs of what makes the tick indicator so powerful we we made an ultimate Trend Day video where we break this down so we can link that in the comments uh so I mean in fact these Trend days are so great to be trading with these zero DT
[32:26] options so I think that this video can be a fantastic supplement here because it really talks about how to identify these super powerful Trend days okay so to but the third thing that we need here for these purposes the third indicator
[32:40] we're using then is that that um trailing ATR that that you have on the chart and so that's just a standard can you go over the the metrics one more time for everybody yeah it's going to be a three
[32:53] everybody yeah it's going to be a three period 1 ATR trailing stop and this is a 5 minute chart okay and I love that because that's taking away so much the guesswork of where do I exit my position uh how long do I hold it what if it
[33:06] like the structure that you put together here thanks for doing this today great thank you so you're an active Trader not doing as well as you want not doing as well as you deserve and you just can't figure out why you can't become
[33:20] profitable no matter how hard you try well let me show you why this is your competition the traders in this room this room right here is full of elite Traders some of whom are making seven and even eight figures a year in fact
[33:34] our top guys have made nearly 20 million each in net trading profits in a single year let's head to my office so I can share more so you're probably used to seeing videos of lavish Trader Lifestyles trading gurus trading off of
[33:49] a laptop for an hour a day heck maybe even 15 minutes a day and then them relaxing on some secluded beach for the rest of the day well all I can tell you is that our Traders train like pro athletes they live and breathe the
[34:05] markets and are continually working on their trading skills because at our firm that's what we found it really takes to make it in this game I'm Mike bfury co-founder and managing partner of S&B Capital One of the world's top
[34:19] proprietary trading firms located in Midtown Manhattan and we're always looking for trading talent to hire and develop and not just to trade inhouse on our desk but also to trade from their own home entirely using our firms
[34:35] capital and we have numerous Traders doing just that allowing them to make upwards of seven figures trading the firm's Capital without risking their own money but to even get a shot at something like that you need to have the
[34:48] right training that's why we're doing a new free online presentation in which we share how you can get an interview with SMB to become an in-house a remote Trader trading firm Capital without risking yours and ging access to all of
[35:03] our firms coaching and resources and the best part you don't have to be a best part you don't have to be a profitable Trader yet in fact we prefer to mold profitable Traders with our methods and our techniques that's why we
[35:16] have just three simple criteria that can earn anyone an interview we're looking for highly ambitious and determined traders who fit our culture first and foremost so if you believe that could be you sign up for the free 1hour online
[35:32] presentation by clicking the link that's in your top right corner of your screen
⚡ Saved you 0h 35m reading this? Transcribe any YouTube video for free — no signup needed.