

The Simplest Scalping Strategy Ever
44sReveals a simple yet effective trading strategy from a brokerage analyst, sparking curiosity and debate.
▶ Play Clip"Title accurately describes a simple scalping strategy; the video delivers exactly what it promises."
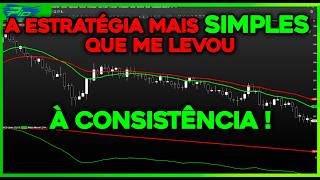
This video presents a simple and effective scalping strategy for 2-minute charts using two exponential moving averages (8-period blue and 17-period red). The strategy involves entering trades when the price corrects to the moving averages after a trend, with a fixed 100-point take profit and stop loss at the opposite moving average.
The strategy was learned from brokerage analyst André Charles and has been used successfully for a long time.
Two exponential moving averages: 8-period (blue) and 17-period (red). Chart timeframe is 2 minutes.
Blue MA above red MA. Price corrects to blue MA, wait for next candle that touches blue MA, then buy. Stop loss at red MA, take profit 100 points.
Blue MA below red MA. Price corrects to blue MA, wait for next candle that touches blue MA, then sell. Stop loss at red MA, take profit 100 points.
Multiple buy and sell examples on 2-minute chart showing entries at moving average corrections and successful 100-point exits.
In a live session, the strategy yielded R$425 profit across several trades, demonstrating its effectiveness.
This scalping strategy is simple, effective, and offers many opportunities on 2-minute charts. It relies on moving average corrections and fixed risk-reward, making it accessible for traders seeking a straightforward approach.
What are the two moving averages used in this scalping strategy?
8-period exponential moving average (blue) and 17-period exponential moving average (red).
00:40
What timeframe is used for this scalping strategy?
2-minute chart.
00:54
What is the take profit target for each trade?
100 points.
02:50
Where is the stop loss placed for a buy trade?
At the red 17-period moving average (below it).
02:33
What condition must be met for a buy signal?
Blue MA above red MA, price corrects to blue MA, and the next candle touches blue MA.
01:10
What condition must be met for a sell signal?
Blue MA below red MA, price corrects to blue MA, and the next candle touches blue MA.
03:03
Who taught the presenter this strategy?
Brokerage analyst André Charles.
00:24
How much profit was made in the live trading example?
R$425.
10:29
Strategy Origin from André Charles
Establishes credibility and long-term effectiveness of the strategy.
00:24Simple Buy Setup
Core technique: entry on moving average correction with fixed risk-reward.
01:10Simple Sell Setup
Mirror image of buy setup, demonstrating symmetry and ease of use.
03:03Live Profit of R$425
Concrete proof of strategy's effectiveness in real trading.
10:29[00:11] [Music] speaking 3, okay, here's the trailer, the player is showing you a personal strategy I learned a while ago, a long time personal strategy I learned a while ago, a long time ago, from the
[00:24] brokerage analyst André Charles. I saw him doing this, he taught it in this school, and I haven't stopped doing it since. I really liked it, I found it very simple and very effective, and I'm going to share it with you. It's something that has already given me great
[00:40] results. I've been using it for quite some time. We'll only need two moving averages here: a moving average of the Eurozone with an exponential period, and a
[00:54] red moving average of 17 periods, also exponential. The chart we're using here to perform the operations is the 2-minute chart. Here's the 2-minute chart, it works, and I'm going to explain to you how the
[01:10] simplest scalping strategy I've ever seen works, and it's also very effective. First, I'll draw it for you, just remembering that luck won't play a part in this strategy. Moving average crossovers are threats, but they are
[01:25] just references. So, let's draw it for you here. Let's imagine a for you here. Let's imagine a buy. We have here the eight-period blue moving average, it has to be... Above the
[01:42] be... Above the 17-period red moving average, 17-period red moving average, let's imagine the price is going up, going let's imagine the price is going up, going up. Those who know
[01:55] that it wants to start correcting today, it reached the moving average. You won't buy right away, you'll wait for the next one. When the next one
[02:07] next one. When the next one appears at the moving average, that will be our entry point. Yes, when the candle appears, if it appears already corrected at the moving average, at the blue moving average,
[02:20] that's our entry point. We 'll buy here. Look, place the stop
[02:33] below the moving average. It's better than the 17-period moving average. Let's place our stop will continue rising and will trigger our exit. Simple as that,
[02:50] folks, that's it, no points. The same way for selling, folks. But The same way for selling, folks. But
[03:03] we need to have the blue average below the red 17-period average. The 8-period average is blue, and the 17-period average is red, both exponential. Now let's suppose the price is falling, falling, and it decides to correct, correct,
[03:23] but correct. We'll wait for the next candle, the next one appears near the moving average. We'll assume that at the moving average... This
[03:38] will be our entry point, okay? We're going to enter here. Look, we'll place We're going to enter here. Look, we'll place the stop slightly below the 17-period moving average, but already red, exit at 100 points, right folks? Pay attention, the band that appeared
[03:52] here will continue to fall and will trigger our exit, simple as that. our exit, simple as that. I'll draw it for you now on the chart with the 500-point average of the chart itself. Later I'll show you what
[04:07] Later I'll show you what explanation with the chart running. I recorded it for you, I'll show you later. Okay, let's look at this example here. Look what
[04:22] we have to wait for. All this on the 2000-point chart, right? I only do sweeps on the 2-minute chart. I haven't tested any sweeps on the timeframe, only on the two-minute timeframe. Let's go. We have to wait here. Look,
[04:36] Let's go. We have to wait here. Look, the moving averages, in the case of a buy, the moving averages, in the case of a buy, are blue above the red. Go back here. So let's go folks,
[04:48] here's a drawing for you, right? The price appeared, the price went up, corrected the moving The price appeared, the price went up, corrected the moving average, corrected at the moving average, and I want it to
[05:01] appear at the moving average. You can see how the exchange rate, which is positive, appeared here. Below, look, okay, hopefully it appeared and already placed its buy order here, our and already placed its buy order here, our stop loss at the red moving average down here, and
[05:16] our environment without points, right? That was the first operation here, in this right? That was the first operation here, in this case, then the price went up again, went down in this favela 26, and it appeared at the moving average,
[05:28] so it appeared below this table here at the moving average, we're going to place our entry here, our stock at the red moving average, our old 100 points. The second change, again, the price went up, went down in this novel, appeared again
[05:43] at the moving average, sitting here, our stock at the red moving average, our environment without points. As you can see, it's very simple and offers us many opportunities on the chart, right? It's doing this type of
[05:56] operation, showing you here on the sell side as well. Look at the price, sell side as well. Look at the price, the price fell, corrected at the moving average, appeared
[06:09] here. Look, our sell would be here, no stop loss at the red moving average, our big one without points, once again it worked here again. The price went down and then fell, sorry, corrected at the moving average, appeared here at the next novel,
[06:24] our entry here, our stock at the red moving average, our client without points. Now I'm going to show you, it's the video I recorded when I was operating, you see in practice how it works. Hey guys, are you waiting now here on
[06:40] 2-minute chart setup, sent from Skype. The price is rising and the averages are already on the table, it's close to the red average. So, the buy signal is when the price corrects to the average. If the price falls, wait for a
[06:56] candle to appear below the high of the previous session. Vettel can make the buy order. And the candle appeared below the previous mark, corrected to the moving average, the stop loss is at the red average. Now, my dear,
[07:09] without points, now it's just a matter of waiting for the chart to unfold. And you can see chart to unfold. And you can see the monster in the drawing that the candle that appeared was below the high of the previous session and corrected to the moving average. That's what
[07:22] we need, no setup for this school. Now we just wait for the price to hit our 100-point exit. Very simple, folks, very simple - scoop.
[07:54] The price hits our exit, and we did it. In this exercise, we set up R$90 this exercise, we set up R$90 again. There, folks, the setup for this calculation is making another buy order, and our buy order now is a contract.
[08:08] Also, put the stop loss at the low of the last fifth because this time the 17-period moving average was well below the top. It's too long, it's not good to manage the risk well, it's not good to manage the... The risk is that with the top, it
[08:22] promises to stay the same, probably the same size as the club has now, due to the same size as the club has now, due to the exit of 100 points, so we already have exit of 100 points, so we already have 175 reais.
[08:40] the piece corrects at the moving average, so let's wait for it here. The next one, when it's let's wait for it here. The next one, when it's lower than the high of the last candle and corrects at the moving average, is corrected at the moving average. We
[08:54] 're on a 2-minute chart, so each candle is two minutes long. It pressured our operation, and that's it. Also, don't put a stop at the red average because the
[09:10] stock will probably be the same size as my target, and ideally, my stock should be smaller than my target. The moving average has to
[09:22] be larger than a stop, so it's important to know how to manage this when operating. Also, the price hit our exit, but without points. We made hit our exit, but without points. We made
[09:44] appears corrected at the moving average, and [Music] [Music] as it's lower than the high of the last candle, we can already make this purchase. I set up a setup for the candle to correct at the moving average,
[09:57] setup for the candle to correct at the moving average, even if it appears at the moving average. The top was 60 points and it's 45 points this time, guys, this will be 45 points this time, guys, this will be my last operation. A very good
[10:13] my last operation. A very good setup there, the Skol in the favela emerged, it emerged lower than the previous high in the previous round and it emerged corrected on the eight-period moving average, right? I entered there and now it's just a matter of waiting for the
[10:29] price to get out of the breakout, if there's a trend, following a trend. Doing this calculation is very, very easy, and by hope the very easy, and by hope the exit we made R$425 in these trades.
[10:44] I really hope you guys liked it, it's a very simple place, I consider this one of the simplest I've ever known and it's very effective too, as you could see. I hope you liked it, until the next video
[10:56] liked it, until the next video guys.
![The Moving Average That Anticipates Reversals (Forget the EMA) 🔓💰 [FREE]](https://img.youtube.com/vi/Hds7IuhwzFY/mqdefault.jpg)
![The Only Order Blocks Indicator You'll Ever Need [FREE]](https://img.youtube.com/vi/q10Cimko20g/mqdefault.jpg)
![The Exhaustions Indicator Is Much Better Than You Think [FREE]](https://img.youtube.com/vi/JL0ZXQmZKPo/mqdefault.jpg)
⚡ Saved you 0h 10m reading this? Transcribe any YouTube video for free — no signup needed.