

The Structure Breakdown Strategy Explained
44sClear, step-by-step explanation of a profitable trading strategy that viewers can immediately understand and apply.
▶ Play Clip"Delivers a solid strategy breakdown with real trade example, but the 'best strategy' claim is subjective and the screener setup is somewhat niche."
This video presents the 'structure breakdown' trading strategy for cryptocurrency, focusing on identifying trend reversals and entering trades on retests of broken levels. The presenter explains three formations, demonstrates a real trade, and shows how to configure a screener with specific settings and notifications to find profitable setups.
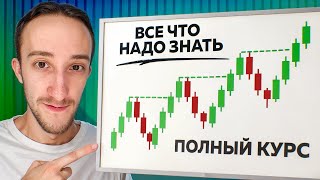
The structure breakdown strategy involves identifying a good trend, waiting for a rollback, and then entering on the confirmation of a structure break to profit from the subsequent move.
In an uptrend, the coin locally trends down, rewriting lows. The trader waits for the nearest highs to be rewritten (structure break), then enters on the retest of the breakout level, with stop loss behind the breakout and take profit at the nearest resistance.
Breakouts are best when there is a pro-torg level (accumulation zone) because it indicates strength and attracts more participants, making the move more likely to continue.
Similar to the first, but the coin approaches an initiative level, forms a pro-torg, and then breaks out. The entry is on the retest of the pro-torg level.
When there are both long and short levels (a box), the coin knocks out short levels, forms a pro-torg, and breaks out. The entry is on the retest, targeting the intersection of long levels.
The same formations work in the short direction when the coin is in a downtrend and forms similar patterns.
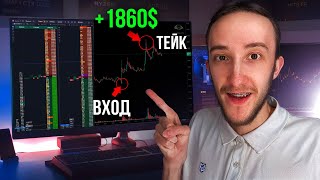
The presenter found a coin (BONG) with a good trend, high transaction volume (~2 million), and a pro-torg level. He entered on the retest, set stop behind the pro-torg, and targeted the nearest resistance, eventually taking +10% profit ($2,000).
The screener has tabs for top growth, volatility, decline, transactions, and volume surges. Each tab has settings for sorting, chart display (candles, levels, densities), and indicators.
Two price change notifications: one for 1-minute interval with 4% change, another for 1-hour interval with 10% change. Also a volume surge notification with 5-minute range, 5x surge, 2% price change filter, and volume from $5M.
The structure breakdown strategy is a systematic approach to trading crypto breakouts, emphasizing the importance of pro-torg levels and decisive exits. Using a screener with specific settings and notifications can help identify high-probability setups efficiently.
What is the core idea of the structure breakdown strategy?
Identify a trend, wait for a rollback, then enter on the confirmation of a structure break to profit from the continuation.
00:04
Why are pro-torg levels important in this strategy?
They indicate accumulation and strength, attracting more participants and making the breakout more likely to succeed.
01:29
What is the recommended stop loss placement?
Behind the pro-torg level (the breakout level).
01:16
What is the recommended take profit target?
The nearest resistance level.
01:16
What are the three formations described for the strategy?
1) Breakout after a local short trend, 2) Breakout after approaching an initiative level, 3) Breakout after pinning short levels in a box.
00:19
What notification settings are recommended for price changes?
One with 1-minute interval and 4% change, another with 1-hour interval and 10% change.
10:25
What is the volume surge notification setting?
Time range 5 minutes, surge 5x, price change filter 2%, volume from $5 million.
11:07
Pro-torg levels attract participants
Explains why breakouts with pro-torg levels are more reliable, a key insight for traders.
01:29Real trade with +10% profit
Demonstrates the strategy in action with a concrete example, showing entry, stop, and target.
04:13Exit at decisive points
Emphasizes the importance of not overstaying and exiting when the formation becomes invalid.
07:35Notification setup for active coins
Provides practical screener settings to catch big moves, useful for active traders.
10:25[00:04] how you can make money trading according to the structure breakdown strategy. This strategy is that we have a good trend in one of the directions. We wait for a rollback movement, after which the structure is broken. We enter for its
[00:19] confirmation, after which we earn. Graphically, the formations for this strategy look like this. Let's analyze these formations, after which I will show my transactions and configure the screener so that it shows good formations for this
[00:33] strategy. The first formation according to the structure breakdown strategy is that we have a good trend in longs, after which the coin locally begins to flow into shorts. We wait for the moment when we experience the structure breakdown itself. That is,
[00:48] when we have the first HI, I rewrite that is, the coin has grown and it has started a local short trend. That is, all our lais are rewritten and the coin locally begins to fall into shorts. Our task is to wait for the
[01:01] nearest highs to be rewritten, which is what their retest is. We enter and pull the position to the nearest resistance, this can be a high that stopped all movement or Some levels and we get the situation that
[01:16] our entry point is for a retest of the breakout. Our Stop Loss is located behind the pro-torg level itself and the take profit is already at the nearest resistance. I also wanted to note that the breakout is best worked out. When we have a pro-torg level, it shows
[01:29] that in this place we had an accumulation, strength appeared and after which it will be easiest for us to go long. But when we simply rewrote some High without a pro-torg level, this is not very good because fewer people
[01:42] will be able to see this formation. And with a pro- torg, this is much easier to do and therefore when the coin approaches a retest, when it is already in this place, then everyone will connect and push the coin in the direction we need
[01:56] because people who are long here, this is this, they will also be long in this place. Some of the shorts here will dump positions, someone will be added here at the moment of the breakout, someone will enter the retest, those people who
[02:09] entered short from here, the coin will be fixed. Someone will enter from the break and as a result we will have a good movement in longs. Let's analyze the following formation. It looks like this. Here we also have a good
[02:22] trend, but the formation looks a little different because we already have a good initial level of langa after which the coin begins to approach the initiative to the place that formed the level next to this place
[02:35] formed the level next to this place it begins to protor. Say, the
[02:48] only formation looks a little different. Let's move on to the next formation. This will already be a formation of a breakdown of the structure after the levels are pinned. We also have a good trend here and now Now we have levels in langa
[03:01] and levels in shorts, that is, we are standing in such a box and after the coin knocks out shorts and levels, it begins to protor. Say,
[03:16] also enter a stop behind the protor. gov and drag our position until the intersection of long levels. Why is the pinning of short levels considered here because our coin is initially in a log trend and that is,
[03:28] we have priority. To go long according to the trend, therefore, a withdrawal of liquidity from short levels is expected here, after which the break itself is formed. All these formations are also worked out well and they work in the same way in shorts,
[03:43] direction. When our coin begins to dump heavily, it spills into shorts, it forms exactly the same formations and we work them out in the same way. I also wanted to remind you that we have a Telegram channel in it, we post current
[03:59] updates on what we are currently working on. And what we are currently adding to the screener. We also have a Telegram chat in it, you can see the current settings. How to use the screen, see frequently asked questions, point out bugs, share current ideas,
[04:13] share formations, communicate with anyone interested. I will leave links to both Telegrams in the description under the video. Thank you all. Let's now move on to working out the deal itself. I went into the screener, found an active coin, saw that
[04:27] it has a good trend. In this case, the coin was 1,000 bong during this period of time on the coin. There were almost 2 million transactions and this is very good. An indicator that the coin is active, it also had a good trend on the hourly chart, after
[04:41] which the coin formed good levels in longs, began to flow down, approached our initiative, and near this initiative formed a pro-torg gov, then exited it, and on the retest of this pro-torg gov, I already entered the trade, set my stop behind the
[04:56] retest of this pro-torg gov, and my goals were to take the long movement, pulled it to the nearest resistance, that is, to the nearest level, as a result, we began to approach our pro-torg gov, I decided to set my limits,
[05:10] after which I set them on the retest itself and then waited. We are getting closer, it takes me into the trade, then I set my stop behind the pro-torg itself. And after that, I monitor the position itself, I see how everything will
[05:25] develop. I left this trade overnight, woke up in the morning, saw that we were already approaching the nearest level, opened the glass, began to watch how we behave in the glass, what is happening. What kind of activity is being pushed by
[05:38] densities or not. And the priority would be to take another second level and take a good movement after it intersections, so here I was in no hurry to fix the entire position at the nearest level. Although the plus 2,300 dollars is already stretching,
[05:53] this is quite pleasant, there could have been prerequisites for fixing. I also looked at the correlation itself,
[06:06] it was 30% over the last hour, this is within the normal range, indicating that the coin moves on its own and does not repeat the Bitcoin chart. Also, the coin retained a large number of transactions on it. There were almost 2 million transactions and this
[06:20] indicated that the coin is active and now there is an increased chance that it will break these levels into langs, so here I decided that there will be stops for the nearest structure and when approaching it, I will already look at how the coin
[06:33] will behave. Of course, these transactions can be processed in different ways, either fix part of it and continue to drag, or fix everything, or just stop for the nearest structure for some slope or for the nearest low that
[06:48] we have. And thereby take a good ratio in transactions. Here, I basically measured the potential, we could I could have easily gone to the longs for another three percent and I could have taken them too, but then I started to approach the
[07:06] $2,000 and take the greenback that they gave me. Also, if a new formation appeared on the coin, I would have simply moved and worked it out in several transactions, which is what I ultimately did. Well, here we already had this kind of inclination, they started
[07:21] trading at a local level, and therefore, if we started to cross all this, then a short breakout would have already begun and shorts, so in order not to overpower, I decided to exit. As a result, this is what happened after I exited the trade, the coin
[07:35] broke through this inclination and a short movement had already begun, so it is important to understand that you do not need to overpower and set yourself some lofty goals, but you need to exit at decisive points. After crossing which, your formation
[07:49] becomes no longer relevant. Well, this is how this trade looks in the diary. I entered according to the strategy, a breakdown of the structure, this was our break when there is a clear level in the longs, we approach the initiative, we create Protor gov I go to retest the stop behind the
[08:03] protor gov and already pull to the nearest resistance, that is, in this case, it was the nearest level as a result of this transaction it was possible to take plus 10% and earn plus 2,000 dollars. The transaction turned out to be quite technical and the
[08:17] entry point and exit point were worked out in decisive places, thereby allowing me to earn from this transaction. By the way, if you have any questions or you want to add a new function, be sure to write in the comments, we read everything and
[08:30] take it into account in our future work. Thank you all very much for your feedback. Well, in order to find good formations and work them out efficiently, the screener for the structure breakdown strategy helps very well. We can set up the following
[08:43] tabs. These are the top growth, top volatility, top decline, top by number of transactions and tabs with surges. All these tabs have the same settings. You can go and copy my settings. The only thing that is different here is the
[08:57] sorting because here we sort coins according to different scenarios. That is, we have volatility, the number of transactions, top growth and top decline, and from each of these tabs we take Top 5-10 coins and we are already trading them, we use them for
[09:12] trading. Next, we have the chart settings. Here you can set the number of candles, that is, select the desired scale for the chart. You can also enable levels, trend levels and densities. Next, we have indicators. You
[09:25] can set technical data about the coin, specify the settings you need, and then see them. And thus, with this, you can also earn money. We recently, by can also use them for your trading. Click the save button and
[09:41] workspace with which we can select coins according to the strategies we need, and according to the surge in volumes, we can use such settings, you can also copy them for yourself. Here, we set from 5 million so as not to limit ourselves to
[09:57] coins that have just become active. We sort by the surge in volumes, you can also set the necessary filters for yourself here. I the chart, here we set horizontal levels, trend levels and
[10:12] densities, we can also enable them and see good densities by coins. Click save and see the coins on which there was a surge in this period of time. which Volumes are just increasing, also in order to
[10:25] look for good coins, you can enable notifications. Here we go below, click the create button, then select price changes and here we set the following settings: interval 1 minute, change 4% direction, all, and
[10:39] with this setting we can see those coins that are just experiencing a big movement. I also use a second notification for price changes. Here I already have an interval of 1 hour, change 10% direction, all, there is
[10:53] a filter by volume, and with this setting I can see those coins that are experiencing a pump, those coins that are active right now. That is, it has grown or fallen, has already moved a little, and I receive a notification. To
[11:07] see coins that have just experienced a surge in volumes, I use this setting: select the parameter "volume surge", time range 5 minutes, direction, all surge 5 - this is X, that is, how much
[11:20] more volume there should be in the specified time interval, price change filter time interval, price change filter 2%, I set the volumes here from 5 million to get illiquid coins, and I get notifications that I
[11:33] use in my trading, for example, by I received notifications because of the surge in volumes. Let's look at the band, it's 11%, that is, the volumes specified time period, the volumes have increased, and on the chart it looks like this:
[11:49] the coin began to fall sharply, the volumes increased, notifications arrived, and we can already take this into account. By the way, if you want to receive can choose the direction so that only long movements come or only
[12:03] short ones, thereby choosing the best option for you. Well, this video will come to an end. Thank you all very much for watching. Shake hands. Have fun. Have a for watching. Shake hands. Have fun. Have a
[12:16] great time. The belly stretches and inflates. Green and green. Goodbye, bye, bam!


⚡ Saved you 0h 12m reading this? Transcribe any YouTube video for free — no signup needed.