

Why Smart Money Controls Price
60sChallenges common beliefs about supply/demand, offering a contrarian view that intrigues traders.
▶ Play Clip"Title accurately promises Smart Money basics and logic; video delivers with examples and clear explanation."
This video explains the Smart Money concept, a trading strategy that focuses on how large capital manipulates price movements by targeting imbalances and liquidity. The presenter argues that price moves not due to supply and demand but because algorithms seek to fill imbalance zones and collect stop-losses from retail traders.
Price moves due to large capital manipulating the market, not supply/demand or retail traders.
A structured strategy that predicts price direction by focusing on imbalance and liquidity.
Smart Money is based on balance (imbalance zones) and liquidity (stop-losses).
Price moves to restore balance in inefficient ranges and activate stop-losses for liquidity.
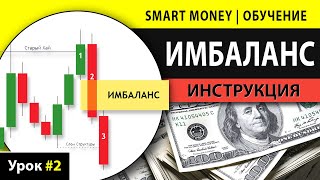
A three-candle formation showing clear imbalance between buyers and sellers; acts as a price magnet.
Stop-losses and pending orders accumulate behind significant highs/lows; smart capital targets these.
Large players move price opposite to intended direction to activate stop-losses and fill orders.
Bitcoin chart shows imbalance zones and liquidity grabs leading to reversals and trends.
Price always fills imbalance zones and collects liquidity; these are the core of Smart Money.
The concept works on all timeframes; imbalances exist within larger imbalances.
TradingView indicators can automatically mark imbalance zones; links in Telegram.
Combine imbalance with order blocks, breaker blocks, mitigation blocks, and candle shadows for accuracy.
80% of market is in sideways trends; separate video on trading them with Smart Money.
The Smart Money concept provides a logical framework for understanding market manipulation by large players. By focusing on imbalance and liquidity, traders can predict price movements and improve profitability.
What are the two main postulates of the Smart Money concept?
Price will always strive to fill imbalance zones and collect liquidity.
10:48
What is an imbalance in Smart Money?
A three-candle formation showing a clear imbalance between buyers and sellers.
04:01
Why do large players manipulate price?
To activate stop-losses and fill their orders in the opposite direction.
05:37
What percentage of market time is spent in sideways trends?
80 percent.
13:41
What additional elements should be combined with imbalance for accurate predictions?
Order blocks, breaker blocks, mitigation blocks, and candle shadows.
12:57
Why Price Moves
Clarifies that price moves are driven by large capital, not retail supply/demand.
03:33Imbalance Definition
Defines a key technical formation that acts as a price magnet.
04:01Large Player Manipulation
Explains the mechanism of stop-loss hunting by smart money.
05:37Two Postulates
Summarizes the core principles of the entire concept.
10:48[00:02] the market is falling or rising, what actually moves the price up or down? Why the market turned around at this particular point? Technical analysis and indicators indicated a reversal elsewhere. Why were you stopped out again, and then
[00:18] the price still went in the right direction, but without you? Watch this video to the end and you will learn how the market really works and what how the market really works and what really moves me.
[00:39] on the Smart Money concept. Everything you hear now I will back up with real examples on the chart and you will see that the Smart Money strategy is easy to test in practice. Unlike conventional technical analysis and any other theory, there
[00:52] is a clear structure here that, with the right analysis on your part, I always emphasize, will give you an understanding of how the market will develop in the near and long term. When you master this concept,
[01:07] your profitability as a trader will increase significantly. You will always know how to find an entry point with a high level of profit and a low level of risk. You will clearly understand where to place a reasoned stop loss and where to
[01:20] take profits. The Smart Money concept. It allows you to build a clear trading strategy where everything is logical and understandable.
[01:38] important news for you. In my Telegram channel, I constantly post reviews of trading situations that arise during the day for different coins to make it easier for you to find profitable setups there. I share my trades and analyze
[01:52] them. I publish lists of coins for the current day that I trade myself. I give recommendations on where to enter a trade and where to exit. We post a lot of useful tips and life hacks that are not on YouTube. I help beginners achieve a stable profit, and
[02:08] experienced traders improve their trading skills using the SmartMoney concept. I collect all the questions that you send and then give a detailed answer to them in case of emergency situations in the market, whether it be a sudden plan or a sharp drop. I
[02:22] go live whenever possible and give my recommendations and analysis. And most importantly, all this is absolutely free. Join our community and we will trade together. The link to my Telegram channel is in the description.
[02:42] Smart Money concept is based on balance and Liquidity. Next, I will explain as simply as possible what it is and show how it works on a it is and show how it works on a real Bitcoin chart.
[02:59] that the price falls or rises not at all because there are because there are more sellers than buyers in the market, or vice versa, not because of the pressure of buyers or sellers,
[03:11] supply and demand. Here, ordinary traders and the so-called crowd also do not play a special role. They do not influence the price in any way. Remember, large capital controls one hundred percent of the price movement.
[03:33] why the price actually falls or rises: first, to restore balance in the ranges where the price was offered ineffectively, and second, to activate a stop loss. Because
[03:47] large players need liquidity to effectively accumulate their position. That is, to correctly determine the future direction of the price and make money on this, we need to focus on only two things: imbalance and liquidity.
[04:01] two things: imbalance and liquidity. They act as a magnet for the price. Market algorithms always strive to effectively balance the price, and smart capital needs liquidity to accumulate its huge position, and stop loss and
[04:17] other market participants act as this liquidity. imbalance is. Imbalance is a three-candle formation that clearly shows that
[04:29] in this area there was a clear imbalance between sellers and buyers. I will not dwell on this in detail now, since there is a detailed video about the imbalance on my channel where I talk about how it works and why the price
[04:42] returns there. The link to this video is now on the screen and also in the description. Be sure to watch it, since this is the basis without which you cannot do and a few words about liquidity in the market, a huge number of transactions are opened in
[04:56] different directions every second. Of course, traders set protective stop-losses and also set pending orders to enter on the breakout of important levels. According to classical technical analysis, everyone is taught that stop-loss should be hidden behind significant
[05:09] highs or lows and also enter on the breakout of important highs and lows in the hope of developing further movement. Based on this, it is obvious that a movement. Based on this, it is obvious that a
[05:23] pending limit orders accumulate behind significant highs. This is obvious to you, it is obvious to me. And of course, it is also obvious to representatives of smart capital, but they have one problem: but they have one problem: money in the market does not come out of nowhere
[05:37] for a large player to gain a huge position in Long or A short needs someone to buy or sell the required volume, but how can this be done when it is needed? A large player cannot simply mindlessly buy or
[05:52] sell a truly huge position volume at the market price, since this will provoke a sharp rise or fall, which will ruin the price for himself. So, how can large players solve their problem correctly? They need to manipulate. That is, short-term, move
[06:06] the price in the wrong direction to activate a stop-loss and, at their expense, fill their orders, which have already been placed in advance in the opposite direction. As a result, large capital, at your expense,
[06:19] gains its position and, after the above manipulation, moves the price in the right direction. But only after you have been knocked out by the stop. A familiar situation, isn't it? But I can reassure you. This series of educational
[06:33] videos will teach you to understand the market and all the manipulations of large players. You will be able to open profitable positions moving in the same direction as representatives of the so- called smart money. Now let's move on to real examples and
[06:48] you will see that the Smart Money concept really works and it is easy to check on the chart. This is the really works and it is easy to check on the chart. This is the We will not delve too deeply into history, let's consider this price range. Over the
[07:01] past six months, it has been clear that the market has been bearish, and at the beginning of June, we saw another powerful decline during which liquidity was removed from these equal Lows, as well as from this and this Low. This was a powerful impulse movement
[07:15] Low. This was a powerful impulse movement into the 18,000 range, after which a correction began into the 25,000 range. If you look at the chart from the point of view of classical technical analysis, it is difficult to determine why the price reversed
[07:27] exactly here. It would seem that the previous significant Low, after breaking through it, should have become a resistance level. And a correction into the area of this level should have been expected, but no, the price reversed earlier. Do you want to know why everything is simple? During this
[07:44] impulse decline, an imbalance formed, and this is exactly what became a magnet for the price. I knew that the price would reach this area even when we were trading here. Now,
[07:56] let's analyze how this corrective movement was formed. We saw rising highs and lows. The price formed an upward movement, luring in poorly informed traders. Blondie. Where do you think they placed
[08:10] Blondie. Where do you think they placed their stop-losses correctly? Behind all these lows, accordingly, throughout this entire movement, trend liquidity was formed in the form of stop-losses of weak market participants. This is exactly what Liquidity
[08:23] then acted as fuel for the further rapid fall of the price. What was happening in the imbalance area? Here we see manipulation of highs. The price repeatedly updated liquidity behind these highs, knocking out the stops of uninformed
[08:39] market participants who tried to short ahead of time. At the same time, smart capital, carrying out such manipulation in the imbalance area, filled its orders in the short and after it gained the required volume of the short position, we saw the
[08:54] final manipulation in the form of a small twitch upward, after which there was a sharp movement in the downward direction and here there was a cascading activation of stop-losses of those who entered Long during the previous movement. We go further
[09:09] here we also observe a sharp impulse movement during which a impulse movement during which a new imbalance was formed. Here it is and then Everything repeated itself. The market again collected the stops of participants who were behind
[09:22] each of these Highs and again the price was algorithmically delivered to the imbalance zone where another reversal occurred.
[09:34] impulse movement during which another imbalance was formed. Then a local sideways trend was formed where for a Liquidity accumulated in the form of stops above and below this range, then we saw the removal of
[09:48] stops from the upper part of the sideways movement with partial filling of the imbalance, then we see another manipulation where the liquidity of these equal Highs was removed and this imbalance was almost completely filled and once again we see a
[10:04] price reversal in the imbalance zone and then a sharp drop, the stop losses that stood behind each of these layers became fuel for such a rapid fall, this is also trend liquidity. And when Lows or Highs are close to each other,
[10:19] their cascade activation usually occurs and the price movement like a Snowball develops sharply and rapidly, which we see on the chart, this was quite expected. I think the most attentive of you have already
[10:32] noticed that a bearish imbalance is forming here again. And lo and behold, right now we are already moving in its direction, most likely, it will also soon be filled. So, I emphasize your attention again, the price
[10:48] will always strive to do two things: fill the balance with it and collect liquidity. These are the two main postulates of the Smart Money concept. Even if you don’t believe me, just open the chart and run backtesting histories and you
[11:03] will see how much These are effective tools for predicting price movements. Everything I've just told you will work equally well on any timeframe, from monthly to minute, because the market is fractal, and it doesn't matter if you're
[11:18] the market is fractal, and it doesn't matter if you're swing trading or scalping. Balance will be formed on all timeframes. Moreover, as a rule, within the daily imbalance, you will find a 4-hour, 15-minute balance, and so on. As a result,
[11:33] moving to a lower timeframe, you will be able to determine the potential price reversal zone as accurately as possible and open a more accurate position. At first, it will be difficult for you to visually determine the imbalance area on the chart.
[11:46] Therefore, I recommend using special indicators in Trading View that will do this work for you and automatically mark all imbalance zones on the chart. They work very clearly and it looks like this. These
[12:02] indicators will greatly facilitate your analysis. Links to these indicators, as well as the necessary settings for them, can be found in my Telegram channel. Be sure to subscribe to it. The link is in the description. There I post many useful tips that are
[12:16] not on YouTube. I publish my forecasts for the cryptocurrency market and analytics, and also share I make my trades and give recommendations on which coins are worth paying attention to during the day. There is only unique and necessary information.
[12:29] You probably have a logical question. If their balance is liquidity, these are magnets for the price. Is it possible to simply open a trade in the imbalance zone and wait for the price to reverse. Sometimes this will be appropriate. I talk about this in a separate video
[12:42] about imbalance. The link is in the description. But there is an important point. Most often, imbalance cannot be an independent tool. In order to accurately determine the price reversal area, in order to understand where to place a short stop loss and more accurately
[12:57] predict where to fix the profit, you must take into account additional elements such as an order, blog breaker, mitigation block, and candle shadow, which are also an integral part of the smartmoney concept.
[13:12] There is a separate video on each of these elements on my channel. Links are on the screen and also in the description. Be sure to study these lessons without them, you will not be able to trade effectively. This is very important. Remember, the price will not reverse from
[13:26] every balance. It is very important to learn how to correctly combine imbalance with the above-mentioned elements of the Smart Money concept in order to correctly predict the price reversal area. By the way, this entire range This is a large
[13:41] sideways trend, it is also commonly called Flat Range and other synonyms, and 80 percent of the time the market is in such sideways trends, so you will have to learn how to trade them, because trading in a flat is significantly different from trading
[13:55] with a trend. On my channel, there is also a separate training video on how to trade in a sideways trend using the smartmoney concept. The link is on the screen and also in the description. So, you have already been able to see from real examples that the
[14:10] smartmoney concept really works and it is better than any other type of analysis. Just open the chart and check it yourself on history. It has always worked and will work in the future. Because this is how the market is structured, price movement
[14:24] is carried out by algorithms that ensure market efficiency and will always strive for the balance zone, while simultaneously collecting liquidity, which will act as fuel for further impulse price movement, and
[14:37] this will be repeated over and over again. In conclusion, like and subscribe to the channel. This motivates me to make new useful videos. Also, write in the comments. What topic would you like to see a new video on? If your
[14:51] comment collects enough likes, I will record a video on the topic you ask about. Good luck to everyone. and trade wisely


⚡ Saved you 0h 15m reading this? Transcribe any YouTube video for free — no signup needed.