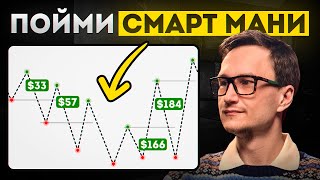

The Potato Market Trick: How Big Players Manipulate Price
43sUses a relatable and humorous vegetable market analogy to explain complex market manipulation, making it accessible and engaging.
▶ Play Clip"Title promises a key insight for profitable trades; video delivers detailed explanation and examples, though some self-promotion."
This video explains how large players (smart money) manipulate financial markets by creating liquidity traps. The presenter uses a vegetable market analogy to illustrate supply and demand dynamics, then shows how to identify liquidity zones using volume indicators, technical analysis patterns, and specific entry signals.
Large players (smart money) manipulate prices to enter or exit positions profitably. They use liquidity from retail traders.
A large seller of potatoes must lower prices to sell quickly; a large buyer drives prices up. Supply and demand determine price.
Adding a volume indicator to the chart shows bursts of volume at market turning points. Each volume spike often precedes a reversal.
If a large player wants to buy, each subsequent purchase is at a higher price (slippage). Example: buying 20 tons of potatoes raises the price.
A market order for 30,000 rubles caused a loss of 4,000 rubles (10%) due to slippage. For a 300 million rubles position, slippage would be 30 million.
Large players create fear (e.g., fake news) to make retail traders sell cheap, then buy from them. This is a win-win for the large player.
Unexpected news (e.g., Trump or Elon Musk statements) causes market moves. Large players use this to enter/exit positions against the crowd.
Classic patterns (flags, pennants, head and shoulders) are where retail stops are placed. Large players drive price to these levels to collect liquidity.
Support/resistance levels often see false breakouts (liquidity grabs) before reversal. Example: Bitcoin 4-hour chart shows level breakouts with volume and reversal.
Trend line breaks often lead to liquidity grabs and reversals. The market breaks the trend line, then reverses.
Volume spikes confirm that a large player was involved. After a liquidity grab, volume appears and a reversal occurs.
The signal is a compression phase (small candles or tails) followed by an impulse in the opposite direction. Example: after a level breakout, compression candles then impulse down.
Shows a sell trade: entry after compression, stop behind impulse candle, take profit at next level. Also a buy trade with double bottom liquidity grab.
The key to trading with smart money is identifying liquidity zones (where retail stops are) and waiting for a volume-confirmed reversal signal. This strategy works over the long term, with occasional stop-outs but overall profitability.
What is liquidity in financial markets?
Liquidity refers to the ability to buy or sell an asset without causing a significant price change. In the context of large players, it is the volume of orders (often stop losses) that they target to enter or exit positions.
00:02
How does a large seller affect price?
A large seller increases supply, causing the price to fall as they sell at lower prices to offload their position quickly.
00:26
What does a volume spike on the chart indicate?
A volume spike often indicates the presence of a large player and frequently precedes a price reversal or stop.
01:44
What is slippage?
Slippage is the difference between the expected price of a trade and the price at which the trade is actually executed, often due to large order size.
03:54
How do large players use news to manipulate the market?
They use unexpected news (e.g., Trump or Musk statements) to create market moves, then trade against the crowd's reaction.
07:08
What are common liquidity zones in technical analysis?
Classic patterns like flags, pennants, head and shoulders, support/resistance levels, and trend lines are common liquidity zones.
08:44
What confirms a liquidity grab?
A volume spike on the breakout candle confirms that a large player was involved in the liquidity grab.
12:22
What is the entry signal described in the video?
A compression phase (small candles or tails) followed by an impulse in the opposite direction, with the impulse larger than the compression range.
14:17
Where should a stop loss be placed in this strategy?
Behind the impulse candle that triggered the entry.
15:34
Vegetable Market Analogy
Simplifies complex market dynamics into an intuitive example of supply and demand.
00:26Volume Indicator Reversals
Demonstrates a practical tool for identifying turning points.
01:44Large Player Liquidity Strategy
Explains how large players create fear to buy cheap from retail traders.
05:31Technical Analysis as Liquidity Zones
Reverses the typical use of patterns: trade against them.
08:44Entry Signal: Compression + Impulse
Provides a clear, actionable trigger for high-probability trades.
14:17[00:02] but also very often there are large players who manipulate the price. In this video, I'll tell you how to take money from a major player and how to find liquidity. And you are very lucky that you found this video. You've
[00:14] often heard these phrases: "Liquidity there, liquidity." Here the liquidity collection took place. What is this liquidity? How to find it? How to use it? How to make money from this? Today I'll tell you everything.
[00:26] Large players, also known as smart money, position. Let's put aside financial markets for a moment. Let's assume this is an ordinary vegetable market. Here you are as buyers. And
[00:40] there is also some seller who sells, for example, potatoes. The price of potatoes takes everything into account. That is, it takes into account the supply of these very potatoes, the harvest of these very potatoes, the demand for these potatoes, the amount of goods
[00:52] rotting, taxes, depreciation, VAT. Everything notorious potatoes. Now, let's assume that a large truck with these potatoes arrives at this same market, and it needs to sell 20 tons of potatoes
[01:05] as quickly as possible. What will happen to the price? It's clear that the Armenians who are at the market are not idiots. They will sell these potatoes cheaper in order to get them off your hands faster. They understand that if they
[01:18] don’t sell for 45 now, they will sell for 35 later at a loss. this reason, they will sell and clear out these very potatoes faster, because there are many offers. The entire market operates on
[01:31] cause and effect relationships, and most importantly, it operates on supply and demand. In our example there is a lot of supply, that is, a lot of potatoes. fall. Let's go back to the market and see how this happens in
[01:44] practice. Let's add a volume indicator to the chart . To add volumes, you need to click on the indicators, enter the volume in the column, select the volume and add it to the chart. Volume shows the amount of volume that has passed in a
[01:56] given timeframe. Well, if you opened 4 hours, for 4 hours you will see a column with volume. What does this volume give us? Yes, notice how the market reacts to these volumes. Look, there's a burst of volume, the market is turning around, there's a burst of volume, the
[02:09] market is turning around, there's a burst of volume, the market is turning around. After each surge in volume, either the price stops or a reversal occurs. Here we have a surge in volume, a reversal occurs, a surge in volume, a
[02:21] reversal occurs, a surge in volume, a reversal occurs, a surge in volume, a reversal occurs. You can continue this indefinitely, and it works on any cryptocurrency, a stock, or even
[02:33] work because there is a lot of volume coming into the markets . The market will react to this volume . Now let's imagine a slightly different situation. We have the same truck, but it doesn’t want to sell 20 tons of potatoes, but rather it wants to buy those
[02:47] same 20 tons of potatoes. What will happen to the price? The Armenians who are at the counter are not morons, of course. What will they do? They you have a large position, you need these potatoes , and, accordingly, each
[03:00] subsequent kilogram will be more expensive for you. Let's say you bought the first kilogram for 45, and you buy the last one for 450 rubles. And this is a completely normal phenomenon. If you are from Russia, you may remember, for example, the situation that
[03:13] happened with eggs, how eggs were expensive, or the situation that happened with buckwheat. Or when, for example, there was COVID, these fabric masks, the cost of a mask was 12 kopecks. sold for 25 rubles. one mask. Because Russia lacks a fully-fledged
[03:27] economy, we constantly experience these kinds of imbalances. Without going far, we can recall the cost of gasoline. If you live in Moscow concern you, because it is a different planet. And if you live in the so-called
[03:41] gasoline prices. That is, gasoline prices are constantly rising, and gasoline is now more expensive than those same Americans. Why? Because the mineral processing plants are being blown up systematically, our demand remains at the same level, but supply is limited.
[03:54] Consequently, the price rises upward. See how this looks in practice. Here we have a price chart. Pay attention to him, how he looks. Yes, now I will make a large position with a market order, and our price will rise
[04:06] because there will be more demand. I click buy and my chart grows. Well, futures and see that the chart actually went up at that time. Now, buy some more. If I want to close the position,
[04:19] direction in the same way. I click close position, confirm. And, you see, my schedule has dropped. Please note the graph for the day. And notice that there is a understanding of slippage. That is, each of my subsequent transactions, each of
[04:34] my subsequent orders was at a more unfavorable price for me. Now recalculate, and my loss here should be at least twice as large . So I have a loss of 4,000 rubles here. This thing is called
[04:48] slippage. And look, it turns out that I lost 4,000 rubles in addition to the investment amount, and the amount here was 30,000 rubles . That is about 10%. Now let's imagine that my position is not 30,000 rubles, but, for example, 300 million
[05:03] rubles. Then my loss will not be 4,000 rubles, but at least 10%. That is about 30 million rubles. Naturally, this is not beneficial to anyone. Moreover, I must compensate for the growth of the movement of this security. That is, it must
[05:17] grow by 10%, otherwise I will lose money. It is for this reason that large players normal liquidity in order to enter with minimal costs. In the same way, exit with minimal costs. Let's go back to the vegetable
[05:31] market again. How can we get these Armenians standing at the market to sell us their item for 45 rubles? What needs to be done to make them happy to what if, for example, a guy with a mustache comes to this market and says: "Guys,
[05:47] potatoes?" Tell me: " Where is your potato supplier?" We will take your potatoes until the reasons are clarified. We'll pick it up tomorrow. What will the Armenians do? potatoes. They understand that if they don’t sell these potatoes now,
[06:00] they will sell them later at a very unprofitable price. And as long as they sell these potatoes, I will continue to buy from them. And look, this is what we get: win-win. On the one hand, we have entered additional information, they are selling us this position, they are happy
[06:14] that they are selling this position, and we are happy to buy from them. The same thing happens in financial markets. Exactly the same. A major player deliberately drives the price to a point where you will take actions that seem more profitable to you. And
[06:28] some loss or fixing your position, perhaps even a profitable one, a major player will do the opposite. It will load, and for it, you are, in fact notorious liquidity. Please give this video a like, as
[06:43] you've probably never heard about liquidity in such detail before . . I have a divine gift of telling everything , well, just using elementary
[06:55] examples. Please like this video. So, let's summarize this block. In order to enter a position, a major player needs money, that is, he needs relictiness. To do this, he uses various kinds of situations
[07:08] in which you will make certain positions that are beneficial to him. If you buy from you, and if you buy, he talk more about technical aspects, such as how big players put
[07:21] the crowd into a position and force them to do something. The first way is news, sudden, unexpected news or statements. Absolutely everyone does this Trump. This morning he says something, for example, and then in the evening
[07:34] I'm my mom's little girl, I have a net in my hand." That is, I said, well, the guy said it, the the complaint, so to speak? But when he says something, the market reacts to it. Do happens. The market rises or falls on his statements, and at that moment his
[07:49] . Elon Musk, for example, acts in exactly the same way. So he says, "Guys, I'm buying all my Dogcoin, or Tteesla is going to buy Dogin. Dogecoins are starting to rise by 100, 200%, and he's making money off of that
[08:02] . While the crowd is buying, the big players, the rich people, are pulling out, taking your money, and you're falling for their hype." Naturally, for this reason, it is important to make a statement. If you hear
[08:15] someone yelling loudly there, like, "Tomorrow there's a nuclear war, we'll bomb the United States," do the opposite. If the market falls and reacts negatively, it most beneficial to someone. Obviously, a lot depends on the situation here, but overall, you get
[08:30] my message. An important factor in this news is that it is always unexpected. Nobody bolt from the blue. Do you understand? The next thing that big players use is, of course, they use liquidity spots on the chart. Where do
[08:44] Where people will go out according to their hundred orders. And here are the places where market participants will suffer a fiasco. The first is classic, outright technical
[08:56] analysis. All these pennants, triangles, heads and shoulders and all that stuff. How to understand where liquidity will be in technical analysis? To do this, type technical analysis into any search engine, open the images and find
[09:09] similar schemes. Let's open these very diagrams. And now let's try to understand where the stop-freezes will be located. This is how the crowd trades. So what does the crowd do? She downloads these kinds of pictures and now, excuse me, it's
[09:22] so funny, and they're trying to make money on the market using the pictures and, What will a major participant do? A large private investor, if he wants to go, if there is a bullish flag in the markets, for example, he will simply
[09:35] make some moves, he will simply short this instrument a little , that is, he will sell this instrument a little and lead you to stop-losses. Accordingly, if a bullish flag appears in our markets, the market will most likely move against this bullish flag,
[09:47] that is, there will be a takeout and a reversal in the opposite direction. If it is a pennant, the same will happen . Bullish falling wedge is the same. That is, look where, so to speak, the stops of market participants are.
[10:00] And with a high probability, the market will just start collecting stops, liquidity. That is, we study technical analysis, classical graphical analysis. Well, in science it is called graphical
[10:15] analysis. We study graphical analysis not in order to trade with it, but in order not to trade with it, but to trade in the opposite direction. That is, the liquidity will be, where the market participants will be who
[10:28] will suffer a fiasco. This is where the liquidity will be located. Make sure you watch this requires a certain filter, which I'll talk about a little later. The second place of liquidity is levels. You've probably heard this
[10:41] stuff. In fact, levels work, but they work through liquidity captures. I have more details on how to course called Start Trading Without Deception. I promise this isn't an
[10:54] specifics. Please scan the QR code and check out this course. Everything is absolutely free. Listen, we won’t even go far. Here I have a 4-hour Bitcoin chart open. Look, our market has formed a level here.
[11:07] After this, a false breakout of this level occurs, that is, a liquidity capture occurs , and the market then reverses. Let's go a little further. Look, the market has formed a level here. In the same way, the market
[11:19] catches liquidity a little and turns around. The market has formed a level here. In the same way, liquidity and reversal are catching. But this simply cannot be denied. Here the market has formed a level, turned around, the liquidity is hooked like a pin
[11:31] , and it is turning around. And perhaps the last place where liquidity is located is, of course, the sloping levels, the sloping lines. And they are also how it works. Here we have a trend line. Here she is. This is where it
[11:43] began. And now we had confirmation. A trend line is a section of the market through which a straight line can be drawn and which has had two or three touches. We have a breakout of this trend line and a return in the
[11:56] smaller time interval, for example, 2 hours. Here we also have a trend line. Note that the market breaks the trend line and the movement had a trend line before this. Notice here is the trend line. The
[12:10] trend line was broken. The movement continued. And then, of course, more seasoned , like this, like this, like this , like this, like this. And in general, is it clear? Please remember one rule: before the market
[12:22] reverses, it will definitely collect liquidity. As you remember, large players use volume as fuel, as well as liquidity. Liquidity and fuel daily lives, but also to ensure the positions of these very large
[12:35] players. Now let's introduce one quality filter into our trading. These are, of course, volumes. Now I'll talk about volumes, and in the next block I'll talk about the most important thing, about the signal with which you can
[12:48] trade this. So, let's assume we have some level. The market is moving towards this level. We understand that there will be liquidity below this level, meaning that market participants will suffer a fiasco and lose money. How
[13:00] actually happened? We will see this, firstly, by the removal and subsequent return. And most importantly, there will be an increase in volume. Volume is an indicator that shows quite well that there was indeed a lot of interest here. There
[13:14] really was a big player here. Remember the very beginning of this lesson. I started with the fact that a big player has a big position. He enters a position, volumes are formed, he exits a position, volume is formed. Let's
[13:26] go back to our example. Here we had a trend movement. The market breaks through this trend movement. Here we have volume appearing, a reversal is taking place. The market forms a level. Behind the level is liquidity. The market breaks through
[13:38] this level, volume is formed, and a return in the opposite direction occurs. Volume, like a litmus test, shows where the major player's interest really was . The market forms a level, a breakout from this level occurs,
[13:51] volume appears, and a reversal occurs. Bullish flag, upward movement, flag appears. At the bottom of the bull flag is liquidity. The market has gone down, volume is forming, and a subsequent reversal is forming. Absolutely every
[14:04] time after the capture of liquidity, volume is formed and a reversal occurs. The will happen. Now the important factor is, of course, the signal. Watch this video to the end, because later we will trade all of this with real money.
[14:17] Signal: If you want to enter a trade with a high quality, small stop loss and good profit margin, you need a signal. A signal is like a trigger that, well, you understand, that aha, now there will be movement, aha, liquidity
[14:30] turn around. There are actually a huge number of signals. I personally prefer to take my signal - this is a narrowing of the expansion. For example, the market is moving down. After this, our market seems to contract and an impulse occurs in the
[14:43] opposite direction. During the compression phase, you should see small candles, meaning the low. It is also possible that situations like these may arise. For example, let's look at the bull movement. The market moves up, a big tail appears and an
[14:56] impulse appears in the opposite direction. All these signals have two elements. The first is range compression. It is represented either by small candles or tails. The second element is the impulse in the opposite direction. The impulse may be very
[15:09] large, or it may not be very large. It is important that this impulse is greater than the compression phase. Here is an example, here is the entry point into the sale. Please note , we had a level. Here it is. He comes with history. This is the biggest high of the
[15:22] previous day. The market breaks through it. The breakout occurs on volumes. This is followed by a series of narrowing candles. Here we have a series of candles that are contracting, and then an impulse occurs in the opposite direction. The entry point for
[15:34] sales is here. The stop is placed behind the impulse candle, that is, here. Take profit is located here. Here is the end result of this deal. Here is the entry point, let me remind you of it. Here is the take profit exit. This is the financial result we took. And
[15:47] liquidity capture appears here again. But here I was no longer trading. But looking ahead, Something like this. Many of you ?” Yes, of course there is. And here is one example. Here is the entry point for
[16:01] buying, there was a downward movement, volume appears, an impulse in the opposite direction appears. Here is the entry point for buying. The stop is here, the tag is here. And here is the a purchase, here we stopped. Receiving stops is a completely normal, everyday
[16:16] end up in the red. This is fine. The main thing is that you stay in the black in the long run . This strategy works over the long term, that is, over the long term. Showing one more deal. Here we have a classic
[16:30] double bottom figure. Please remember where the stops are in a double bottom. Here everyone is expecting us to go up now. The market is going up, stopping people who are at this level. Here, a liquidity grab is taking place, a
[16:42] an impulse occurs in the opposite direction. To be honest , I came a little early. You would probably come in somewhere around here. I have a stop loss here. Take profit result. The entry point for selling is here, the exit is here. Financial result.
[16:56] Use this trading strategy if you want to make money. If I was channel and check out my free training. Start trading without deception. pay for anything. I repeat, this is not an infestation warm-up. There you can find
[17:11] full-fledged lectures without jokes, motivational quotes and other nonsense. Of course, we also have paid courses, so if you want more that you like it here, that you want to earn even more money, then
[17:25] take our training. Our prices are very reasonable. Scan the QR code too and I'll take a look. Earn happily.



⚡ Saved you 0h 17m reading this? Transcribe any YouTube video for free — no signup needed.