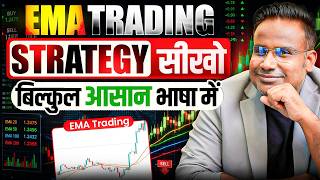

Easiest Trading Strategy for Beginners
45sPromises a simple strategy even a child can use, appealing to beginners and those intimidated by trading.
▶ Play Clip"Title promises an easy strategy and delivers a detailed, beginner-friendly explanation of the 5+13 EMA crossover."
This video explains the 5+13 EMA crossover strategy for trading in any market, including crypto and stocks. The presenter breaks down the concept of Exponential Moving Averages (EMA) in simple terms, demonstrating how to identify entry and exit points using the crossover of a 5-period EMA and a 13-period EMA. The strategy is designed for intraday and scalping traders, with emphasis on range analysis and risk management.
The strategy is so simple that even a 10-12 year old can apply it if understood. It works in stock, crypto, and any market.
The strategy is called 5+13 EMA, using 5-period and 13-period Exponential Moving Averages.
EMA stands for Exponential Moving Average. Average is the mean of values; moving average updates over time; exponential gives more weight to recent prices.
Trading means buy cheap, sell expensive. Two types: long (bet on price increase) and short (bet on price decrease).
This strategy is for intraday (within a day) and scalping (15 min to 2 hours). 5 EMA is fast, 13 EMA is slower.
When 5 EMA crosses above 13 EMA, it's a buy (long) signal. When 5 EMA crosses below 13 EMA, it's a sell (short) signal.
The strategy is good for catching reversal trades – when the market changes direction.
Before trading, identify support (discount zone) and resistance (premium zone) using the previous day's high and low on the 1-day chart.
For scalping/intraday, use the 15-minute chart. Wait for price to be near support or resistance before taking a crossover signal.
Wait for the candle to close completely after the crossover. Enter at the start of the next candle.
Stop loss at the nearest swing low (for long) or swing high (for short). Target at the nearest swing high/low, aiming for at least 1:1 risk-reward.
If risk-reward is less than 1:1, skip the trade. If the nearest swing is too far, avoid or use small quantity.
Price near support, 5 EMA crossover above 13 EMA, candle closes, bullish reversal candle (optional), risk-reward >1:1, SL at swing low, target at swing high. Max 2 trades per day.
Price near resistance, 5 EMA crossover below 13 EMA, candle closes, SL at swing high, target at swing low.
Avoid trading during major news events (RBI, Fed, budget) as price action may not follow the strategy.
The 5+13 EMA crossover strategy is a simple yet effective method for intraday and scalping traders, but it requires proper range analysis and risk management. Practice with small amounts or paper trading before using real money.
What does EMA stand for?
Exponential Moving Average.
02:33
What is the difference between a moving average and an exponential moving average?
A moving average gives equal weight to all data points, while an exponential moving average gives more weight to recent prices.
06:52
What does a 5 EMA crossover above the 13 EMA indicate?
A buy (long) signal, suggesting the price may go up.
14:37
What does a 5 EMA crossover below the 13 EMA indicate?
A sell (short) signal, suggesting the price may go down.
17:12
What is the recommended time frame for this strategy?
15-minute chart for scalping and intraday trading.
30:44
How do you determine support and resistance for the day?
Use the previous day's high as resistance and low as support on the 1-day chart.
32:11
When should you enter a trade after a crossover?
Wait for the current candle to close completely, then enter at the open of the next candle.
39:41
Where should you place a stop loss for a long trade?
At the nearest swing low.
42:35
What is the minimum risk-reward ratio recommended for taking a trade?
At least 1:1.
46:44
How many trades per day does the presenter recommend?
Maximum two trades per day.
49:16
What should you do if the nearest swing is too far from the entry point?
Avoid the trade or use a small quantity.
47:40
Why should you avoid trading during major news events?
Because price action may not follow the strategy; news can cause unpredictable movements.
51:21
Simplicity of Strategy
Emphasizes that even a child can apply the strategy if understood, making it accessible to beginners.
00:04Crossover Signal Definition
Clearly defines the core trading signal: 5 EMA crossing 13 EMA indicates entry points.
14:37Importance of Range Analysis
Stresses that identifying support and resistance zones is crucial before taking any trade.
19:17Candle Close Confirmation
Highlights the rule to wait for candle close after crossover to avoid false signals.
39:41Swing to Swing Stop Loss
Introduces a practical method for setting stop loss and target based on swing points.
42:35[00:04] The easiest strategy to trade is a strategy which even a 10th, 12th year old child can apply if he understands it because once things are understood then only they become brother, I am going to explain the strategy to you in such a simple manner.
[00:19] You might have heard it many times but you might not have understood it, so today I will explain it just like a child. The easiest strategy and whether you apply this strategy in the stock market, crypto market, or any other market, you will see this strategy
[00:33] working everywhere. So today I am going to explain the strategy in detail. Brother, explain the strategy in detail. Brother, Being the easiest does not mean that one is useless, forced labour or does not work. It
[00:49] If you do not have much time to sit, if you work or do business, then you can spare half an hour every day. And if you trade in the crypto market, then brother, there is no tension about timing. You can
[01:03] trade at night, trade at midnight, trade in the morning , trade in the afternoon, trade anytime. Because you know the crypto market is open 24 hours. Yes, those who trade in the stock market have time only from 5:15 to 3:30. But this strategy
[01:16] you can try the strategy in any market. The name of the strategy is 5 + 13 EMA. What is 5 + 13 5 + 13? What is EMA? Let me explain. I will
[01:31] explain everything. Even if you do n't know trading today, you will still understand this strategy. Even if you have never traded before, you will understand this strategy. Even if you are thinking of trading for the first time, you will understand this strategy.
[01:46] Understand it slowly. Ok? First let me explain the meaning of these three words. Then we will come to this also and what do we do in trading ? What is our mindset ? I will explain that too and will also demonstrate everything on practical charts. It wo
[02:01] n't be just theory. We will do both theory plus practical in today's session. First I will explain the theory to you in a while. I will explain the concept, what happens? How does it work? After that I will take you to the live chart. Look at the chart,
[02:15] brother, I am talking about the concept. The theory I talked about actually works. I am going to show it live on the chart. Is it okay brother? So today sit with full focus and calm heart. If you sit with pen and paper, you will enjoy it more and I am teaching you
[02:33] brother, so you will enjoy learning and you know that our USP is that we explain in the local language like children. First let us understand the meaning of these three words. Look at the full form of EMA, it is Exponential Moving Average. What to do with the full form? I did
[02:47] not understand anything. So let me explain. Let us first understand this word. Average. You think it is average. Suppose many children study in a class. If I ask you what is the average height of the children studying in that class?
[03:04] How will you calculate it? Suppose there are five children in that class. There are not five children five children in the class. The height of a child is 5 feet. The height of a child is 4 feet. The is 5 feet. The height of a child is 4 feet. The height of a child is 3 feet. So if
[03:19] you want to find the average height of three children. What would you do? If you want to find the average height of three children. What would you do? You will add the heights of all three. 5 feet + 4 feet + 3 feet You will add the heights of all three. 5 feet + 4 feet + 3 feet divided by 3. If there were five children,
[03:34] I would add the heights of all five children divided by 5. If there were 10 children, I would add the heights of all 10 children divided by 10. If there were 50 children, I would
[03:47] add the heights of all 50 children divided by 50. This is how the average is calculated. Ok? Like generally we say that brother, what is the price of tomatoes these days? So
[04:00] brother, you will see the price of tomatoes, 10, now I don't know the exact price because I don't buy tomatoes, suppose the price is ₹50 per kg. Suppose sometimes it is ₹50, sometimes ₹55, sometimes ₹60, sometimes ₹65. So they can say that brother, sometimes it is 50, sometimes 55, sometimes 60.
[04:14] So the average price remains between 50, 55, 60. So this is what average means. Now what does this mean in trading? We will understand where this average will be used in future. Do you understand the meaning of average? I was able to explain the meaning of average. Ok? Now what does moving average mean
[04:29] ? Understand this. An average that is moving. What does it mean that it is moving? Are you running ? No, it is not working. It's going on. Is [nasal sound] Suppose the
[04:43] Suppose the average price of tomatoes from the 5th to the 10th was ₹50. I am saying average.
[04:58] After that, from 10th to 15th, the average price of tomato average price of tomato was ₹58. Accept it. Now was ₹58. Accept it. Now suppose the average price of tomato from 15th to 20th was ₹56.
[05:12] Suppose Sir, what was the average for 5 to 10 days? ₹50 I am talking about the date from 10th to 15th. There are dates in a month, from 10th to 15th dates in a month, from 10th to 15th ₹58, from 15th to 20th ₹56, so sir, this
[05:27] average after that, this average after that is moving, now if I take the average from 20th to 25th then it will be a separate average, from 25th to 30th there will be a separate average, so if I have to go to buy tomatoes and if I
[05:44] am standing around 10th then I will see this average, not the average from 1st to 5th, average from 1st to 5th, you can take an average from 1st to 5th also. If the date is currently running from 10 to 15, which average will you look at?
[05:58] You will see this average. You will see this average. Which one will you watch? You will look at the nearest thing, right? If you are running around this date, date of the month. Which is the closest average you will see? You will see this one. Because there is a possibility of it happening, brother. Now imagine whether it is going to rain today
[06:13] or not? How will we know? How was the weather yesterday? We will decide on that basis today. Hey brother, it rained heavily yesterday, so the sky looks a bit the same today too. Might be possible. Hey, how was it raining 10 days ago? What was the sky like 10
[06:26] days ago, its impact today may or may not be there or may be very less. So this is called average moving. First we are looking at this average and then this average. Then they are looking at the average. So we call this moving average. If you have some doubts or do
[06:40] not understand something then don't worry, you will understand it well later. For now I tried to explain the rules of trading. Apart from tiering trading, I Apart from tiering trading, I
[06:52] after that EMA Exponential Moving Average, let us understand the average, let us Moving Average, let us understand the average, let us understand the moving average, what is the meaning of exponential, understand the moving average, what is the meaning of exponential, a moving average which is increasing very fast
[07:06] or decreasing very fast. Meaning, when we talk in the language of trading, we look at the price of trading. Price increased or decreased. We only see that the price of something is increasing very fast and decreasing very fast.
[07:22] If there is something to measure this, then we will call it exponential moving average. So did you understand? This is what exponential moving average means. Could I explain? What does EMA mean? Now after this if we move ahead. What is trading? Sir, please
[07:39] I came back. If it is possible that you do not know anything about trading, let me tell you a little about it. Then we come to the real issue that how does EMA work ? What factors should be looked at ? After that we will do the practical further. Correct? [Sound of clearing throat] Sir,
[07:54] trading means buy cheap, sell expensive. Meaning, these days, the era of gold is going on. The era of gold means gold is very popular. It is increasing, it is decreasing. A gold is very popular. It is increasing, it is decreasing. A lot of people are buying it.
[08:09] lot of people are buying it. Gold is currently trading around Rs 1,50,000. So if Hey, it is available cheap. It is available cheap. It is available cheap. Buyers will be put on hold. After that ₹1,50,000 will come back. Sellers will be put on hold again.
[08:23] Hey brother, we bought it cheap. You sell, sell, sell. Because you bought one for Rs 30 and sold the other for Rs 50, so you earned the profit in between. This is what trading is. You can say the same thing with clothes, potatoes, onions, tomatoes, gold,
[08:35] crypto, Indian market , stock market, buy cheap and sell expensive anywhere. Well, it means if I am talking about stock then the if I am talking about stock then the price of some stock today is ₹10. Tomorrow it will be worth ₹15.
[08:49] So bought for 10, sold for 15. This is called profit. No no sir. Sir, if you bought it for ₹10 today and sold it for ₹15, then there is a profit, but if you bought it for ₹10 today and sold it for ₹8, then
[09:02] also there is a profit. You will say how can this happen ? Then there will be a loss. How to make profit by buying for 10 and selling for 8? This is what I am going to explain. If profit. Buy something for Rs 10, sell it for Rs 7, Rs 6, Rs 5, still there
[09:16] is profit. Let's talk about this in the language of crypto. If you are buying Bitcoin, Ethereum, any coin , buying it for ₹100 and selling it for ₹110, then there will be profit. But if you buy for ₹100 and sell for ₹5, can you still make a profit
[09:31] ? It will happen even then, it will happen even then. That is what we will learn now. Sir, look, buying means two things. Firstly, we buy long. Firstly, we buy shorts. What is long? Sir, long is when we say that our mindset or our
[09:47] strategy says that the price of Bitcoin or the or my analysis says so, then I buy long because I feel it is going to increase.
[10:01] Meaning, when the price increases, I will make profit. But if my analysis says no, the price of Bitcoin or Ethereum or the price of XWAZY stock is going to or Ethereum or the price of XWAZY stock is going to fall, then I
[10:13] buy short. Meaning I bought something for ₹10 and if the price of the thing worth ₹10 actually becomes ₹8 then I have a profit of ₹2. I had already told you brother that it is about to fall. That's why I bought the short. So bye means two things. Are you buying long or
[10:29] buying short? This means that you are betting on the price going up or on the price falling. Yes, you did it. If 10 becomes 15 then there will be profit but if 10 becomes 8 then there will be loss because you had gone long. But if
[10:43] you short, then if 8 out of 10 is profit, but if 12 out of 10 is loss, then loss can happen in both the cases. Even if the price increases, there is a loss.
[10:55] Even if it falls, there is a loss. Depends on what you bought ? If you have bought long then you will get profit when the price increases. If you have bought short then you will make profit when the price falls. Correct? After that the cell. There are two things we buy. Buy or short. Do you go long or short?
[11:09] Here, I roughly understand the meaning of sale as that whatever we have bought, I am now selling it. I am selling means if you bought it then sell it. If you buy this then sell it. I am I am closing my ongoing position trading. It's done brother, loss or profit,
[11:25] whatever has happened, now we are leaving. Ok? So we understood the meaning of buy button and sell button. Now come and go deeper into the issue brother. I have prepared the complete document for you. I created this document for you. You will get it. Where can I get the
[11:40] document? I will tell you this. You know that we do not have any paid services. We don't sell anything. Our course course is nothing. Whatever we give, we give it for free brother. So when everything is given for free, then this will also be
[11:53] given for free. Where will you get it? I will tell you this in the last. You will get it absolutely free. Please remind me if I missed it. Correct? Our strategy is 5 EMA and 13 EMA. Trading Intraday Strategy. Who is this
[12:05] strategy for? Those who want to buy and sell within a day and book their profit or loss, whatever it may be, and exit. Meaning, if you buy it today and sell it after a month, the wait for profit is not that long. Tell me today, I have 10 minutes of time. There
[12:20] is half an hour's time. There is 1 hour time. I want to trade and exit within 1 hour. The strategy is very good for those who book profits or losses whatever they may be. You have 1 hour, 2 hours, 3 hours in a day, you have a working strategy for those. Intraday means one day and
[12:36] scalpers scalpers means 15 minutes, 20 minutes, half an hour, 1 hour, 2 hours. What is EMA? I explained it to you. Ok ? What is 5 EMA, 13 EMM?
[12:48] ? What is 5 EMA, 13 EMM? 5 EMA Sir, when I say 5 MA, then let me explain it, you will understand it better. [nasal sound]
[13:04] 5 EMA. So sir, what happens here is that the price is shown in the form of candles. price is shown in the form of candles. Now that candle could also be a candle in 1 hour. There can be only one candle in a day. There can also be a candle of 1 month.
[13:19] It depends on which candle I am choosing while trading. which candle I am choosing while trading. Now, I am saying that this candle is 5 EMA, which Now, I am saying that this candle is 5 EMA, which means a collection of five candles.
[13:37] I said that 13 EMA means a collection of 13 candles. In this way, the moving average price is moving and 5 EMA means five candles. That candle can be
[13:51] of one day, it can be of 1 hour , it can be of 1 month also. It works everywhere. Ok? Basically when I am talking about 5 EMO 13 EM EMA then I am talking about 5 EMO 13 EM EMA then 5 EMA means very short term candle.
[14:05] So this will work more in scalping and intraday. If we have to swing. Swing means if I took a trade today for the next day or week or month, then our EMA will be bigger there. 20 EMA 20 One 21 EMA 50 EMA 200 EMA
[14:22] I will come to that in detail also. Right now today we are talking about intraday and scalpers. Did you understand it correctly? Now come back to your document. So five EMA means small and fast, it reacts immediately with the price. The 13 EMA
[14:37] means it is larger and slower and will move slightly behind the price. Because we are talking about 13 EMA. move slightly behind the price. Because we are talking about 13 EMA. cross together, a trading signal is formed. Yes, our strategy is that suppose
[14:51] is formed. Yes, our strategy is that suppose What is our good indicator? The indicator is that brother, there are many indicators. Every indicator works to tell you
[15:06] works to tell you when to enter and exit the trade. Different when to enter and exit the trade. Different Correct? So I will use two indicators. Both indicators will be EMAs. I'll just
[15:19] take both, a five EMA, a 13 EMA. I will show that. Accept the price, hey what is this? Well, here it comes. Suppose 5 EMA 13 EMA 13 EMA
[15:31] Suppose 5 EMA 13 EMA 13 EMA is moving like this, like this, like this. This price is moving according to the 13 EMA. When the 5 EMA crosses it and comes out like this. EMA. When the 5 EMA crosses it and comes out like this.
[15:45] This crossing point, if it is cutting from below, what is this? This is 13 EMA and what is it? This is 5 EMA. What is my strategy? I will explain 13 EMA and demonstrate it all. If it becomes more clear in the chart, just stay tuned.
[16:01] demonstrate it all. If it becomes more clear in the chart, just stay tuned. If the 5 EMA, i.e. the smaller EMA, crosses the larger EMA from below, then a long buy can be done here.
[16:15] This could be a signal to go long. Long means when? When I feel the price will go up. But if this has happened then it creates a strong signal for the price to go up. Let me tell you the meaning of good signal. There is no such strategy in the world. There is no
[16:30] trader in the world who can earn 100% trading profit. who can earn 100% trading profit. This cannot be. If the ratio of profitability is 70% 60% 80% then it is very good. Whatever we are learning today,
[16:44] earn profit. This can never happen in the world. Ok? The more you practice it, the more your hands on it improve.
[16:56] If this is happening in such a way that the smaller EMI is price may go up. So we long there. Well, I am calling this small EMI as roaming EMI. While talking about EMI, if EMA cuts from the top
[17:12] here, if it cuts from the top here. What could this mean now, brother? Now the price may come down. So what would I buy here? I would buy short here. what would I buy here? I would buy short here.
[17:26] go down and if the price really goes down then your earned money can become lost money. Ok? So today we are going to talk about this strategy. I will also show it live Can I explain it to you? Please tell us by writing in the comment box.
[17:40] And if it is so, no one has explained this till date. I have seen the EMA video many times but no one has told me about such an EMA till date, so please write this down and tell me so that I too get some motivation and bring more strategies to you.
[17:54] Look, there will be many teachers in the world. No one is bad. But I that no one explains like you. So I also say this, no one explains like me, brother. Ok?
[18:06] So what is our strategy? Understand? If the smaller EMA is crossing the larger one from below then the price may go up. If the shorter EMA is crossing from above then the price may come down. This is our strategy. Who is this strategy for? Mainly for scalping and
[18:20] intraday traders. We have talked. When applying a short range EMA such as five or 13, a fast entry can be obtained. The biggest reason is catching reversal trades. Reversal trade means price,
[18:35] these are the 13 rules. If this is done then the price will increase. Correct? A reversal happened, meaning the price was going downwards but it turned upwards, meaning something is
[18:48] going upwards and then it reverses, it is going down, it goes up, it reverses, so I will make you do a understanding it but it will become more and more clear, what is a reversal trade,
[19:03] clear, what is a reversal trade, when the market is about to turn, it turns brother, that is, if it is going down then it should go up, I said the opposite, meaning if it is going up then it should go down. If you are going down then go up. Correct? We have to grasp that point.
[19:17] From which place is she going to turn back, brother? I will take entry there. Do range analysis before trading. I will tell you after range analysis. Don't worry. I am demonstrating it on the board right now. This does not mean that hey tell me the reality
[19:31] brother. Tell me on the chart. I will tell you that too. Range analysis means suppose the price goes up, comes down, goes up , comes down, goes up, comes down , comes up, comes down. The price is like this. So range analysis means that
[19:46] So range analysis means that tell me a zone, tell me an area. The price cannot go above this. Ja Sakti means possibility. I predict that nothing will happen for sure. Please
[20:02] tell me the lower range. This will not bring the price down. So, the price can So, the price can go up to this level. Till here till here, go up to this level. Till here till here, like I say sometimes if you
[20:18] hit the ball on the roof, what will happen when it bounces back? Will come down. Hit it on the ground and it will rebound and go up. Price like that. Whenever the price hits the ground, that is, at this level, it hits the support level. level, it hits the support level.
[20:34] record also shows that the price goes up again and when it hits here after going up, that is, when it hits the roof, the price will come down. If I come to know
[20:46] price will come down. If I come to know that brother, this is a support zone. Meaning this is an area where when it hits, the price will go up. If I had known this point earlier. That would be so great. I will take a long bye here. If I can find out that
[21:00] this is the point here. From here the price will crash and come down. This is resistance. If I find and come down. This is resistance. If I find this out, I will buy short here. this out, I will buy short here. I will do a short buy. I
[21:12] I will do a short buy. I will go long bye. Correct? This is called zone. Find out the range, today's range brother is this much. So, suppose the price of Bitcoin is currently
[21:25] [sound of deep breathing] around ₹170. So tomorrow the price of Bitcoin can go from ₹1 lakh 75000 to ₹1.75
[21:37] price of Bitcoin can go from ₹1 lakh 75000 to ₹1.75 go down to 168. It can go up to 175. I figured this out the other day. So
[21:50] brother that at the most it will go this much. At least that much will go. This means that during the day when the price of Bitcoin is about to go to 1:75. This means this is the upper layer. What will happen after that? There is a possibility that the price may come down. So I can short here.
[22:06] brother, the price of Bitcoin was 168. brother. I found out that I can long here. Ok? From here the price can go up and from here the price can go down. Finding the support and resistance zone,
[22:21] finding the range, brother, what is the upper range ? What is the lower range? Technically this is called support. Technically this is called resistance. This resistance zone is called resistance. This resistance zone is also called the premium zone. Correct? Am
[22:36] also called the premium zone. Correct? Am I able to explain it well? Ok? Yes. So brother, before trading, it is important for you to do range analysis. I will tell you how to do it. I tell you how to do it. I will tell you how we will do it. For this you have to
[22:48] look at the chart of the last one day. I will tell you after seeing it. Let me leave this one. I will show it to you live now, then you will understand it better. EMI crossover or should we do it ? Let me just do it. It will be much better.
[23:03] Sir, for that I opened Trading View. If you use Coin DCX, then you get all the facilities of Coin DCX on Coin DCX also. You can get it on the Indian stock market as well, whichever broker you are using.
[23:19] because brother, it is the largest exchange in India. It is the most reliable exchange in India. It is the only unicorn company. The easiest one is to take the trade. The platform here is very good. It is easy to use. And the best thing is that on the
[23:32] link we have given in the description, or do KYC. You will incur a loss of 20% every time. That's why download Coin DC from the
[23:44] Well, we are talking about trading, Provides trading practice. There are different strategies, I am telling you one. They tell different things. The day continues for free. For that we have
[23:59] given the link of a Telegram group and Telegram channel. By joining that channel you can take learning for free. Our team keeps helping you there. She makes you hold hands. We have given the link of both in the description. That's why I'm
[24:12] using TradingView. Some people may be from the stock market. I switched to TradingView. If I had to convince only crypto people, I would open the coin DCX. I would have shown you the same chart in that also. So here, let's say I take A
[24:28] Bitcoin. So for Bitcoin, you write BTC here and come to the crypto tab. There are a go here and there. Select this crypto tab and I clicked on it.
[24:40] Make the launch chart. This Bitcoin chart is in front of you. Now let us arrange this Bitcoin chart a little bit. Some indicators are already installed here. I will remove this. By saying arrange, I mean I will enlarge it a little so that
[24:55] you can see it clearly. Let's make the candle a little thicker. Looks like he has become too fat. A little thin, a little thin. Yes, it's fine now. Now get the indicator, such a logo is visible in front of you. If you use it on your phone, it will
[25:11] look the same. The coin DCX also basically uses the same indicators internally as TradingView. So everything will appear to you the same way. It will look a little different on mobile. It will look a little different on a laptop. This is basically the view of a laptop. You come here. Here you
[25:26] You come here. Here you write EMA in the search. Ok? Moving Average Exponential has arrived. Look here, something will happen here. Once I clicked. Look, an indicator has been installed here. I will do it twice. I
[25:41] want 5 EMA and 13 EMA. Click once more. Look, another one has come. The more times you keep However, more than two are not allowed. This is also a tree. But You will not need to go towards the tree if you are a beginner. Now let me customize these two indicators that have been installed
[25:58] so that it becomes easier for us to see them. If you double click on this, it will come first in the input. I want two EMAs. I I want two EMAs. I need the five EMA first. So the five EMA length I
[26:13] need the five EMA first. So the five EMA length I took five. Meaning five candles. Ok? A collection of five candles. That's why I took five. The style is blue. I do one thing with this blue. I will make it a little thicker. Selecting this here made it a little bit thicker.
[26:26] Selecting this here made it a little bit thicker. Ok? Now the second one which is nine EMA is sectioned here. What will I do with this nine ? 13 is our five EMA and 13 is EMA,
[26:38] brother, I will come in style and change its color. I take its color orange saffron color. And let me make it a little thicker. That's 13 EMA. The larger is the EMA. So 13 EMA. The larger is the EMA. So I made it even thicker. Correct?
[26:53] Now see, both EMAs have been applied brother. This thick one is 13 EMA, this blue one is brother. This thick one is 13 EMA, this blue one is 5 EMA. What our strategy says is that the point where the shorter EMA crosses the longer EMA could be the entry point.
[27:10] crosses the longer EMA could be the entry point. price may go up. When the shorter EMA crosses from above, the price may move down.
[27:22] Come short over there is that happening? Can we see this happening in the Bitcoin chart we opened ? Let's just look at this. Both EMAs have been applied. Sir, look here, the small EMA is the thin EMA, the five EMA is the blue one. The
[27:39] blue one has been cut from the bottom here because when you are looking at the live chart, you will not be able to see this area here. Hey, move aside brother. This area will not be visible. You will see that there is a cross cut here, which means this could be my entry point.
[27:55] As soon as the cross happened, brother, a long position could be formed here and after that see, it happened and the formed here and after that see, it happened and the price went upwards. Meaning both of these are rivers. Both these rivers are flowing. It is going on. It is going on. It is going on. It's
[28:09] going on, it's going on. The place where it collided is the entry point. The collision is the first thing we have to notice. Well, whether it hit from below or from above, we will have to see that next time. And I will talk about whatever else there is. If it hits the bottom, then see the price has gone
[28:23] up brother. Green Green has gone up, right, the price has gone up. Well, look here, the smaller EMA 5 has cut the blue EMA from below, but what happened after that ? After that the price has also come down. This means I am showing you one thing
[28:37] brother, no one who teaches you trading will show you that strategy does Then why are you telling me? Sir, I am telling you this because the strategy is very good. It can work in maximum time if practiced properly. And trading is a
[28:50] game of possibility, brother. It is not that there will always be profit. And I will show you. Look, this small EMI has been deducted from above. Where has Price gone after that? Has gone down. Yes, I have been gone for a while. But Gaya is down. And look
[29:04] here, it is cut from the top here also. The price of one candle has gone down for a short period of time. But after that he has moved. Why did this happen? Why did you move so quickly, Why did this happen? Why did you move so quickly, sir? That is because there is a rule that
[29:17] I told you a while ago that first of all we have to identify the range. I will also tell you how to identify the range. The range has to be identified. range has to be identified. If we get the price here on the roof then it is the best
[29:33] If we get the price here on the roof then it is the best case. If we get the price here then it is the case. If we get the price here then it is the best case scenario. Price agar yahan pe hai sir this is not a good case. There is less probability of earning money here. So,
[29:47] we have to see whether the price comes here or the price comes here. Meaning it should either be at the premium zone or at the support zone. Whether it is at the resistance zone or the support resistance zone, this is what is called the premium zone. This is called support zone. Ok?
[30:02] Now come on why did you forget the media player? Ok ? And look, let's see some good cases. ? And look, let's see some good cases. price has crossed the small blue line from above. From above means the price can
[30:18] go down. Is he gone? It has become very strong brother. Very strong. It has become very strong. Very strong. So strong that it is dangerous. Ok? Let me
[30:31] explain this more clearly. I take this on the 15 minute chart. Because what is our strategy? Do scalping , do intraday. So for those who are intraday traders, who are scalpers, the 15 minute chart is perfect for them. But
[30:44] before coming to the 15 minute chart, we must find out the range. I will tell you how to find out the range now. Stop. Don't go anywhere. Because range is very important. If you do n't know the range then you will trade at a strange place and then things will go wrong.
[30:59] Look at the 15 minute chart brother. Cut from the bottom. It has gone up very strongly. The small one, I cut it, the blue one, its price has gone up so much. And look
[31:12] here, the market is going on in the middle. It is neither at support nor at resistance. If someone had entered here, there would have been trouble. I have cut it up and down here two-three times. Come and see brother,
[31:26] look here, if it has been cut, how solidly the price has gone down while coming down from the top. How long. Correct? So we can see what this means. Brother, see for yourself how long it has gone if it has been cut here. If it is cut from the bottom here, then
[31:40] how long has it gone up? That means maximum time you yourself see the chart moving here and there. You get it seven out of 10 times, or maybe eight. This strategy appears to be working. You just need to see how easy it is to do this on the chart. Now let's move ahead.
[31:56] We also have to learn how to find out the range van. So let us come to that. Correct? First, range analysis. Sir, for range analysis you have to do one thing for range analysis you have to do one thing that you have to look at the candle of 1 day ago.
[32:11] able to explain, brother? Are you understanding this ? one thing sir, we'll do, we're on the 15-minute chart right now. Range Analysis Our first task
[32:25] Range Analysis Our first task is Sir Range Analysis. First Task The is Sir Range Analysis. First Task The first task is to find our range. Find out the range. After that we will
[32:40] Find out the range. After that we will get down to the charts. Finding the range means to find the range we will go to the 1 day chart. Now look at the one day one, as soon as we click on D, it may be that One Day will appear in front of you. So now you see that the
[32:55] candles you see are one candle for each day. When I selected 15 minutes there was one 15 minute candle. Now there is a candle of the day. So you see, this is today's candle, brother, and this green one is the candle of the previous day. So what I will do is I will
[33:11] candle of the previous day. So what I will do is I will below the bottom of this candle of the previous day. This will be my support zone and resistance zone to trade the next day. Let me
[33:26] show you the price. You will come here. You will come on this arrow. You will take the horizontal line. There is a
[33:45] not appear wherever you click. I change its color. What color should I give it? I will give it to him. Yellow type color. Ok? I will give you green. Let's give it green.
[33:57] green. Let's give it green. No, not green, I will give you red. convenience. Correct? Once again I will
[34:09] go here and again I will take the horizontal line and when you click here again what will happen in the laptop ? It comes to the same place. Up comes down here. ? It comes to the same place. Up comes down here.
[34:28] [deep breathing sound][suddenly loud breathing sound] Okay? Green means that the price can now go up from here and the price can come down from here. So I took the red and green. You can take anything. This is a 1 day
[34:41] chart, I have marked the high and low of this candle. Now where do I come back to ? On the 15 minute chart. Let's enlarge it a bit on the 15 minute chart. enlarge it a bit on the 15 minute chart.
[35:04] and look at this, I will make it a little bigger so this will go up and this will go down. But I do a little bit. I do only a little. I did it. Now look, I will do it as per the current prices, it will be more clear. The
[35:21] prices that are running right now, this candle that is running on 15 minutes, when I am looking at it, it is neither in the support zone, nor is it in the resistance zone. So sir, what is the first thing to do? Drawing resistance zones and support zones. And I want to see
[35:36] where the prices are right now? In the resistance zone or in the support zone? It's in the middle right now. It is or in the support zone? It's in the middle right now. It is not anywhere. And in such a place, when you find a crossover and trade, there is a greater possibility of loss. Correct? So we should
[35:49] not trade at such a place. Have to wait. We have to wait for the price to go here or here. You see, some people might have taken the trade here. bottom, some people might have made a short here. But after shorting,
[36:04] they may have made profits till here. But you will get very little profit brother. Very small profit. Where will you place the stop loss then? So the market is always moving almost sideways. So avoid such situations. Avoid such situations. Still
[36:20] situations. Avoid such situations. Still see the price is moving like this. Price touched here once. But after touching it, it came down immediately. But was there any crossover at this point ? No. If there is no crossover, I do
[36:33] n't want to watch it. I want to see the crossover first, brother. I have defined the range and if the price has gone up or down, is there a crossover there? Gotta see the crossover. The smaller EMA should cross the larger EMA. Either from below or from above.
[36:48] should cross the larger EMA. Either from below or from above. Correct? And come on. Good ahead. Look, all this is in the middle. Price has bitten here. There is a cut in the price here. Look, it is near the support zone. Being near the support zone means it should exactly touch this line. It's not like that.
[37:00] We also drew support and resistance after looking at the previous day's candle. That was a great idea. If it is in this zone then it is a good case. After being in this zone, look here the price has cut. Cut from the bottom.
[37:16] Cutting from the bottom. Sorry, the small EMI has cut me from below once. Has the price gone EMI has cut me from below once. Has the price gone up after that? Has gone. Has gone. And here you can ask brother where should the stop loss be? And what should the target be
[37:28] ? We will talk about this further. Stop. Has it gone ? Has it gone? Meaning the strategy worked here, right? And let's go back. Almost coming the previous day. So brother, I had gone there the previous day and
[37:43] that range of mine was wrong. Because the range we have created now is based on the previous day's candle. So that range will work for me for today. When I work on trading in the coming days, I will make today's range.
[37:58] Ok? So you see, if someone has followed this strategy, taken the range according to yesterday's candle and is trading today, then he has made a trade, a solid trade, he has made money here, he made money today, he
[38:15] made a very solid amount of money, he got a good target, brother, okay, so keep practicing in this way brother, and after practicing, tell us the result in the comment box of this video, okay now let's move ahead, let's move ahead. Where do you come next? Yes. Now
[38:31] where should we place the stop loss? Let's talk about this also. Hey come brother, see how much effort I put in to explain. Will see how much effort I put in to explain. Will
[38:46] explain. Ok? A. Remember, if the market is in the middle , moving sideways, then ignore the setup. This is what I just told you. If you
[38:58] enter there, a stop loss may be applied. Chances of hitting stop loss are high. You will get this. I will tell you where to find the tension knot. How do I get an EMA crossover signal right now? Sir buy signal. Bye means I am talking about long. If the 5 EMA
[39:13] 5 EMA crosses the 13 EMA from below upwards, it is a crossover. Meaning the market is becoming bullish. The buy signal came. The same has been demonstrated here. Cell signal. I am talking about short meaning of sale. The 5 EMA crosses the 13 EMA from above downwards.
[39:28] This is the cross down. Meaning the market is becoming bearish. The cell signal market is becoming bearish. The cell signal came. Meaning a short signal has come. I showed the same thing happening here also. Here I have taken different colors.
[39:41] Important note important rule. Take entry when the candle closes completely. Yes, when the candle closes completely. Yes, I forgot to tell you this. Come back brother. Where did sir go?
[39:58] You see the exact entry point, there is a cross at this place. So after the cross at this point I will wait for the next candle to form. That means if I am looking here and the cross has happened here then the next candle can be this green candle.
[40:12] I will wait for it to be completed. Or I am seeing that if there is a crossover on this green candle then I will wait for it to complete. Let it be made once. Look, as this gap increases, as the gap between these two indicators, the orange one
[40:27] and the blue one, increases, then understand that your profit rate ratio will keep increasing. So this gap has just started increasing after this candle, so wait till this candle to get some confirmation. After that I will take entry at the beginning of this candle.
[40:40] What should be the stop loss ? What should the target be? I will tell you that also. Ok? What will be the entry point ? At the point where the crossover happened, at the point where both the lines collided, at the line where Ganga and Jamuna met,
[40:56] wait for one candle after that point. How many minutes? Sir, we are working on 15 minute candles. So minutes? Sir, we are working on 15 minute candles. So I am talking about this 15 minute candle. Let a candle be formed on this 15 minute candle.
[41:11] What will be the stop loss? What will be the target? I'll be back right away. After the AC is on, I will explain it with all my heart. After putting in so much effort, I am planning to soon bring a complete session of trading, a complete
[41:26] series and in that series there will be around 50-55 lectures, which means 50-55 videos will be made, all free, no money brother, we do not take any money for anything, there is an ad running on Facebook in our name, many people are running it by putting our AI video and saying
[41:41] money, it is all a fraud, do not give it anywhere, I give everything for free, everything for free. I don't trade in knowledge, brother.
[41:53] I don't trade in knowledge, brother. I give knowledge for free. Correct? So if you want a trading series, please let me know by writing in the comment box. Just What do you want to write? Need a trading series? Just write and write. The maximum
[42:07] number of comments will show that people want to know and learn. As soon as possible I will bring this series for free on this YouTube channel. And I will explain it just like I am explaining it. I will explain each and every thing in detail while sweating.
[42:21] Correct? And there is a guarantee claim. Claim claim claim. I have that much confidence. And you say the same thing in your comments. Brother, no one in the world will explain like this. Tell me if you are right. Stop loss and target should be swing to swing.
[42:35] Swing to swing. What is this? Sir what is swing to swing? Sir swing is that the what is swing to swing? Sir swing is that the price never price never goes like this. If you have to go up. Price never
[42:48] goes like this. Whenever the price has to go up, it goes like this. Are. So when the price is going up. Where did the swings come from? Sir, look,
[43:02] this is a swing. This is a swing. I will change the colour. This is a swing. I will change the colour. A swing it is. A swing it is. A A swing it is. A swing it is. A swing it is. A swing it is.
[43:17] This is a swing. That means the direction in which the price has turned is called swing. Where will this appear on the chart called swing. Where will this appear on the chart ? From here you can see the price swing happening. This is a swing.
[43:32] What is the lowest point of this swing, sir? Look at the lowest point of this swing. So you are almost getting to know that the lowest point of this swing is this point, exactly this one, so if I am taking a trade here then the lowest point of the swing will be my stop loss,
[43:48] see the lowest point of the swing, that means if you see it on the board
[44:05] green brother, when the price is going upwards then this will be my stop loss. This will be the stop loss. If I am taking entry here, somewhere here, then this will be my stop loss. If I am taking entry somewhere here then this will be my stop loss.
[44:19] Correct? What will be the target, sir? We don't know the target. How far can the price go Stop loss explained. Understanding stop loss is very important. Correct?
[44:31] Now come brother, stop loss is at the nearest swing low. This is what I said, the nearest swing, hey, the nearest swing, take it, but this is the lowest
[44:45] point. I am watching this for 15 minutes on the candle. Remember, we have to do all the work on candle for 15 minutes only. To create a range we need a 1 day candle. After that, all my work will be done on 15 minute candles. Ok? So that will be my stop loss.
[44:59] What will be the target? At the nearest swing high. You will say that the nearest swing high has not been formed yet. Then how? So sir let the swing high be created for the target. If swing high be created for the target. If a swing is forming, you can see it.
[45:14] This will not be visible while it is being made. You will have to wait, sir. You see the target, ideally what happens in the best case? If a 1:1 ratio is being created in your trade then ratio is being created in your trade then it is very good. 1:1 means one loss
[45:29] it is very good. 1:1 means one loss equals one profit. If it is 1:2 then double is the profit and single is the loss. If this is being made then it is the best of the best case. So best of the best case. So if I am placing stop loss here and
[45:42] I have to leave for office. I have some work. I want to sleep. There's something to do at 2:00 in the night. What should I do? I will leave the stop loss here. leave the stop loss here. I will target its double. I mean,
[45:54] you should see this price. When you place your trade in the Coindx app, you have to select the price at which you are placing the stop loss. So look at the price of one candle here, is the price moving? Place a stop loss at that price. Look here, the
[46:07] price is visible on the side. Ok? Place a price stop loss on it and this means that if you are placing a target 10% below the target, then place a target 10% above it
[46:19] or if the target is 15% or 20% higher then it is even better. You can leave it after setting a target of D double. Correct? I am able to explain. Now come forward. Come here.
[46:32] What's the logic? Swing to swing. Do n't stop in the middle brother. Swing to swing. Do n't stop in the middle. It would be better to place stop loss on swing only.
[46:44] Look here also, I have shown the same thing by doing this. Okay, you will get this. Don't trade without tension not risk reward brother. Do one thing before taking every trade. Do check the R to R risk reward. A If the odds are less than 1:1, don't take the trade.
[46:59] Ignore it completely. If you feel that brother, many times you will face such cases that the
[47:12] A swing you have this long A swing you have this long and here's where the crossover is supposed to be. So sir, here when you are taking entry, then see the stop loss, I am saying swing, I am saying
[47:25] nearest swing. The stop loss looks so long, man. How long is the stop loss showing? This means that the profit should be large enough to cover this stop loss, cover this stop loss,
[47:40] not be that big, so what will I do? I will avoid it. I will not take this trade. If the swing near where the crossover occurred is very long. It is very far away. very long. It is very far away. Avoid it. Don't take the trade. If
[47:53] the price is going up and the swing is this much and the crossover happens here. Take it, the trade is small because we do not know how far the price will go up. Keep this in mind if the swing is long. Your entry point is where your crossover is occurring if the
[48:07] nearest swing is too long. Don't take trade avoid. Correct? This is the benefit of writing. Many times I forget while explaining, so this helps me. Brother, I have to tell you this point also. The person should not get confused. Look, here
[48:21] I have explained to you with the help of graph that the more the risk, the more the profit, the better it is. It's good. But the
[48:33] brother. It's very nice. Take. Correct? How will we decide? If the swing is long then do not we decide? If the swing is long then do not take it because the stop loss is big. We will have to take an equally big target to cover. Ok? You go away brother. If
[48:48] the swing is too far then the risk becomes higher, so keep the quantity low. Meaning invest some money. Don't ignore the trade. Get into small lots. Here I have written that do not ignore the trade. But I am telling you that brother, why take too much risk
[49:01] ? Ignore it. But if you are one of those people who says let's do some storm and water today. Some drink from Thums Up. Jump off the mountain. I jump. kind of nature then definitely enter. Then definitely take it. Ok? I have
[49:16] written the buying trade setup step by step here, whatever I explained, I have written everything step by step. The price should be around the discount zone support level, around the discount zone support level, meaning it should be at the lower ground level. There should be a 5:30
[49:28] EMA crossover and the candle should be completely closed. After the next candle crossover, a bullish reversal candle should also be visible. I did not mention bullish reversal not that important, ignore it for now, calculate this line R to R,
[49:45] meaning if the risk reward ratio is less than 1:1 then skip it, if it is more then it is very good. The SL should be at the swing low. Maximum two trades in a day at the target swing high, do not take more than that. For beginners, start with small quantities.
[49:59] 1 Work on risk reward. If you gain confidence, increase the quantity. Now the selling trade means the price for short should be around the premium zone resistance level. It is around the premium zone resistance level. It is
[50:16] Meaning the candle should close completely from top to bottom. cover it in the next session. At present, you do not need this to execute this trading strategy. present, you do not need this to execute this trading strategy.
[50:31] Where to place SL? At swing high. Because you are shorting. What are Because you are shorting. What are you doing? You are shortchanging me brother. Shorting you doing? You are shortchanging me brother. Shorting means
[50:51] then the stop loss will be here. If your crossover is happening here then the stop loss will be here. This time the stop loss will be above because you have taken a sell side trade. A because you have taken a sell side trade. A short side trade has been taken.
[51:06] Ok? I told you all this. The same rule applies in sell trade also, brother. I have written this here. Yes, I will give you the summary also. This summary is for you. Please remember this brother. This is the final warning.
[51:21] Well yes, this is a very important thing. Whenever any big news comes like RBI meeting, budget, Fed announcement, Trump created some storm. So this price action does not work. Let me tell you this also. News works at that time. Whether there is
[51:35] crossover or not, that one news ruins everyone's game. If the news is good then the market will start running without crossover. If the news is bad, the market will crash even after the crossover. So when some big news comes and the setup is being created, you should avoid it.
[51:51] That setup could go wrong because big news has come. After that I told you that we have given the link of the Twitter channel. Our team teaches us every day. It helps you in trading. Basically, they make
[52:06] you trade there in crypto. It helps and teaches you to trade different cryptos , gold, US stocks , crude oil. Everything is free. There is no charge anywhere. We have given the link of Coin DCS in the description.
[52:19] Ok? Follow the charts I have shown you on Trading View. You can follow this also. But what happens sometimes is that the charts of Bitcoin Crypto on every happens sometimes is that the charts of Bitcoin Crypto on every exchange and every platform are a little bit
[52:32] different. If the price is ₹70 on TradingView then the price of the coin may be ₹70,200 on DCX. If the price is 7020 on some other bank then these are the differences in crypto. So that is why if you are trading at point DC in crypto
[52:48] Otherwise you difference. You should proceed with that much consideration. Correct? Link disclaimer of both, please listen to this brother. This document and the information contained in it are for educational purposes only.
[53:05] 51 13 EMA strategy or any trading setup mentioned in it. No financial advice is an investment recommendation or a guarantee of profit. I have already said this in the beginning. There is a
[53:20] invested capital, all your earnings can be wiped out. Past performance or the fact that a strategy has worked in the past does not guarantee that it will work in the future. not guaranteed. There is a possibility. Make
[53:39] money as you would not be saddened by if it were to be lost. Sagar Sinha means I am not responsible for any profit or loss that you may incur from any trading decision on this channel or any platform associated with it,
[53:55] brother, practice with very little money or trade on paper. You write down, at this price I would have taken a trade in Bitcoin if this had happened. Now see what happened. Now even if there is a loss, there is no you have written it on paper. If you make profit then you will gain confidence. Hey, if I had taken it seriously, I would have made
[54:10] money. Ok? That's why practice is very important. Whatever I tell you, you will execute it exactly the same. Its chances are less. So definitely practice. I taught the entire concept.
[54:22] Now the question arises, sir, where can we get this document that we need ? You will find this document ? You will find this document in the link of the crypto prote telegram channel in the same telegram channel.
[54:34] okay brother? Is there anything left? Somehow, some question explained everything. If any question comes to your mind, write it down without any hesitation, it is a guarantee. I will not reply in the comment box but I will definitely answer you in some upcoming session. There
[54:48] is complete guarantee of this. So, useless the question is, I want students who don't know anything and I guarantee I will teach them. Hey, anyone can teach clever people.
[55:03] Those who are a little less clever. Teach those who are less clever, meaning those who have less knowledge. And I always try to teach them. Is it okay brother? So please do let us know by writing in the comment box. Well, that's it for today.




⚡ Saved you 0h 55m reading this? Transcribe any YouTube video for free — no signup needed.