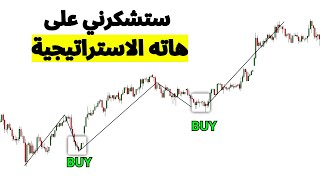

Trend-Following Secret: Trade with Strength
60sExplains a core trading concept in a simple, actionable way that appeals to beginners and experienced traders alike.
▶ Play Clip"The title promises a single strategy for all markets, which is delivered, but the heavy promotion of a paid course reduces credibility."
This video presents a day trading strategy based on trend following and momentum. The strategy involves identifying a strong initial move, a pullback, and a second stronger move, then entering after a transitional phase and a final manipulation. It is applicable to Forex, crypto, stocks, and commodities.
The strategy is a trend-following approach for all markets: Forex, crypto, stocks, and commodities. It works for scalpers, day traders, and swing traders.
Always trade with the trend and strength. Look for an initial strong impulse, then a pullback, then a second move that is stronger in speed and momentum than the first.
After the second strong move, wait for a pullback equal to or greater than the previous pullback. Then identify a transitional phase where price stops making lower lows or higher highs.
Look for a final manipulation (a strong move in the opposite direction) that traps traders. Then enter in the direction of the original strength after the manipulation candle closes.
First target is the previous peak (for buys) or trough (for sells). Second target is the 127 Fibonacci extension of the entire wave if the pullback is larger than the previous one, or of the last wave if equal.
Shows a buy setup on gold: strong upward move, pullback, second stronger move, then a pullback equal to previous, transitional phase, manipulation, entry above the manipulation candle, target hit at 127 extension.
Bitcoin example: strong upward impulse, pullback, second stronger move, pullback equal to previous, transitional phase, manipulation, entry above the strong green candle, first target peak, second target 127 extension reached.
The strategy: 1) First move with pullback, 2) Second move stronger, 3) Pullback equal or greater, 4) Transitional phase, 5) Manipulation, 6) Entry with stop loss below/above transition, 7) First target previous peak/trough, 8) Second target 127 Fibonacci extension.
The strategy relies on identifying momentum shifts and using Fibonacci extensions for profit targets. It emphasizes trading with the trend and waiting for confirmation through a transitional phase and manipulation.
What is the first condition for a valid trade setup in this strategy?
A strong initial impulse move, followed by a pullback, then a second move that is stronger in momentum than the first.
03:24
What must the pullback after the second strong move be relative to the previous pullback?
It must be equal to or greater than the previous pullback.
04:06
What is a 'transitional phase' in this strategy?
A consolidation where price stops making higher highs (for uptrend) or lower lows (for downtrend), indicating a potential reversal.
05:47
What is the 'manipulation' step in the strategy?
A final strong move in the opposite direction of the trend that traps traders (e.g., a false breakout) before the price resumes the original direction.
06:43
What are the two profit targets in this strategy?
First target is the previous peak (for buys) or trough (for sells). Second target is the 127 Fibonacci extension of the relevant wave.
07:12
How do you determine which wave to use for the 127 Fibonacci extension?
If the pullback is larger than the previous pullback, use the entire wave from the start of the first move. If equal, use only the last wave.
07:12
Where should the stop loss be placed for a buy trade?
Below the transitional phase (the consolidation area).
07:12
What does the strategy require regarding momentum in the second move?
The second move must have increased momentum (speed and acceleration) compared to the first move.
03:38
Trade with the Trend
Emphasizes the importance of trading with the trend and strength, a fundamental principle.
02:10Second Move Must Be Stronger
Key condition that ensures momentum is increasing, providing higher probability trades.
03:38Transitional Phase Concept
Introduces a consolidation phase that signals potential reversal or continuation, a nuanced market behavior.
05:47Manipulation as Entry Trigger
Describes how to identify false moves that trap traders, providing a precise entry point.
06:43Fibonacci 127 Extension Target
Uses a specific Fibonacci level for profit targets, a common tool in technical analysis.
07:12[00:03] Today I will share with you the only day trading strategy you won't need if you want to profit from trading in all markets, whether you are a beginner or a professional, and
[00:15] whether you are a scalper, day trader, or swing trader. This strategy will help you trade This strategy will help you trade all financial markets: Forex, crypto, stocks, and commodities. It is one of the strongest strategies we use in the "
[00:32] strategies we use in the " Knowledge Knows the Lie" family. But before we begin this technique and this lesson, I invite you to subscribe to our free Telegram channel. Here is the link; click on it directly from the description box of this video. Do not write your name
[00:46] or picture. Beware of scammers. After clicking on this link, you will immediately become a member of this free channel where I share with you the earnings of participants in our
[00:58] training courses. As you can see, the profits are enormous, God willing. Notice the amount of profit: more than $1400 from three trades. As you can see, that's $500 in very good profits achieved by
[01:11] our students. Notice the $18,000 in gold and silver, brother Caesar, thanks to such strategies. Strategies, especially this one I'm sharing with you today, are frequently used in
[01:23] several trades to achieve the profits we're seeing now, profits that my students are making. Notice, $1500 in one go, and so on. Similarly, in this free Telegram channel, we share the latest and strongest offers with you. The last offer I'm providing is this one.
[01:40] So, if you want to join the knowledge family, if you're interested in our training courses and teaching methods and you like them, you can join. Take a minute or two to read the offer carefully, and then you can contact me directly on Telegram privately, and I'll answer you, and your learning journey will begin. So, let's begin,
[01:58] with God's blessing, and talk about today's strategies that I want us to adjust if we want to achieve profits in trading. It's a daily trading strategy, as I said,
[02:10] trading. It's a daily trading strategy, as I said, for all markets: Forex, Crypto, Stocks, and Commodities. So, for all markets: Forex, Crypto, Stocks, and Commodities. So, firstly, this strategy is a trend-following firstly, this strategy is a trend-following strategy. We always prefer
[02:23] to trade with the trend; you shouldn't trade against it. Determining the trend always remains Determining the trend always remains relative, depending on your skills and your knowledge.
[02:35] You can determine the trend correctly or incorrectly. This means that some people define the trend, incorrectly. This means that some people define the trend, and it's a trend that lacks strength. Because when I say "trend," I'm directly and implicitly saying it equals
[02:52] strength. So, I always want to be with the strength. And when I say strength, I mean the big boys, the strength. And when I say strength, I mean the big boys, the big players, the big players. And the big players, big players, the big players. And the big players,
[03:09] hedge funds, and so on. So, the question for this strategy to be effective is: how do I be with the strength? How do I trade with the strength? So, all I want to
[03:24] see is an initial move that is strong, a strong impulse, then a pullback or a correction, or call it what you want, or a range, or call it what you want, then another move. But I want this
[03:38] want, then another move. But I want this second move to be stronger, stronger in speed, in acceleration, in momentum. This one needs to be stronger than the first. So, if I want to see the strength of
[03:50] something, for example, if I want to look for a buy, I want to see an upward trend, a higher peak than a higher peak and a see an upward trend, a higher peak than a higher peak and a higher trough than a higher trough, but with increasing momentum. This last move needs to be stronger than the first one. Very nice.
[04:06] Then Next, I'll look for a pullback, or a pullback, or a reduction. This pullback might be equal to or greater than this one, but what I want to see in this pullback is a
[04:22] decrease in the strength of this trend. Because this trend, this pullback, is also a downward trend. Notice with me that's why I told you that the trend is relative. If I ask what the
[04:35] trend is relative. If I ask what the prevailing or strong trend is, if we look at the prevailing or strong trend is, if we look at the general picture like this, then the strong trend is upward. general picture like this, then the strong trend is upward. But if we
[04:47] look at this area only and ask you what the market trend is, you'll say, "Excuse me, excuse me, excuse me, only and ask you what the market trend is, you'll say, "Excuse me, excuse me, excuse me, brothers, brothers, thank God," you'll say it's a downward trend. So, I want
[05:02] thank God," you'll say it's a downward trend. So, I want this downward trend because I want to trade buys because the momentum and strength are upward, because the increase in momentum is upward, because the strength is upward, because the strong movements are these, and this pullback is nothing but a pullback.
[05:18] are these, and this pullback is nothing but a pullback. Notice how it is; it's a pullback of the oscillator. Excuse me, apologize to you. So, what do I want to see? I want to see this
[05:31] want to see? I want to see this pullback. This drop will either be equal to this one, greater than it, or greater than the first one. But the important condition is that there must be a decrease in strength—a decrease in strength. I always see a decrease in strength. I always see a decrease in strength. Then, the second thing I want to
[05:47] in strength. Then, the second thing I want to see—you must know that the trend doesn't change see—you must know that the trend doesn't change arbitrarily, easily, or quickly. There must be a arbitrarily, easily, or quickly. There must be a transitional phase before the market rises. So, there must be a
[06:01] transitional phase before the market rises. So, there must be a transitional phase where the price stops moving. Here, notice a low below its low, below its peak, a low below its low, below its peak, a low below its low, and a peak below its peak.
[06:14] Here, the price stops giving us a low below its the price stops giving us a low below its low, below its peak. We are now at equal lows and equal peaks. This is the phase I was talking about, the transitional phase.
[06:28] about, the transitional phase. So, after I get this transitional phase, I want to see manipulation. Finally, a
[06:43] transitional phase, I want to see manipulation. Finally, a strong drop that manipulates you, drawing you into sell orders. Then, after this, strong drop that manipulates you, drawing you into sell orders. Then, after this, I want to see upward force, strength in the rise. And after that, this is it. My opportunity to look for an upward move: My first target is this
[06:57] to look for an upward move: My first target is this peak as the first target, and my second target is the 127 peak as the first target, and my second target is the 127 Fibonacci extension for this wave. If this pullback is greater than this, then if this pullback is
[07:12] this pullback is greater than this, but if they are equal, then the 127 Fibonacci extension will only apply to this wave. From here to here, I repeat, focus with me carefully, my brothers and sisters, this is very important. Let's go back to a specific color.
[07:43] okay, if I just want to take the color I was holding, I don't know why. Okay,
[07:56] to the color. Okay, now let's go back. Let's go back. A downward now let's go back. Let's go back. A downward trend. If I want to see the first move,
[08:09] how will I know that the trend is down? If I want to see the first move, then the pullback, then the second move, but I want the second move to be strong, I want it to be
[08:24] I want the second move to be strong, I want it to be strong, stronger than this move. I want it to be stronger than this one, so an increase in momentum, an increase in momentum. Very nice. So after I get that strength, then Where is the strength now? The strength is downward. So what will
[08:40] now? The strength is downward. So what will happen? They're just trying to trick me into thinking the price will happen? They're just trying to trick me into thinking the price will rise. I want to see this pullback, and I want it to be either equal to or greater than this pullback. I want to see a higher peak than the previous peak, a peak that fell on a
[08:53] trough—meaning an upward trend, an upward trend, an upward trend. But I also want to see that I've reached that transitional phase that tells me the trend might change because I want to
[09:05] tells me the trend might change because I want to trade with the strength, the momentum, the selling pressure. When I start to see this transitional phase, I want to see manipulation. Finally, they'll get
[09:18] you into buy trades because you see the trend is upward. They'll get you into a buy trade, and then, boom, there will be a upward. They'll get you into a buy trade, and then, boom, there will be a strong crash, a powerful candle, the biggest candle in this range. Then I can confidently enter a sell. My first target is this trough, and the
[09:35] confidently enter a sell. My first target is this trough, and the second target is 127 in the Bonacci extension for this entire wave because this pullback cancels it out. So, this all becomes pullback cancels it out. So, this all becomes one wave, like this boom.
[09:49] Therefore, the second target will be at this area, 127. Secondly, here I leave you completely free to leave you completely free to take 50% here and the remaining 50% there, or
[10:05] move your stop loss to the breakeven point when it reaches this area and take the full 100 pips here, or this area and take the full 100 pips here, or take the full 100 pips here without waiting for 127. You are take the full 100 pips here without waiting for 127. You are free because everyone has their own trading style, their own
[10:20] free because everyone has their own trading style, their own patience, their own level of courage, and their own way of patience, their own level of courage, and their own way of handling money. What's important to me is to give you a day trading strategy, one of the best strategies that will allow you to start making
[10:33] strategies that will allow you to start making profits tomorrow if you apply it. I will share with you a profits tomorrow if you apply it. I will share with you a set of examples that I have prepared so that you understand the technique well. So now the strategy is clear, easy, simple, not difficult at all.
[10:49] Let's look at some examples. Let's look at gold on the hourly timeframe, for example. Notice here, for example. Notice with me, I want to
[11:03] see the strength. Where is the strength located? So notice with me, notice this movement. The price rose to this area, then a pullback, then this movement. So notice, if the strength A very nice buy signal. If
[11:21] notice, if the strength A very nice buy signal. If you give me a pullback equal to or greater than this, we get this. The pullback is greater than this. Very nice. This will be useful for us. This will help us determine the target of that 127. Notice,
[11:37] I want to see a downward trend: peak, trough, on top of its trough, below its trough, below its trough, below its peak. Notice, notice, we've reached this area. Notice what
[11:49] reached this area. Notice what happened. It doesn't mean that at first we were breaking the troughs, but here, after the break in this area, we can no longer break the troughs. So we can no longer break the troughs. So this is the transitional phase. The
[12:02] this is the transitional phase. The transitional phase is this area. This is the transitional phase here. And that last manipulation, you saw it, that last manipulation that will bring your income into sell trades, then boom! Notice the strength here. Notice the strength here.
[12:17] So my entry will be directly above that candle. Buy. My entry will be directly above this Buy. My entry will be directly above this candle. Buy. My stop loss is below here in this candle. Buy. My stop loss is below here in this area. My first target is this peak if the risk
[12:31] return is good and if the distance allows it. and if the distance allows it. The distance didn't allow for that. I will directly target the 127 in the Bonacci Extension for the whole movement. In this case, I will take the whole wave. Why will I take the
[12:46] case, I will take the whole wave. Why will I take the whole wave? Because this pullback is from this pullback. Notice only the two circles. This circle is bigger than this one. So this cancels out. So these will all become one wave. So I will take the
[13:02] 127 in the Bonacci Extension. And indeed, the target was hit very easily. Boom! And the sal flew away. You notice a strong strategy, my brothers and sisters, very strong. Just focus on it and understand. Understand the logic
[13:15] behind it. Understand the logic behind it. Also, as I said, we require that there be a deficiency in momentum. we require that there be a deficiency in momentum. This movement. Notice the deficiency in momentum.
[13:31] Notice the difference between this movement and this movement. Where is the force? Is it buying, selling, or bearish force? You'll notice if it's
[13:46] selling, or bearish force? You'll notice if it's buying force, and that's how we understand it. We know this simply, without using indicators or any nonsense. Just by the condition and your intelligence, you can understand these things. Let's look at another example. Let's look at another example so we can benefit more. Yes, let's say a
[14:02] another example so we can benefit more. Yes, let's say a four-hour movie. example live right now. Notice [laughs].
[14:14] I have the first movement, then a pullback, then a second movement. You'll then a pullback, then a second movement. You'll
[14:26] compared to this pullback. Notice this circle with this circle. This is a large pullback, and this is a small pullback. It cancels, it doesn't appear in front of this. This pullback,
[14:38] this large circle, covers the small one. Let's do it this way: the large one covers you. You won't see it if you're standing here because this one is large and covers you. A large stone covers this small stone. So, that's why I didn't take this into account. I need something to cover this
[14:54] large stone, or something equal to it. Or bigger than that. What happened? We started to get an upward trend. Notice, notice the upward trend, peak upon peak, and there's strength, there's strength. Then notice, suddenly
[15:07] we can no longer break this peak. So, I have that transitional phase with transitional phase with that downward force. You notice, with that downward force, so since I have an increase in selling momentum, then I have selling strength,
[15:24] selling strength, selling force. And since I have a pullback, selling force. And since I have a pullback, this is bigger, and since I have the transitional phase, notice, we couldn't break the peak, we couldn't break the peak or close
[15:38] the peak, we couldn't break the peak or close above it strongly. We couldn't even from here. We couldn't from here. So, this tells me that we are in a transitional phase. There is fatigue for buyers, there is a lack of momentum, a lack of strength, fatigue in this rise, knowing that it is a rise.
[15:54] lack of strength, fatigue in this rise, knowing that it is a rise. What rise? People will see buying. They will see buying. If you zoom in, people won't forget that the force is selling and will look for buying. They will forget
[16:08] that the force is selling and will look for buying. We will sell. The candle's bottom is directly above the strong candlestick. Our stop-loss is above this area. This will be the initial bottom, but not the exact bottom. Notice that I have a
[16:23] Notice that I have a zone called the preparation zone. My zone called the preparation zone. My target will be this zone where the price first stopped, meaning it dropped and then stopped. This is my zone. So this is my first target
[16:37] exactly. It has been hit now. The Extension for this wave or for the entire wave. Now, I'll give you a minute to think about this wave or the entire
[16:52] wave. Yes, for the entire wave, because this pullback Yes, for the entire wave, because this pullback hid it. This pullback is hid it. This pullback is large. So this is the entire wave. So this
[17:07] large. So this is the entire wave. So this will be the second target, 127 in the Bonacci Extension will be the second target, 127 in the Bonacci Extension for the entire wave. So, as we said, for the entire wave. So, as we said, we sell from the candlestick's bottom. The stop-loss is above it, and
[17:21] we sell from the candlestick's bottom. The stop-loss is above it, and my second target is here. You can see this. If the my second target is here. You can see this. If the first target is achieved, you can take 50% first target is achieved, you can take 50% and leave 50% as a break-even point, for example, until you reach the
[17:38] target at this zone and take 50%, or you can shift your current loss time from The entry zone is from this area to the entry zone, which is called the breakeven. This means you secure your trade and wait until it
[17:50] reaches this point, then you take 100% if you're certain the price will reach that zone. This is how a trade is executed. certain the price will reach that zone. This is how a trade is executed. to use the technique as you see fit, according to your personality, because everyone trades differently.
[18:08] Let's look at another example, my brothers and sisters. Bitcoin, for instance. sisters. Bitcoin, for instance.
[18:22] then this pullback, then this strong movement with increased momentum. then this strong movement with increased momentum.
[18:34] Very nice. I'll tell it to give me a pullback that's either equal to or greater than this circle.
[18:47] If you notice, they're equal to each other. Okay, okay. So, when it gives me this pullback, I want that decrease in momentum. Let's increase that decrease in momentum a little.
[18:59] Then, that transitional phase. Notice this phase. This is our transitional phase. this bottom was broken, a transitional phase began. There was
[19:16] transitional phase began. There was clear strength here and there for entry, and the best opportunity was this strength. Here, it was possible to enter directly above this area. This
[19:28] strong green candlestick, if it could be entered directly above it, buy. The stop-loss should be below the entire transitional phase. The first target is this peak. This is the first target is this peak. This is the first target, and the second target is 127 in the Fibonacci
[19:43] extension for this last wave, which has increased momentum because this pullback increased momentum because this pullback and this one are equal. If they don't cover each other, it won't be and this one are equal. If they don't cover each other, it won't be one wave. Let's see if it reaches 127.
[19:55] Let's see if it reaches it or not. As you can see, it reached it. So this is my second target: As you can see, it reached it. So this is my second target: 127. 27 Fibonacci extension. You notice the 127 127. 27 Fibonacci extension. You notice the 127 Fibonacci extension. If you take 50% here and take
[20:10] Fibonacci extension. If you take 50% here and take the remaining 50 here, take 30 at the peak and 70 here. Move the stop-loss to the entry area here. And you take 100%, you're free. You manage your trade as you here. And you take 100%, you're free. You manage your trade as you wish. The important thing is that you have the
[20:25] tools and the weapon that will allow you to manage these trades as you want. Notice these examples; they are very, very easy and simple. Let's look at Ethereum, for example, cryptocurrencies. I went with you through
[20:37] Forex, then cryptocurrencies, the same thing here. Notice the last two movements: this movement, then we have this pullback, then this strong movement
[20:49] with this pullback. If you notice, they are equal, two circles. Notice how I make the circle. This circle will make things easier for you. I am trying to simplify the technique for you because trading is a simple profession, not one that is complicated and causes you to
[21:03] lose your money. On the contrary, if you simplify it for yourself, you will not lose your money. If you notice, there is an increase in momentum. This movement is stronger than that movement. momentum. This movement is stronger than that movement. If the trend is upward and the strength is upward, then I
[21:18] want to be with the buyers. I want to be with the strength. If I just want to give you a decrease in the The momentum, then that transition phase, then if there's any manipulation or
[21:30] transition phase, then if there's any manipulation or anything excellent, then the strength. At that point, I can look for buying. If I can buy directly above the strength, because this strong candle appeared, the first target is this peak directly. My stop loss is below the transition phase,
[21:46] transition phase, and the second target is 127 in the Bonacci extension for this wave. I don't think it reached it in this case. I don't think it reached it. It was close, but it didn't reach it, and this will be your second target. So, at least take 50% and leave 50%, take 30 and leave 70. You'll
[22:04] lose it. The important thing is to act in your trade as you want. I'm giving you freedom now. You have a range of freedom to choose how you want to manage and run
[22:17] freedom to choose how you want to manage and run your trades after you enter the trade. Notice your trades after you enter the trade. Notice here in the D-Chief, my brothers and sisters, here in the D-Chief, my brothers and sisters, notice this movement, the first movement,
[22:31] then this correction or pullback, or I call it what you want, then this strong movement. Notice, notice, notice, notice. At this point, you'll ask me why I didn't count this correction.
[22:44] ask me why I didn't count this correction. I'll tell you that circle. This circle is too large to be visible. If this is all one wave, then this is
[22:59] visible. If this is all one wave, then this is canceled. If I have this movement, which is the first movement, and I have this movement after this corrective pattern, and I have this movement, which is the after this corrective pattern, and I have this movement, which is the second movement, an increase in momentum, then
[23:12] second movement, an increase in momentum, then either you give me an equal circle, either you give me an equal circle, meaning a pullback, or a larger one. If it's slightly larger, maybe a little larger, or there's
[23:27] larger, maybe a little larger, or there's some doubt about them, let's consider them close to each other because one is like this and one is like that. Let's consider them close to each other. So here, in this case, we got this pullback, as you can see, a strong pullback. Then
[23:45] pullback, as you can see, a strong pullback. Then suddenly we saw a strong bounce, and this strong bounce broke this wall, the last wall. So here's another method or another technique that we So here's another method or another technique that we 'll discover together, which is what's called the
[24:00] 'll discover together, which is what's called the range. As you can see, here was this manipulation, then it returned. If we go directly to the range, this is the transitional phase. If this is just a fake breakout, a false breakout, and this is our transitional phase,
[24:18] Your first target is the peak as the first target, and your second target is second target is 127 in the extension of this wave. Since we said they are close to each other, we haven't reached 127; we've only reached the
[24:38] only reached the peak as the first target. So, the entry will be directly after breaking the range because this is our range. This is the transitional phase. If there is a breakout with some strength, and you notice the candle has strength, then you can enter a buy order
[24:56] directly above the candle and place your stop loss below this range. Below this range, that's how it is because this is a fake breakout, as we said, a false breakout, and this is the transitional phase false breakout, and this is the transitional phase I talked about. It can be identified in several ways, and it's
[25:11] not that easy; you need to have experience in identifying this. experience in identifying this. As you can see, a successful trade achieved its first target.
[25:25] Note that if you see these strong movements, you will look to sell, not strong movements, you will look to sell, not buy, but you will forget that the strength It's a buying buy, but you will forget that the strength It's a buying strategy, and you'll forget that there's buying power. This buying power
[25:38] must end first. You need to have a decrease in momentum, a decrease in momentum, and then the price might crash. But when you have buying power, be careful. Even if there's a when you have buying power, be careful. Even if there's a strong downward movement, it will rise
[25:53] when you have an increase in momentum. Even if you have a you have an increase in momentum and then experience a strong downward movement, it will rise,
[26:09] momentum. After that, it will crash, like what happened here: breaking the peak, and then a crash. You'll notice that this is how we here: breaking the peak, and then a crash. You'll notice that this is how we identify the power, and this is how we trade with the power. I've given you several examples; let's summarize. So, all I'm
[26:24] looking for in this simple strategy is the first move with the pullback, and then the second move should be strong. This move should be strong. When I get this strong move,
[26:36] then I say, "Okay, I want to go with the power," meaning I want to buy. But when? After that... power," meaning I want to buy. But when? After that... Get a pullback equal to or greater than this. If I get the pullback, pullback, come on, come on, you gave me, oh, you gave me greater than, okay,
[26:51] where is the transitional phase? Where is the transitional phase? Yes, yes, yes. transitional phase? Yes, yes, yes. Give me a final manipulation, a strong boom. Ah, my buying opportunity. My stop-loss is here. My first target is here, and my second target is 127 in the Bonacci Extension for this entire
[27:07] wave as a target, as my target. If this is greater than this, if they are equal, I always bring Fibonacci from this move to
[27:21] always bring Fibonacci from this move to here, then I go back. There will be a difference in the target of 127. This is for buying. For selling, it's the same. Let's also discuss the selling scenario. I want to see the movement: a strong move, then a pullback,
[27:37] I want to see the movement: a strong move, then a pullback, then a second move that is stronger and faster. The acceleration increases, the momentum increases, the then a second move that is stronger and faster. The acceleration increases, the momentum increases, the momentum increases. Then after that, I will tell it to give me a pullback equal to this or greater than it. So here, in this case, let's
[27:51] say it gave me a pullback equal to this and started to make that transitional phase for me, then a final manipulation, then a strong boom. This is my opportunity to search, meaning for selling. My stop-loss is above my first target. This is the
[28:04] first target, and my second target is 127 in the Bonacci Extension. This time, I will get it from Bonacci Extension. This time, I will get it from here. The wave is only because they are equal like here. The wave is only because they are equal like this, and this is the second target, 127 in Bonacci, a
[28:17] kind of extension. from this strategy. Try it; you will achieve beautiful and very beautiful profits from it. If you
[28:29] want to join the community, if you want to master such techniques, this strategy—meaning it's 01—is
[28:49] If you want to join the family, this is the right offer. You won't find a better offer than this to master the science of logic in trading. I offer you the science of logic in trading. Read the offer, contact me directly on Telegram, and I will answer you. Your journey begins, and you learn, apply, and achieve
[29:05] profits at the same time. Don't forget that our goal is to teach you, and that science doesn't lie. Peace, mercy, and blessings of God be upon you. Trading is a scary world; it can ruin your life one day. I discovered a YouTube channel
[29:21] called " Science Doesn't Lie." I started browsing this channel, "Science Doesn't Lie," and I saw valuable information in it. I see and I saw valuable information in it. I see something I haven't discovered in the past 25 years. It's
[29:36] something I haven't discovered in the past 25 years. It's true that I trade, and I don't consider it a huge part of my life, but rather something I enjoy. Some people trade to make a profit and
[29:48] put their most important money, the money they live on, into trading [music]. If they lose that amount, they lose their lives and live with problems. Thank God, I don't have that problem, but I love trading. I love something about numbers. Since I was young, I was supposed to be an engineer, but I became a doctor
[30:06] because I love numbers. I love trading because it involves techniques. I'm a cosmetic surgeon, so I also love cosmetic surgery. I'm a cosmetic surgeon, so I also love cosmetic surgery. These techniques involve numbers, lines, and beautiful aesthetic elements. The world of trading isn't just about buying and selling stocks. It's related to psychology,
[30:22] patience, greed, and many other psychological factors before it's technical. Professor Wissam, on this channel, " Science Doesn't Lie," teaches you all of these
[30:36] things. Honestly, you can check YouTube and see all the comments from people, including myself. You would n't believe the amount of information there is. You learn it from
[30:49] Professor Wissam, who has two courses: the basic and the advanced. I enrolled in both and learned real trading. I enrolled in both and learned real trading. I haven't reached the stage where we can call myself a professional yet. Maybe I'm not following all the steps Professor Wissam teaches,
[31:05] the steps Professor Wissam teaches, but look where I was and where I am now! I advise everyone to join Professor Wissam's channels. Of course, my opinion of him is biased; everyone testifies to his skill. But I insisted on making a professional video for him in this way, from my clinic. I told them to come to
[31:20] my clinic, and I would make this video as a gift to the person who truly deserves this gift, Professor Wissam. He deserves every word of praise that can be said about him. He is someone who cares about your money and
[31:34] someone who cares about your money and wants to teach you the truth about trading. I wish you wants to teach you the truth about trading. I wish you success and hope you join and stay away from success and hope you join and stay away from schools that might be profitable for a certain time. They
[31:46] schools that might be profitable for a certain time. They might be useful for a while, but do they give you a 100% chance of a real winning trade? Absolutely not. A salute to the advanced wave, Professor Wissam! I give you a
[31:58] high probability, almost 100%, that you will get the information that will help you succeed, God willing. Good luck, God that will help you succeed, God willing. Good luck, God willing.
⚡ Saved you 0h 32m reading this? Transcribe any YouTube video for free — no signup needed.