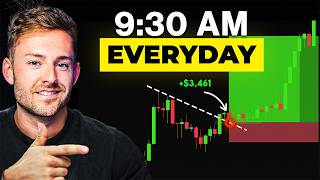

Why Simple Trading Beats Complex Strategies
45sChallenges the common belief that complex strategies are needed, offering a counterintuitive and relatable insight that resonates with struggling traders.
▶ Play Clip"The title promises a simple trading model with live execution, and the video delivers exactly that with clear steps and real examples."
This video presents a simple yet effective trading model that focuses on repeatability and risk management. The trader explains how to use 15-minute fair value gaps and 1-minute entry criteria to find high-probability trades, demonstrating the strategy with live examples and real profits.
The hardest part of trading is making strategies repeatable, not complicated. Keeping it simple allows for daily opportunities.
Use a 15-minute chart to mark fair value gaps from the past 1-2 days. These gaps act as targets or confirmation zones.
Look for a change of character (trend reversal) on the 1-minute chart, then use Fibonacci retracement (50-78.6% zone) and a 1-minute fair value gap aligned with a liquidity inflection level.
Enter at the midpoint of the 1-minute fair value gap. Place stop loss outside the gap-producing candle, ideally beyond multiple gaps. Reduce to break even after a close below a key low.
Initial take profit at 4R. Use 15-minute fair value gaps as profit targets. Trail stop loss using market structure to let winners run.
The trader executed a trade making $15,300 by following the model, demonstrating real-time decision-making and risk management.
The key to consistent trading is a simple, repeatable model that filters opportunities, keeps losses small, and lets winners run. The presented strategy, based on fair value gaps and market structure, can be applied across different markets and timeframes.
What is a fair value gap?
A sequence of three candles where the first candle's wick does not overlap with the third candle's wick, leaving a gap in between.
02:30
What is a change of character in trading?
A trend reversal indicated by a candle close below a previous pivot low (in an uptrend) or above a previous pivot high (in a downtrend).
06:04
What Fibonacci levels are used for entry in this model?
The 50% to 78.6% zone, ideally the 61.8% level.
06:58
Where should the stop loss be placed?
Outside the fair value gap-producing candle, ideally beyond multiple gaps to increase probability of not being stopped out.
08:53
When should the stop loss be moved to break even?
After price closes below a key low (in a downtrend) or above a key high (in an uptrend) following entry.
09:32
What is the initial take profit target in this model?
4R (four times the risk).
11:24
What is a liquidity inflection level?
An area where price has previously struggled to break through and then finally breaks, indicating a likely reversal or continuation zone.
04:17
Simplicity is Key
Contrasts common belief that complex strategies are better; emphasizes repeatability over complexity.
00:02Fair Value Gap Definition
Core concept of the model; provides a clear, objective way to identify key price levels.
02:30Change of Character
Critical signal for trend reversal; used to filter high-probability entries.
06:04Systematic Risk Reduction
Moving stop to break even after a close below a key low protects capital and allows winners to run.
09:32Live Trade: $15,300 Profit
Demonstrates real-world application and profitability of the model under live market conditions.
23:29[00:00] Getting good at trading does not require some complicated strategies. And honestly, it's the opposite. What I've noticed from nine years of trading is that a lot of traders are coming into trading over-complicating strategies, acting like they're trying to do brain surgery,
[00:15] when really, the hard part about trading is not making the strategy complicated, but rather making it repeatable and easy for you to manage. That's where trades are really won and lost. And by keeping it simple over this time, I'm now able to get daily opportunities to do trades like this, like this, and like this,
[00:31] just focusing on a simple model, two timeframes, and about one to two hours a day of focus. And I think this is why I've been able to help so many individual traders, regardless of their starting skill or account size, by focusing on what matters and not just adding more information.
[00:46] And I know a lot of you guys are probably dealing with this right now. There's a ton of information out there. You're studying, watching videos, and maybe it seems like the more you learn and the more you add, the more confusing it gets. That's because you need less information, but more of the right
[01:01] information. And that's exactly what I'm going to share with you in today's video. I'm going to break down a very simple trading model that presents multiple opportunities each day with clear entry criteria that allows winners to run, keeping the losses contained, and most importantly,
[01:15] is simple and repeatable. Okay, and I'm not just going to go show you a bunch of hindsight examples because it's really easy to see stuff after it happens. I'm going to show you exactly how this works in a live setting with real decisions, real money, and real pressure on the line. That way,
[01:30] by the end of this video, you'll be able to learn this model, find the opportunities yourself before you determine whether it's useful or not, and you'll see the power and opportunity opens each and every session and exactly how it's executed in real time. Okay, so let's dive into
[01:44] the strategy. Okay, so step one of this process, I'm going to outline this via a illustration and explain in very simple terms where we're starting off with, starting from the higher time frame finding the ideas all the way down to the lower time frames where we're going to be finding the
[01:58] opportunities and executing on them. Okay, step two of this, we're going to actually go over to our charts, mark it up in real time, starting at the beginning of the session. You can see exactly the thought process behind it. Then I'm going to show you me executing this in a live market
[02:11] to see exactly how it works in real time and the opportunities that it brings. Okay, so step one, we want to go over to a 15-minute time frame on our trading view chart and look at the past one or two days worth of price data. So if this red line here is going to be where the market is
[02:27] opening, this is going to be the previous day's price action where each one of these candles is showing us 15 minutes worth of price data. Okay, all I want to do as my first step is mark out what are called 15-minute fair value gaps. Fair value gap is basically where we have a sequence
[02:41] of three candles where the first candle's wick doesn't overlap with the third candle's wick, and it leaves a space in between, which you can see right here. Okay, this is going to be called a fair value gap. And these are basically going to be key areas that we want to look for. I'm
[02:54] going to show you how we're going to use them in a second. So you can see there's another one in here that I want to mark off. And then if you look where our other gaps are, you can see we have one here that was respected, but then invalidated by price moving through it. So I don't really want
[03:07] to mark those out anymore. Only valid fair value gaps that are still working. So you can see this one was respected and never disrespected. So I'll draw one here. We have another one right here and another one right here. That's the first step. And the reason we want to mark these out is because
[03:21] these are going to act as either targets or confirmations to be able to enter into a trade. So if we're already in a trade, we'll use them as target areas. If we're not in a trade and we're looking for an opportunity, we're going to be waiting for price to come into these areas and
[03:35] confirm a response off of them to then be able to move into each step two of our process. Basically, what this is allowing us to do is very simply find areas where price is going to be drawn to because price is going to want to draw two pockets of liquidity when the market has momentum
[03:51] through these areas typically there's orders left behind here and the market is constantly trying to seek equilibrium so all the market's trying to do is balance itself out these are going to be key areas where price is going to be gravitated to and if it respects those levels it can be indications
[04:05] of price continuing to move in that direction okay so you can see whether we get one of these red fair value gaps where price is moving down and we have bearish candles or if we have a bullish for a value gap with a bullish structure here. Either way, that's going to show us a confirmation.
[04:19] Additionally, on this 15-minute chart, what I want to look for as well is basically areas where price has trouble breaking through and then finally does break through. Because at these liquidity inflection levels, when price typically is responding, responding, breaks through, when
[04:34] it tested on the opposite side, this is going to act as an area where price has a likelihood of not being able to fully break through on the opposite side, which matched up with these 15 minute fair value gaps can give us really high conviction areas of price to be able to move away from
[04:50] that. And that's what we're looking for when we're setting up trades. We want to find areas where price is likely to reverse in a direction or continue in a direction to then go down into a tighter timeframe, place those really accurate entries, and then be able to play price into the direction we're looking.
[05:02] So I do want to look for these liquidity inflection levels, which are basically trend line breaks. Okay, so we have one right here as well, right here as well. you just want to mark those out on your chart. Moving into step number two, now we want to look for our one minute entry criteria.
[05:15] So now we're dropping down into a one minute timeframe, whereas we have our 15 over here and our one minute over here. Now, this red line is going to be our New York stock market open. Whenever the market opens, that's where a rush of volume
[05:27] is going to pour into the market. This is where I'm mostly focusing on my trading. A lot of people use London session, Asian session, so it doesn't really matter which session. Okay, but this is where I'm focusing on my trading because there's a influx of volume
[05:39] which brings a lot of movement and a lot of opportunity. So let's say we have our 15-minute chart here, and we have our levels marked out. Okay, assuming we get a confirmation, right, we have this gap and this gap, both with price coming into it, responding off of it, and then rejecting away from it,
[05:54] we can now move into step number one. We want to look for something called a change of character. Okay, so basically what a change of character is, is if we have a trend moving up with our low, higher high, higher low, higher high, higher low,
[06:07] and then attempt at a high. This now becomes our pivot point which if we can get a candle close below this level which you can see we have a candle close here that is called a change of character And that indicating that this sort
[06:21] of trend momentum is potentially wearing out and is potentially the beginning of a downward movement or an upward movement. Right now I'm showing an example of price going down, but this can be done in both directions. The second thing that I want to do once I see this point is take what's called
[06:36] a Sibonacci retracement. I'm going to show you how to use this on TradingView. But basically what this is, it allows us to click and drag from the beginning of this move down to the low before price starts to make its way up after this change of character. And we want to look for these numbers
[06:51] here. You can see we have 23.6, 38.2, 0.5, 61.8, and 78.6. These are naturally occurring ratios, basically the code of the universe. And what I want to do is be able to find and look for areas
[07:05] around this 50 to this 78 point zone. Ideally, at this 61.8 level, which is our golden ratio. Okay, this is the Fibonacci ratio. If we can have it aligned perfectly with that,
[07:17] the closer to that, the better. Step three, what I want to do is find a fair value gap now on a one minute time frame that is at least at the 50 level or basically between this 78.6 and 50 level,
[07:30] which you can see we have right here. You'll notice step number four, what we're looking for it now is our one minute liquidity inflection level. So you can see price responding here, here, here, and then finally breaks underneath this level. What I want to do is aim for that
[07:44] one minute gap that aligns really well with price coming up, responding off of that opposite side, and then continuing to move to the downside. Because you'll see we also have a fair value gap in here, which I can target as well. This is sitting at that 61.8 level, but I may miss it
[07:59] because of this liquidity inflection level. So I'm sort of keeping track of that and adding this as sort of a bonus, what's called confluence, which is giving me a little bit more evidence towards the trade being a good idea.
[08:11] But at the minimum, I want these two things to align and for it to be within that parameter. It's that simple. Step number two complete. Okay, step number three is where we're gonna actually be building out our positions. Okay, so this takes a little bit more planning
[08:23] and a little bit more experience, but I'm gonna explain to you exactly how I look at doing this. And this pretty much applies to trading in general, just using market structure and common sense when you're looking at price action. Okay, so let's take our one minute example here.
[08:36] When I'm setting up a position, what I want to do is target the midpoint for the 50% point of this fair value gap. And I'm going to be setting an entry up here, entry at midpoint. My stop loss, I want to place at least outside of this fair value gap producing candle, which
[08:53] you can see right here. But ideally, considering in this scenario that we know we also have a gap here, I want to position outside of that gap as well. And well outside price being able to come up and respond off of this level before making a move down.
[09:07] This is going to increase the probability of my stop loss being outside of these key areas. A lot of people will just set up arbitrary stop loss values. I want to enter here. I'm risking this much to get a one to two. putting your stop loss just based off of where you want it versus where the market is telling
[09:23] you to put it is a big mistake in my opinion. I always want to be placing stop losses where the chart tells me rather than where I want it to be. And once we have price put in this low here, which we assume if we get filled is going to be that low, this is going to be the area where once
[09:39] we get a close below this level, I'm going to reduce my stop loss to break even. Okay, so initially I'm risking say my one unit of R here. If price is going to move away from this and produce a close underneath this low, what that's telling me, the same way we see over here, if we
[09:55] have a low, high, low, high, if we are to break underneath and close underneath this low level, this trend is now over, right? Assuming that I'm getting into this after a potential new trend
[10:09] has started, once price closes beyond this point, it shouldn't be making closes past this point. If we're trading in the right direction of the trend, so I'm just following market mechanics and I've ran this over thousands of data points.
[10:21] This is the most effective way to reduce risk on these trades and get out of losing trades if it's not going to work in our direction. They don't interfere with the upside of the trades that do work out. It's all about reducing risk once you get those initial moves because what you have
[10:34] to realize is we're trading off of price action, right? We don't know where the market's going to go. The market moves randomly, but there are higher probabilities in certain areas if we as traders and boil it down, right? But it's always best to be able to reduce risk systematically
[10:48] to admit when you're wrong as fast as possible and continue to allow the trade to run when you are right so that when you have losing streaks or you're not hitting good trades, you have a really, really big buffer built by allowing those winners to run
[11:01] and not trying to take the profit off the table as soon as possible. I struggle with this one, but I'm just explaining to you, this is what we want to work towards conceptually. Okay, so you'll see in this example, Price comes down, pulls up, responds beautifully off of that liquidity inflection level and off of this 61.8 value while responding to our fair value gap entry.
[11:21] You can see price consolidates, moves down, produces a close here. This is where we would reduce our stock loss to break even and remove the risk on the trade. And all I'm going to do to start off is set my take profit at 4R.
[11:35] realistically what I want to do is now aim for the midpoint of these 15 minute fair value gaps as my profit target because if price is going to respond off of this the next logical area that the
[11:48] market is going to go to seek equilibrium is going to be into one of these areas okay so we want to set it to 4x originally but then we can just use market structure in trailing to target further
[12:00] and further gaps okay this is where on the private team a lot of traders are trailing this for 20 times their risk, 30 times their risk. We have a lot of mechanisms that we go over. In order to be fair to them, I'm not going to go over how we get these Goliath trades. I'm going to more focus on
[12:13] that solid one to four and allowing trades to run, generally speaking. Overall, we're trying to target these areas outside of one to four. And so that's basically the model. I tried to simplify it the best way I possibly can So now let head over to trading view and let look at some examples over the past couple of days of price action And I going to show you how many times this opportunity pops up Okay so let start off with yesterday price action which is the example I just showcased but I want to show you how to do it on TradingView
[12:39] So I'm going to first e-run through my thought process and all the things that I use on TradingView to be able to do this. There's a few indicators that I like to use. One is this foundation indicator, which is actually my indicator. It's super simple. All it allows us to do is be able to show where the New York stock market is opening.
[12:55] If you open up these settings, you can actually toggle on London sessions, different sessions as well. So you'll be able to sort of keep track of where that session has started. Then you also have the opportunity to be able to toggle on fair value gaps onto your chart.
[13:07] Okay, on my 15-minute chart, I like to add fair value gaps to populate on the chart automatically. So I'll click into my indicators tab here and just type in fair value gap. This one is my favorite one right here. So if I click on that, that's going to automatically populate all of these gaps to show me automatically where they are.
[13:23] So you don't have to draw them out. You can just look at them. So if you click on this tab up here, you can put the 15 minutes next to the one minute, and it's going to basically do most of the work for you. So I'm looking at the previous day price action. I'm seeing where my targets are and I'm seeing overall we had price breaking out of this area.
[13:38] We definitely have a liquidity inflection level up here, which I'm not really going to play into until it were to happen. We also have another one sitting right in here, which you can see on a one minute timeframe. We've had multiple responses off of before dumping down to the downside.
[13:51] So we're clearly breaking to the downside. Now, if we look over at our one minute timeframe, you can see we had our downtrend here. Price eventually made a close above. So now we have an uptrend and now we have this level right here giving me my change of character.
[14:05] So I'm going to mark out my change of character confirmed right here. Next thing I'm doing is clicking onto my trading view, clicking on Fib Retracement right here, clicking from this point down to that low point and seeing if there's any fair value gaps that are aligning into this region.
[14:19] You can see, once again, we have one and two. So now I'm looking at my liquidity inflection level and I'm seeing if price were to make its way up to this level, am I going to be able to get filled on this one up here? Maybe I can, maybe I can't.
[14:32] Okay, but I know that I can get filled on this one and have it respond off of my 61.8. So I don't want to be able to miss out on this move and this is going to interact with more of my analysis. We do have a gap here and we have gaps here.
[14:45] We also have a gap down here, but once again, this is well below this zone and not coming in contact with any sort of liquidity inflection level structure. So it's really easy to just get in and take a bunch of these trades and then lose, lose, lose, lose.
[14:58] I'm trying to filter it out to be able to align with the response that we see on our higher time frame. So the candle pushes into this gap and then dumps off of it. And then how can I target on a shorter time frame these good areas? So then you can see I'm setting up my position at the midpoint of this gap.
[15:13] I want to play outside of this candle so that even if I'm wrong about this one, it can come in to respond off of this other key area as well. And both trades are going to be acceptable. And then I'm just betting a 1 to 4 to start off with.
[15:25] And you can see at this 1 to 4, it's at least bringing me down to this fair value gap's midpoint, which was already respected and continued into. So I'm assuming price will at least try to reattempt this point here, which should get me pretty close to a 1 to 4.
[15:39] But at least allow me to be able to reduce risk, which is the most important part. If price is going to come and test this again and invalidate it, this is going to be my next stop. And then after that, this is going to be my next stop. And I can sort of walk my soft block down to be able to play into really big moves to the downside.
[15:55] So I'm going to set at 1 to 4 at this gap and then watch it play out. Okay, so if I click into my position box here into the settings, I can input, say, my $100 worth of risk. That's going to show me how many units that I need, whether it's futures, crypto, doesn't matter.
[16:08] It's a 454 units. Okay, so we can see price comes up into that area. We can set our stop loss at this value. Our take profit is dynamic. We'll place that 1 to 4. Now we're just waiting for this next move to happen.
[16:22] Either we're going to get stopped out and we keep our risk contained, or we get that close below this level, which happens here. And that's where I can now move my stop loss to break even. Zero risk trade.
[16:34] Stop loss is at break even. Okay, and now we're going to watch to see how price responds. And now we can basically just let the price do its thing and we're not so worried about it because it's a risk-free trade. It's either moving in our direction or it can move against us and the opportunity isn't going to fully play out.
[16:48] So we come down, respond off of the midpoint again of this gap. So this is where sometimes I'm taking partial profit. So I can take 50% of my position off here. That way, if this is the lowest it's going to go before making a move to the upside, I've locked in a good chunk of profit.
[17:04] 2R, 3R sometimes. I can also allow the rest of the position to continue to run if it moves in my direction. You can see price eventually jumps down through that area and then comes in contract with our original 1 to 4, 1 to 5 into this gap.
[17:16] Okay, and this is where we have a lot of options on how we can trail and continue to hold positions. Now, like I said, this is what I talk about on the private side of the team, so I want to be fair with what I share on YouTube. But what I'm doing is just basically using market structure to walk the stop loss down.
[17:30] So even if we want to trail on candles or use an RSI highlight on our 15 minutes, we can do that and basically just allow the trade to be able to dynamically move around until, say, we get a candle to fully close with a highlight zone, in which case we're now able to hold this position to make eight or nine times the amount of money that we were risking initially.
[17:50] So we can then proceed to be wrong about 10 of these trades back to back and still be breaking even on the account. All we're trying to do is put ourselves in these advantageous positions and filter down enough to be able to give ourselves a slight edge over time.
[18:03] Okay, this is not a miraculous strategy where it works every single time. That's not how trading works. Anyone who's saying that they have a strategy that works 100% of the time either is risking so much more money or they're completely lying.
[18:15] Okay, the goal of this is to be able to let those winners run and keep the losses contained. you'll see exactly here even written that hundred dollars this is almost nine hundred dollars of profit okay does it make sense pretty understandable let's take a look at some other examples again i'm
[18:28] not going to cherry pick any examples let's just go to the previous day before this i can scroll through also if you want any of these indicators it's all in the tools in the description all right let take an example here again we basically have price actions moving down for the whole entire session we have these gaps and if we really don have any sort of price action for price to move down into it usually means that there a lot of space for the price to move down if it going to
[18:52] It's basically like an empty vacuum where price can just have free price discovery. So whenever I see situations like this, obviously price is continuing to move down for the entire session. If we break to the upside, these are going to be my target areas, but if we don't, we're going to
[19:06] play into that void. So let's take an example here. We have price moving down. Here's our change of character to the upside so this is our now uptrend so I'm kind of getting a grasp on that. Okay we actually have price breaking out of this area as well to the long side producing this fair value
[19:21] gap down here and if you look at our Fib level you'll see this exactly came perfectly down to that area and that 61.8 after we have our change of character. Okay however we're moving in a completely downtrend and we're having a bearish response off of this fair value gap here so even
[19:38] that we have our good technical level here, this is not adding up with what we're looking for on the shorter time frame because we don't have any bullish fair value gap for us to be able to have conviction that this is going to continue moving up. So sort of a way of filtering it down.
[19:52] Good temporary price action that ends up melting to the downside. But you can see how the entry mechanics work. This needs to be aligned with the overall picture. Okay, so let's take the next opportunity here. You can see this is sort of our liquidity inflection level. This is our change of
[20:06] character level, considering this is a high put in. So even though we have a gap here, if we click and drag our fib down, this is not going to get put into our perfect area. So you're going to see, even though this is a beautiful area and it aligns off of this liquidity inflection level,
[20:21] we didn't quite pull up into this area, right? So it really comes down to experience and what you want to choose as to which, do I have all the rules lining up or just a few of them, and which one basically improves your bottom line. See, something like a trade like this,
[20:35] We have two out of the three shorter timeframe confirmations, and then we have confirmation on the higher timeframe as well. So you basically have three out of four of all your rules lined up, and we have a close underneath this level here.
[20:47] So I would probably take something like this, which you can see, once again, does end up breaking and making a substantial move to the downside. It sort of comes down to each individual trader to do this and take note on a journal or something where it's like checkmark of all the things I followed.
[21:00] And then if you want to see if you didn't follow those things, whether you would have made more money over, say, 50 or 100 trades, that now becomes your updated rule. The reason I like to show all of these rules as a requirement right away, until you get that experience,
[21:13] you want to basically have the tightest filtration possible, and then you can start to be liberal based on your experience. Let's say we didn't take that trade, all right, and we're being good. We're waiting for the full change of character, which we finally get right here. Okay, you can see we still have our liquidity inflection, which has now kind of moved down to this area.
[21:28] So now we can take a fib from this level off of this level, right? We still have a break to the downside and a response confirmation up here. You can see we have our gap that is causing this change of character right here. So once again, it's about aligning ideologies. So if we're able
[21:43] to set our position up right here, so even if this gap gets filled, this gap gets filled, and we get any sort of response off of this level that had trouble breaking and then finally breaks to the downside with force, we can set up our one to four. We have our change of character, 61.8,
[21:59] and fair value gap, higher time frame alignment with the response off of the 15 minute price action. So we can enter in here again and you can see once again that's the perfect area to be able to enter into. Okay so let's literally go back to the previous day. Okay so on this day you can see
[22:14] we really don't have that many opportunities lining up. It's not really the proper structure lining up. It just sort of melts off for the session. So let's go to the previous one. Okay so if we look at this session price is clearly making a move up except for the fact that we have
[22:27] a change of character put in here on the 15 minute time frame and we have a bearish fair value gap being put in right here on a 15 minute. Okay so this is a little bit pre-market but I just want to showcase it as an example. We have a gap right here Fibonacci with 61.8 zone right in the same
[22:44] exact vicinity. This is where our liquidity inflection level is happening a little bit wider and you can see prices coming back into this gap here. Okay so if I positioned outside of all of this price action and back down into the midpoint here you can see that's going to get me over my
[22:59] one to four you can see price comes up to that area makes a move down closes below this low which would allow me to reduce my risk to break even and then price continues to move in the down direction finally puts a close in with the highlight down here which once again you'd be able to make nine
[23:15] times what you're risking now this happened a little bit pre-market maybe it's acceptable maybe it's not but the goal is to understand if we can have that alignment these opportunities present themselves a ton. Okay, so now let's watch me actually execute this in a live environment.
[23:29] The reason that I put together this initial example is because this isn't a hindsight thing that I was looking at. This is actually the trade that I took yesterday where I was able to make $15,300. Okay, you can see, once again, I have my liquidity inflection level here. I set my entry
[23:44] a little higher because I was late to getting my order in, but still would have entered right into this gap. I have my change of character. Fib level is aligned. You can see I have my take profit value set down here. Price is continuing to move to the downside. I take off partial tier and lock
[23:59] in 5.8k and I'm floating the rest of the 6k and I'm walking my stop loss down to basically trail this position. I was targeting this fair value gap down here. I'm up 10,000 on the other portion of the trade. I get taken out of the trade earlier and then price does actually end up coming down to
[24:14] my full take profit, but I was able to lock in that 15.3K. Okay, this is largely what we're focusing on on the private side of our team. See, one of our top traders here, Nednar, starting with 1K, has already been able to
[24:26] scale up to 8. Okay, you can see Liam here, just by a hair, even though it's sad that he missed this, 19R trade that he was looking for. So that means with $100, that's $1,900 in profit. Okay, you can see Scooby with an 8.8R trade that he took right here.
[24:40] So really, with the right foundations, the right filtering, and the right frameworks to be able to manage this. These are the opportunities at hand. If you guys want any of the tools, whether it be journals or indicators, you can find those in the description under tools.
[24:52] You can watch other videos right here. If you wanna trade live with us and get a full education mentorship, you can check that out right here. But until next time, guys, I will see you all in the next video.


![How To Start Day Trading As A Beginner In 2025 [Full Tutorial]](https://img.youtube.com/vi/xHU5MHuUSKI/mqdefault.jpg)

⚡ Saved you 0h 25m reading this? Transcribe any YouTube video for free — no signup needed.